Image generated by ChatGTP-4o
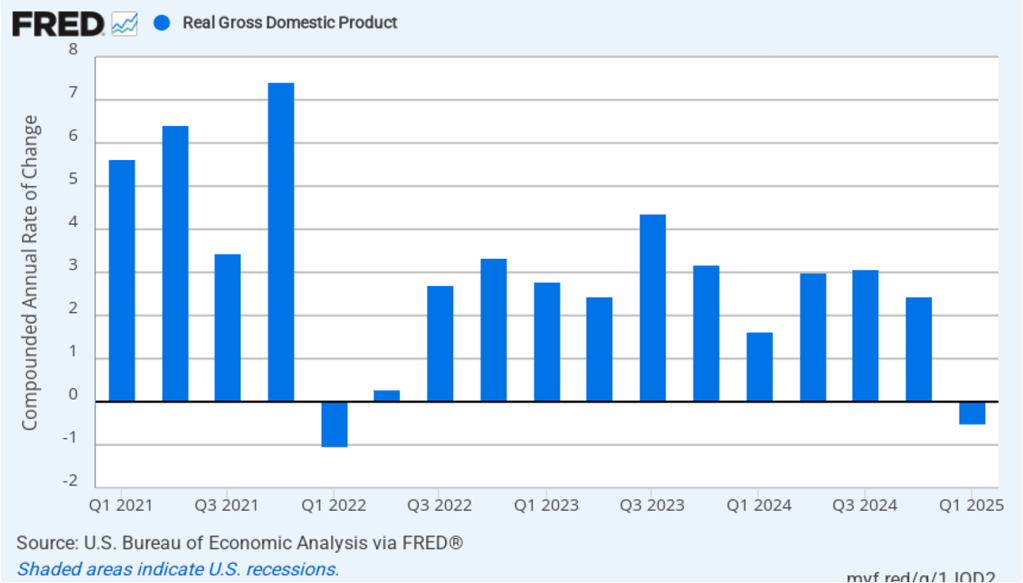
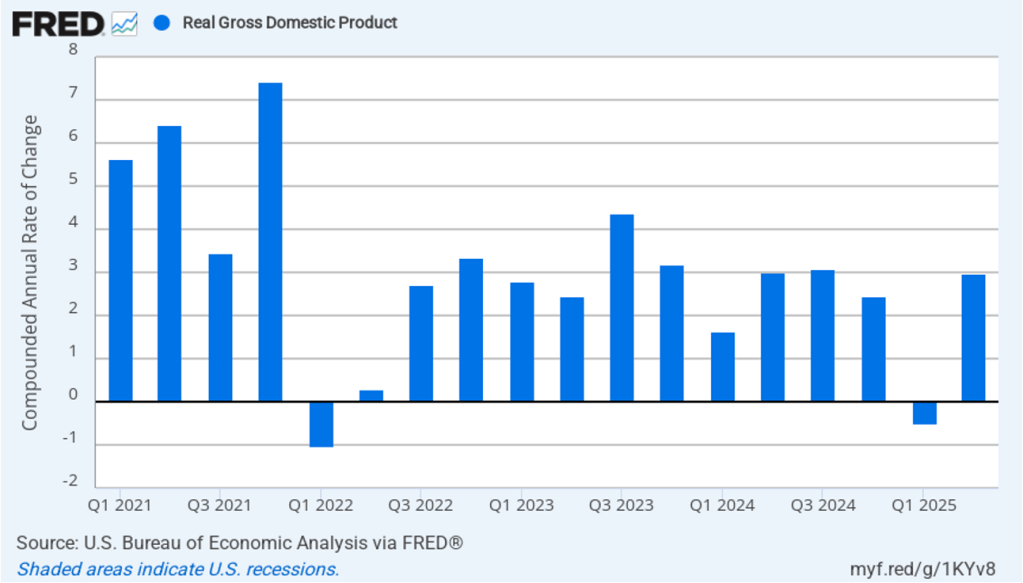
This morning (July 30), the Bureau of Economic Analysis (BEA) released its advance estimate of real GDP for the first quarter of 2025. (The report can be found here.) The BEA estimates that real GDP increased by 3.0 percent, measured at an annual rate, in the second quarter—April through June. Economists surveyed had expected a 2.4 percent increase. Real GDP declined by an estimated 0.5 percent in the first quarter of 2025, so the increase in the second quarter represents a strong rebound in economic growth. The following figure shows the estimated rates of GDP growth in each quarter beginning with the first quarter of 2021.
As the following figure—taken from the BEA report—shows, the decrease in imports in the second quarter was the most important factor contributing to the increase in real GDP. During the first quarter, imports had soared as businesses tried to stay ahead of what were expected to be large tariff increases implement by the Trump Administration. Consumption spending increased in the second quarter, while investment spending and exports decreased.
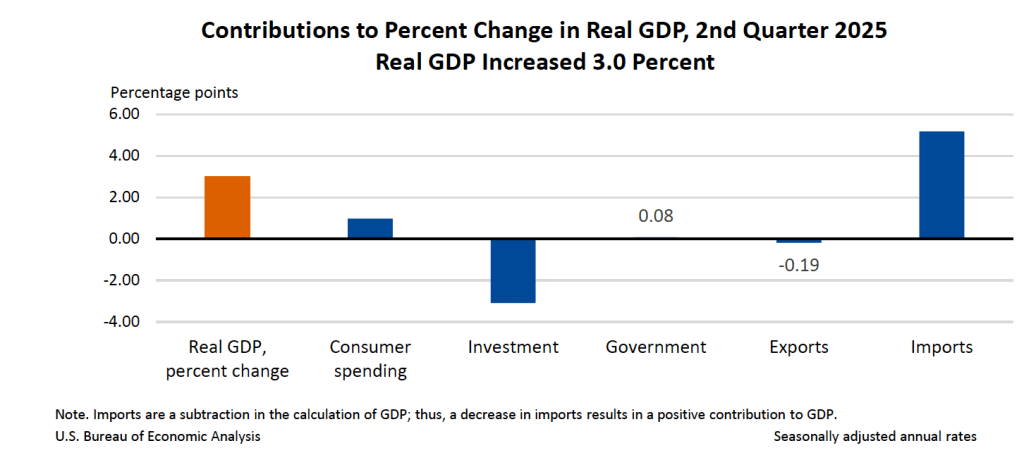
It’s notable that real private inventories declined by $29.6 billion in the second quarter after having increased by $2070 billion in the first quarter. Again, it’s likely that the large swings in inventories represented firms stockpiling goods in the first quarter in anticipation of the tariff increases and then drawing down those stockpiles in the second quarter.
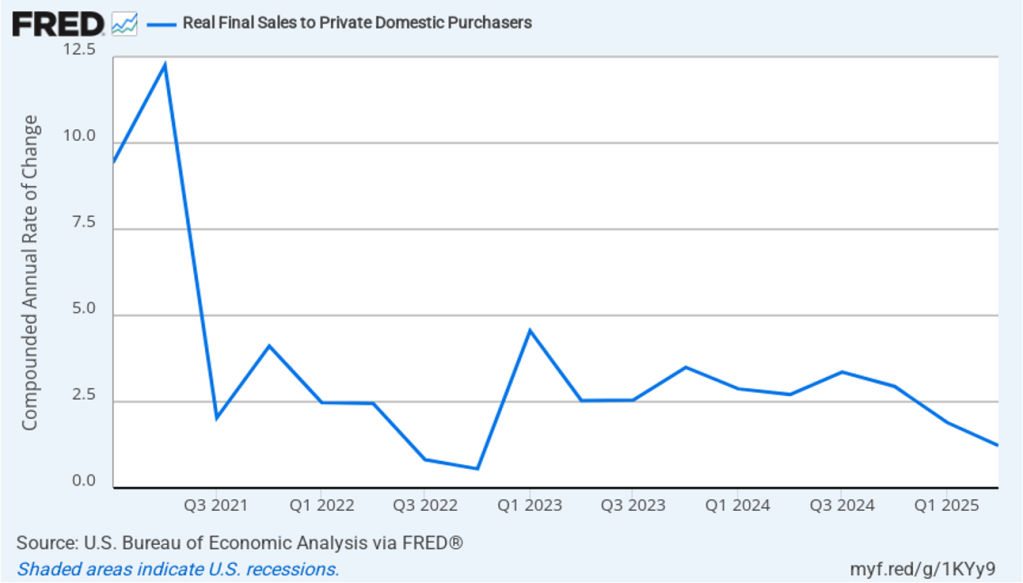
One way to strip out the effects of imports, inventory investment, and government purchases—which can also be volatile—is to look at real final sales to domestic purchasers, which includes only spending by U.S. households and firms on domestic production. As the following figure shows, real final sales to domestic purchasers increased by 1.2 percent in the second quarter of 2025, which was a decrease from the 1.9 percent increase in the first quarter. The large difference between the change in real GDP and the change in real final sales to domestic purchasers is an indication of how strongly the data on national income in the first two quarters of 2025 were affected by businesses anticipating tariff increases. Compared with data on real GDP, data on real final sales to domestic purchasers shows the economy doing significantly better in the first quarter and significantly worse in the second quarter.
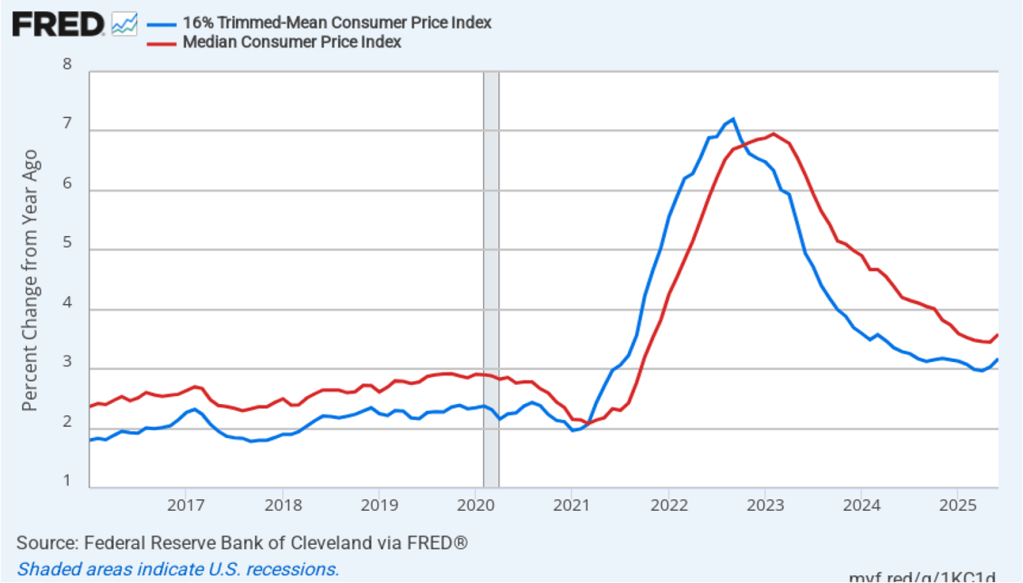
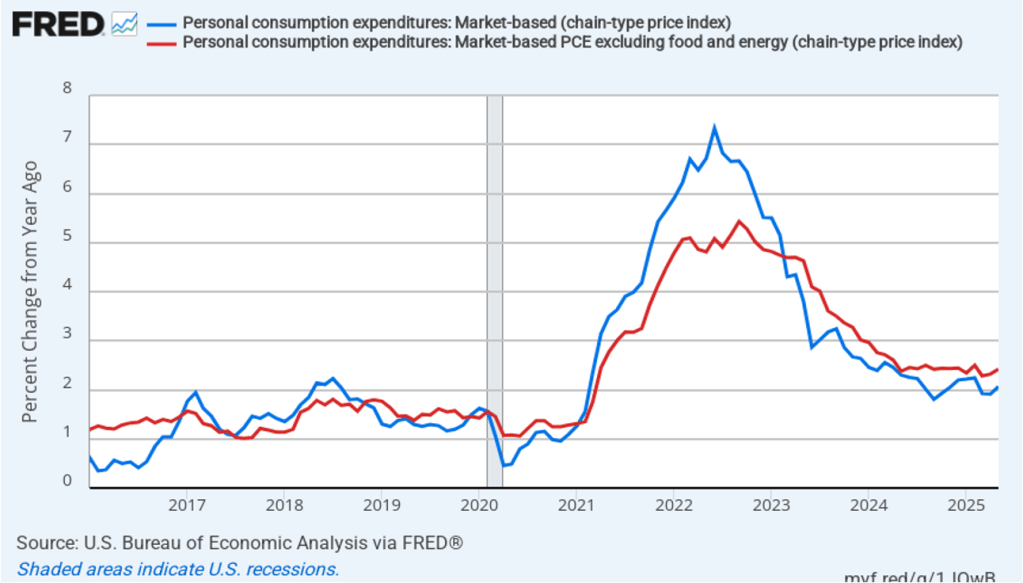
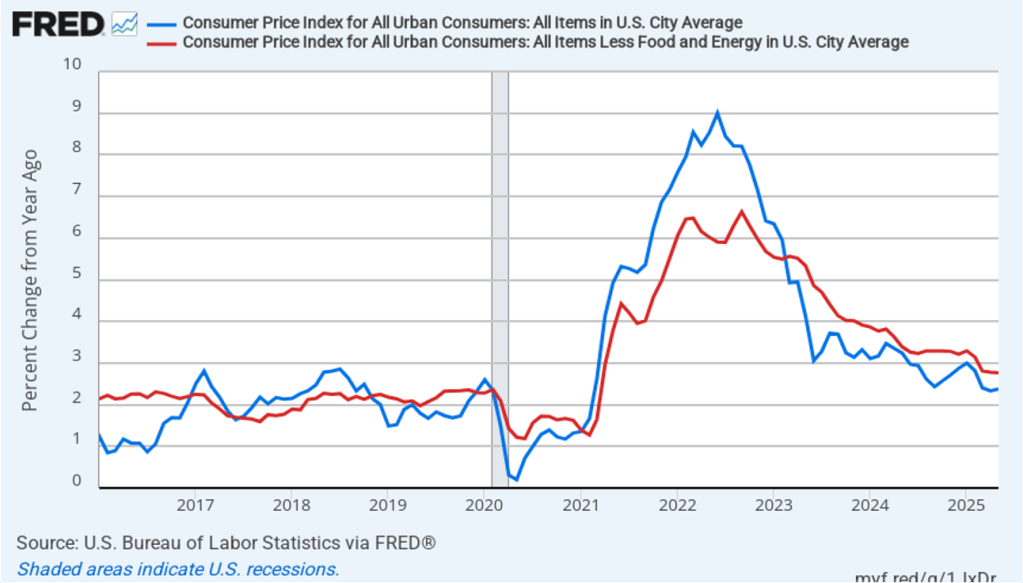
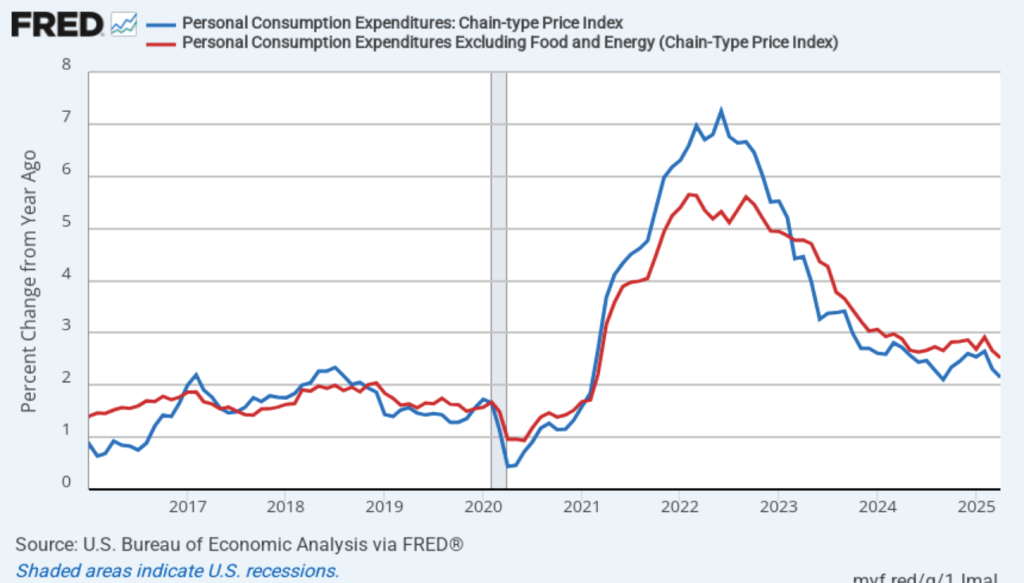
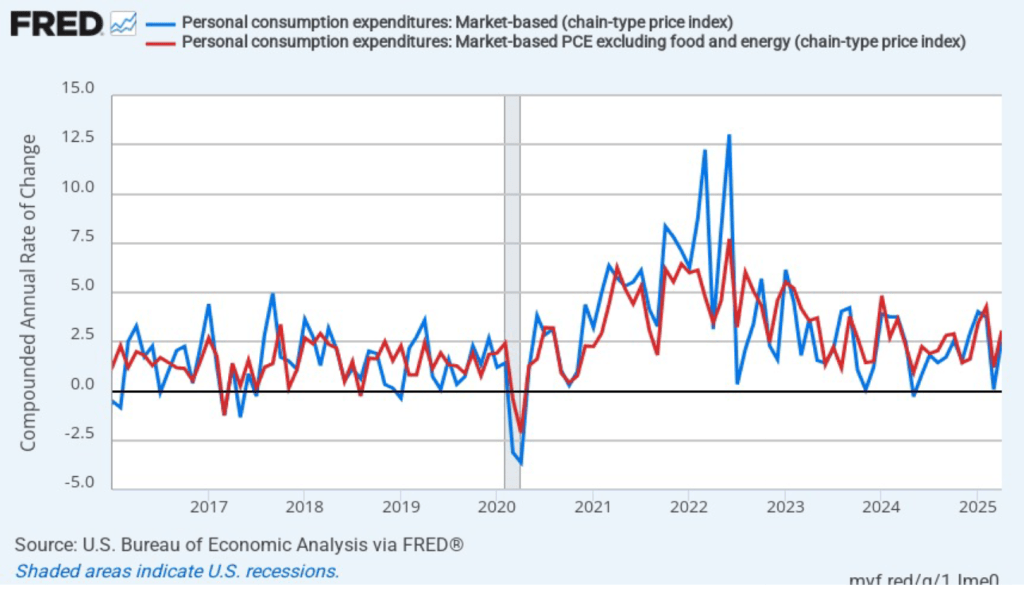
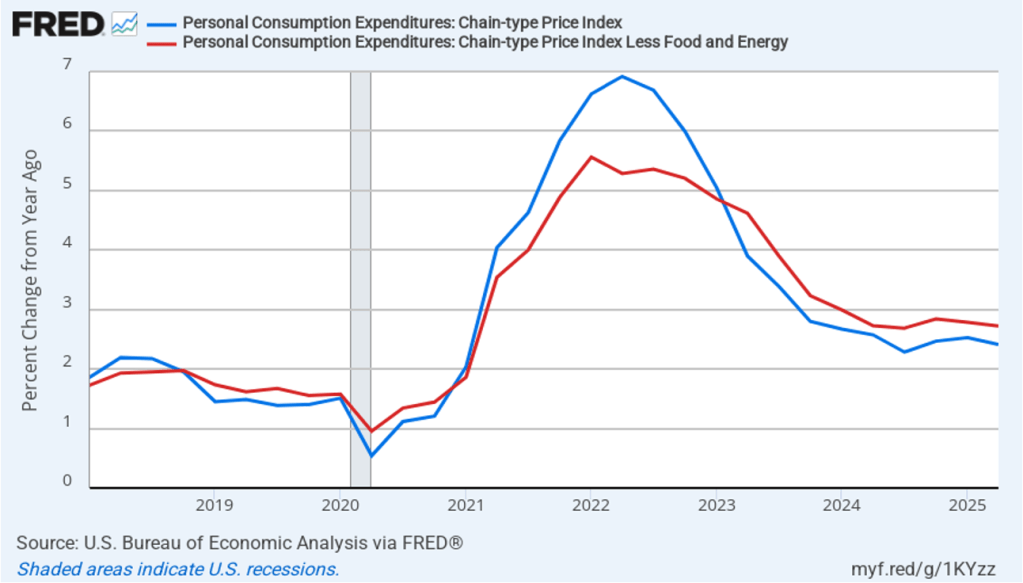
The BEA report this morning included quarterly data on the personal consumption expenditures (PCE) price index. The Fed relies on annual changes in the PCE price index to evaluate whether it’s meeting its 2 percent annual inflation target. The following figure shows headline PCE inflation (the blue line) and core PCE inflation (the red line)—which excludes energy and food prices—for the period since the first quarter of 2018, with inflation measured as the percentage change in the PCE from the same quarter in the previous year. In the second quarter, headline PCE inflation was 2.4 percent, down slightly from 2.5 percent in the first quarter. Core PCE inflation in the second quarter was 2.7 percent, down from 2.8 percent in the first quarter. Both headline PCE inflation and core PCE inflation remained above the Fed’s 2 percent annual inflation target.
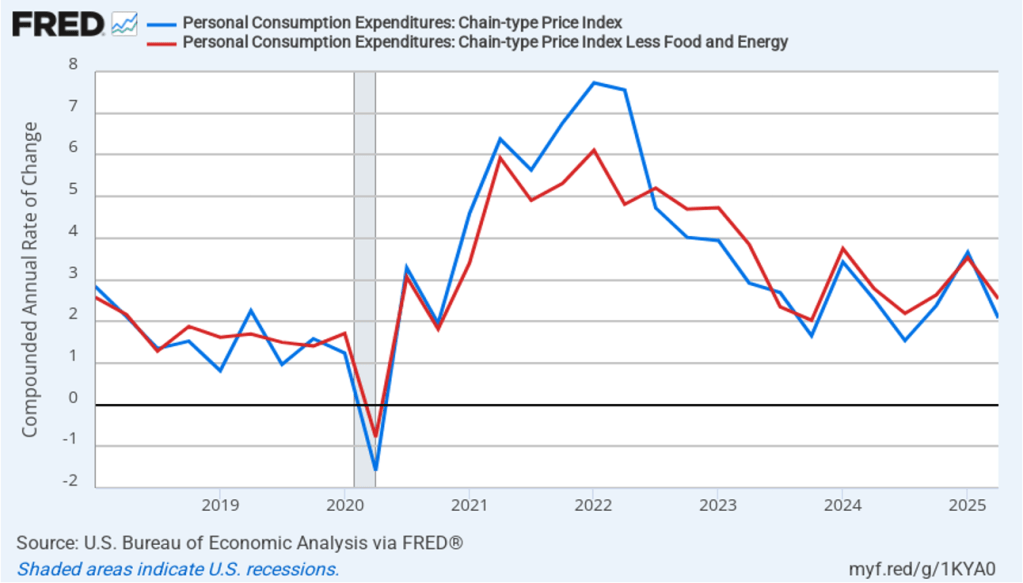
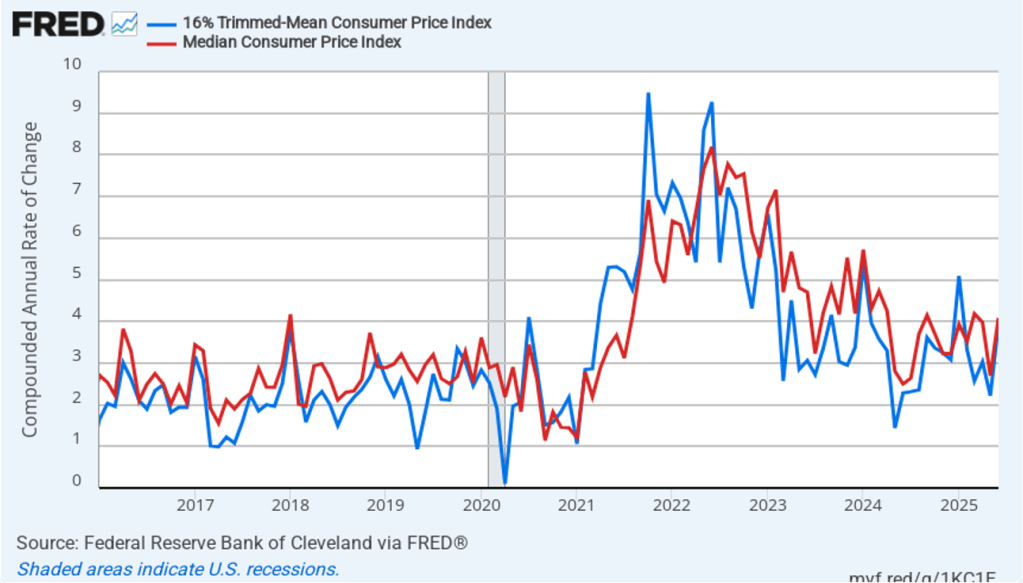
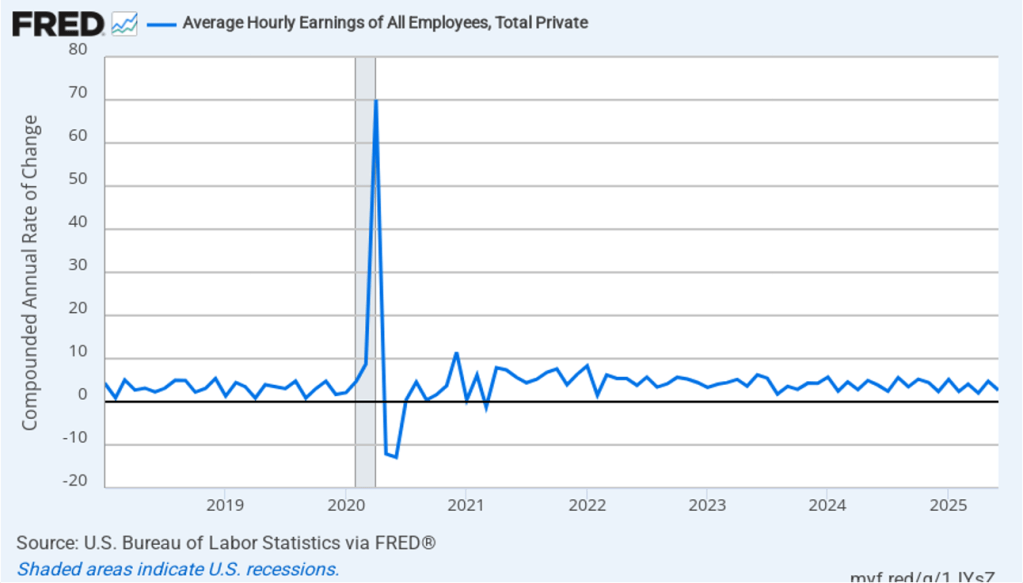
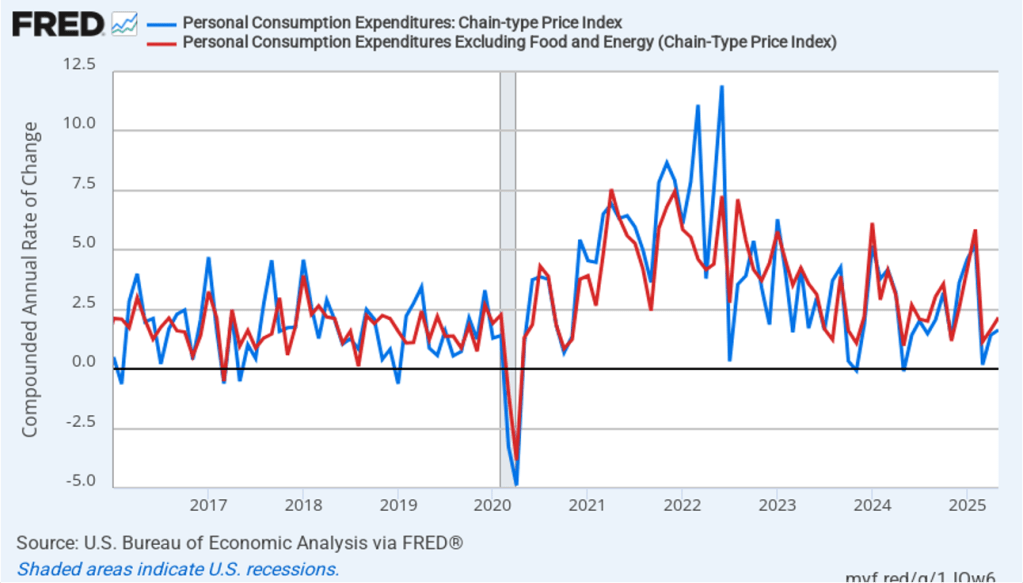
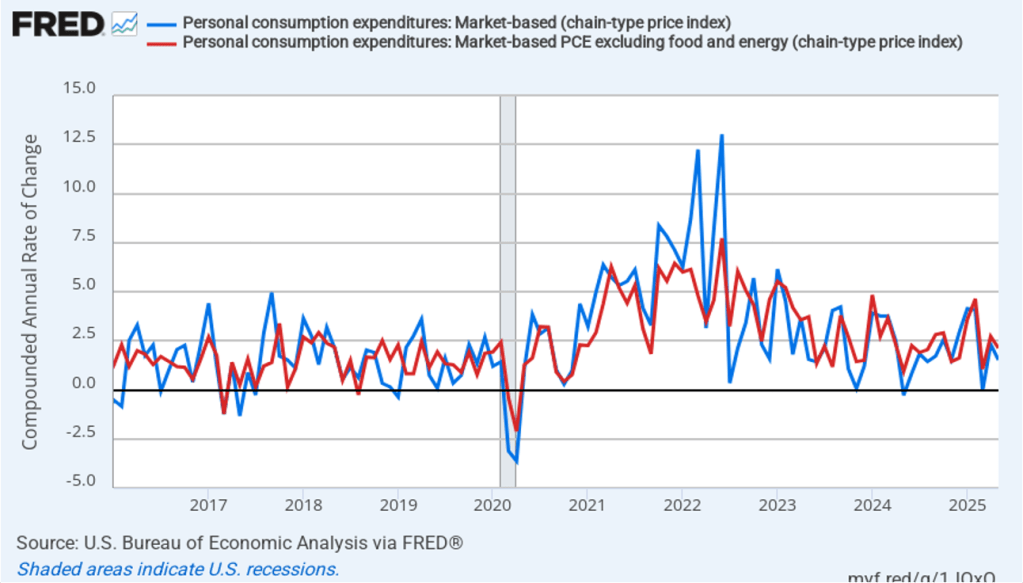
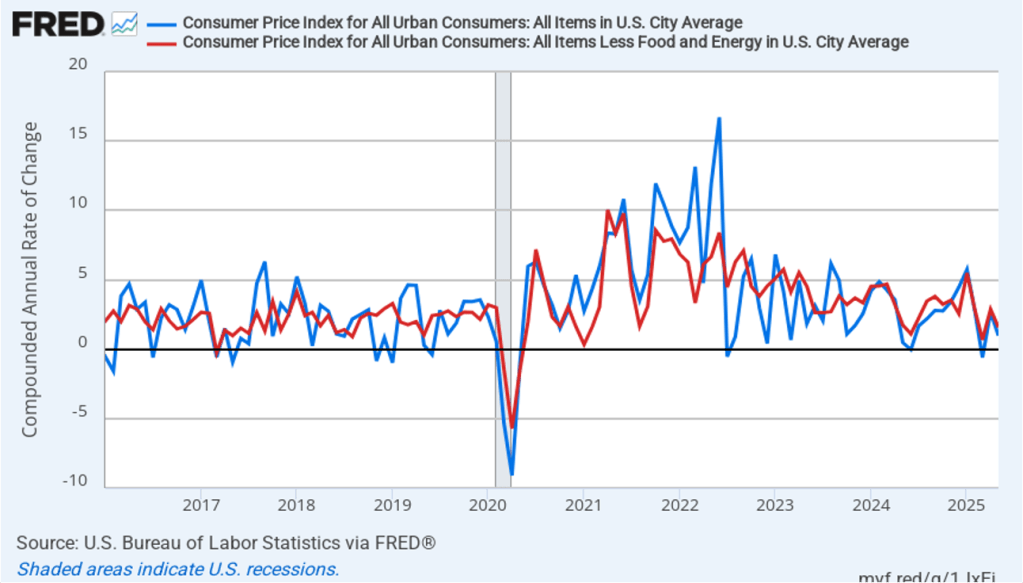
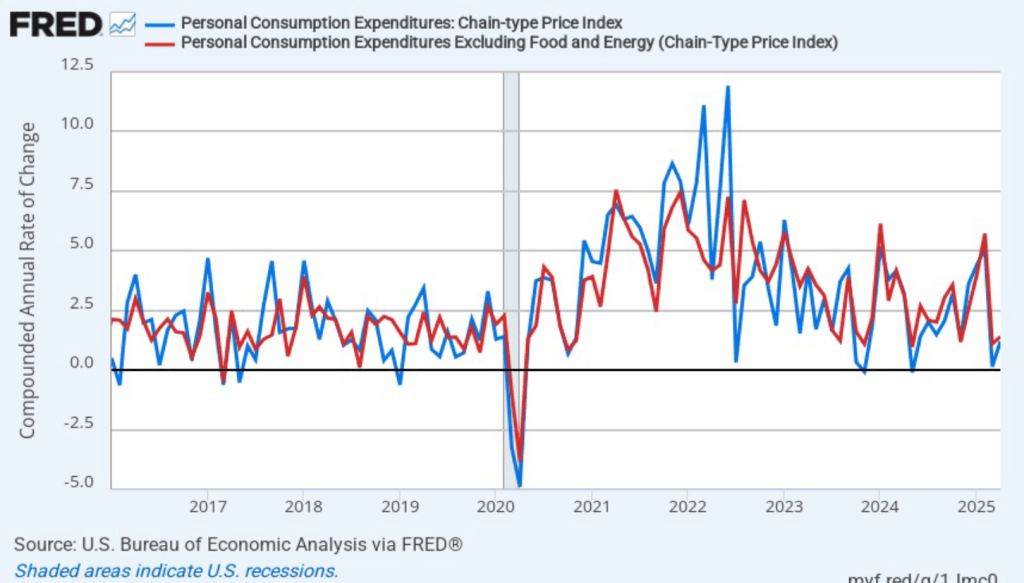
The following figure shows quarterly PCE inflation and quarterly core PCE inflation calculated by compounding the current quarter’s rate over an entire year. Measured this way, headline PCE inflation decreased from 3.7 percent in the first quarter of 2025 to 2.1 percent in the second quarter. Core PCE inflation decreased from 3.5 percent in the first quarter of 2025 to 2.5 percent in the secondt quarter. Measured this way, headline PCE inflation in the second quarter was close to the Fed’s target, while core PCE was well above the target. As we discuss in this blog post, tariff increases result in an aggregate supply shock to the economy. As a result, we may see a significant increase in inflation in the coming months as the higher tariff rates that have been negotiated recently begin to be implemented.