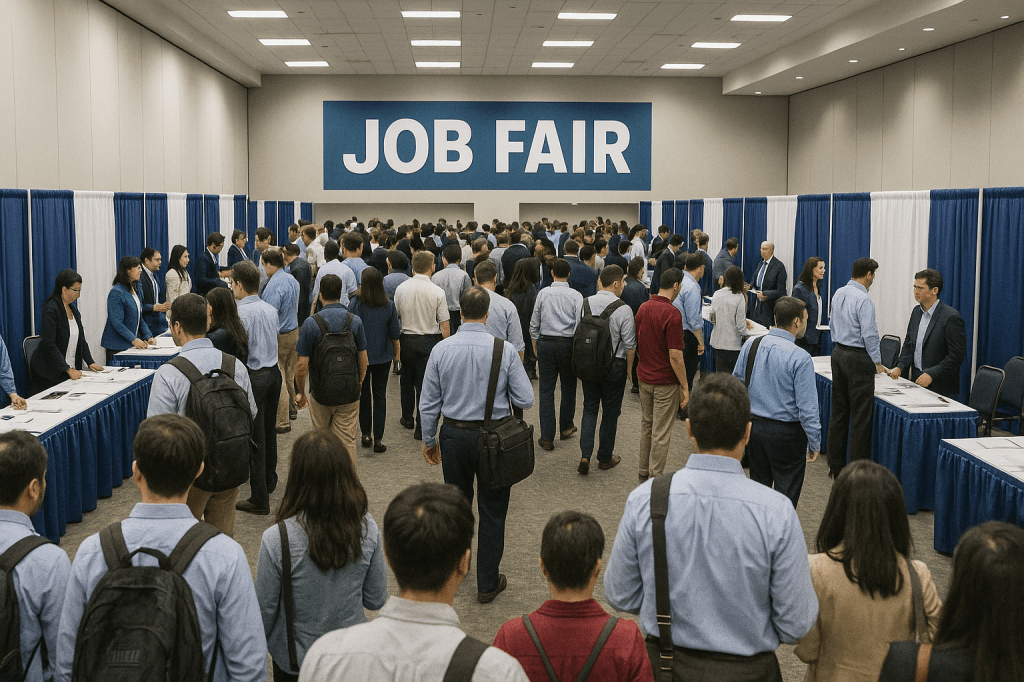
Image created by ChatGPT
If not for the shutdown of the federal government, the Bureau of Labor Statistics (BLS) would have already released its “Employment Situation” report (often called the “jobs report”) for September and October by now. The September jobs report was released today based largely on data collected before the shutdown.
The jobs report has two estimates of the change in employment during the month: one estimate from the establishment survey, often referred to as the payroll survey, and one from the household survey. As we discuss in Macroeconomics, Chapter 9, Section 9.1 (Economics, Chapter 19, Section 19.1), many economists and Federal Reserve policymakers believe that employment data from the establishment survey provide a more accurate indicator of the state of the labor market than do the household survey’s employment data and unemployment data. (The groups included in the employment estimates from the two surveys are somewhat different, as we discuss in this post.)
Because the household survey wasn’t conducted in October, the data in the October report that relies on the household survey won’t be included when the BLS releases establishment employment data for October on December 16. The data for September released today showed the labor market was stronger than expected in that month.
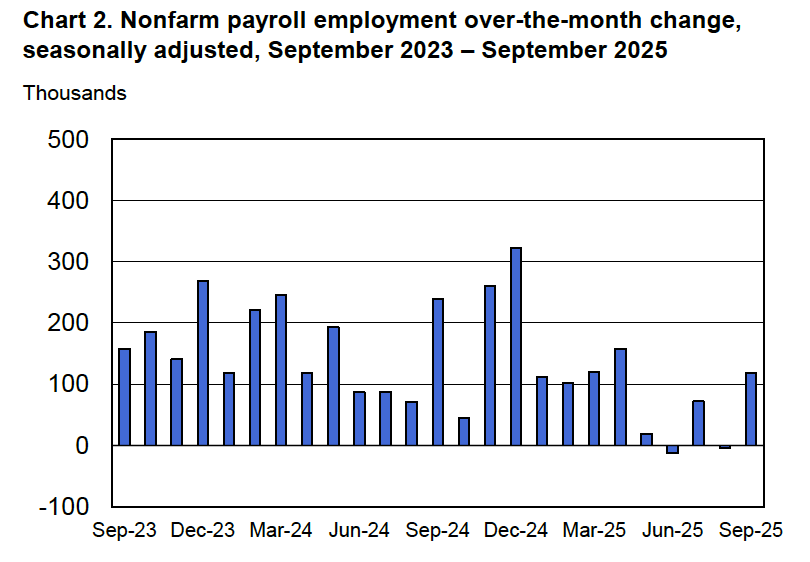
According to the establishment survey, there was a net increase of 119,00 nonfarm jobs during September. This increase was well above the increase of 50,000 that economists surveyed by FactSet had forecast. Economists surveyed by the Wall Street Journal had also forecast a net increase of 50,000 jobs. The relatively large increase in employment in September was partially offset by the BLS revising downward by a combined 33,000 jobs its previous estimates of employment in July and August. The estimate for August was revised from a net gain of 22,000 to a net loss of 4,000. (The BLS notes that: “Monthly revisions result from additional reports received from businesses and government agencies since the last published estimates and from the recalculation of seasonal factors.”)
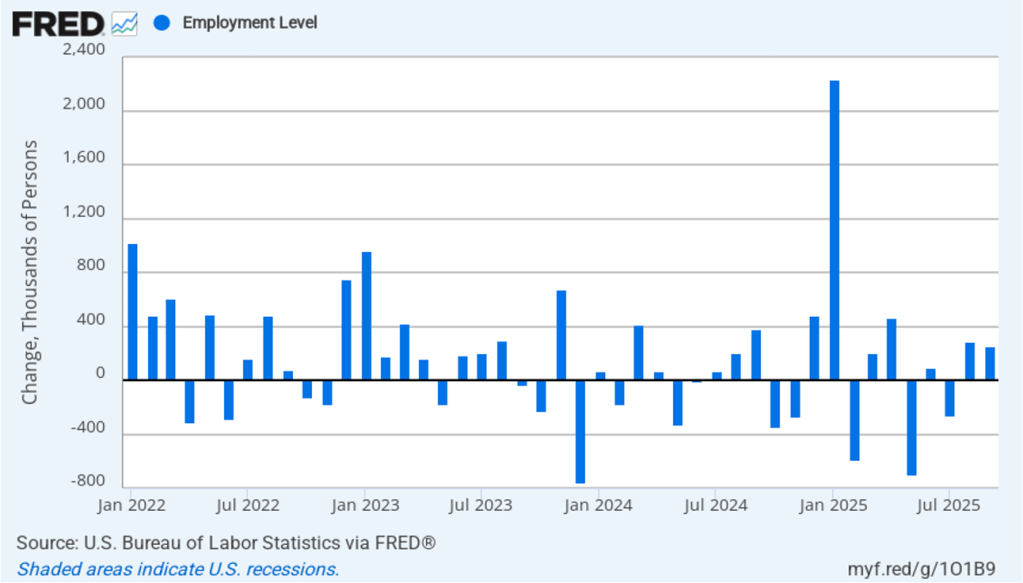
The following figure from the jobs report shows the net change in nonfarm payroll employment for each month in the last two years. The figure makes clear the striking deceleration in job growth beginning in May. The Trump administration announced sharp increases in U.S. tariffs on April 2. Media reports indicate that some firms have slowed hiring due to the effects of the tariffs or in anticipation of those effects.
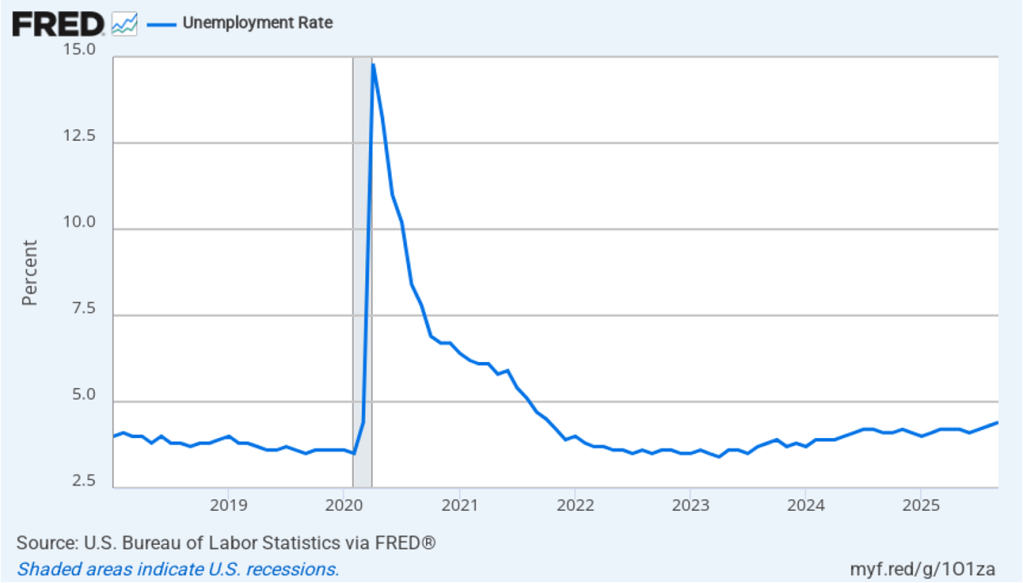
As shown in the following figure, the unemployment rate increased from 4.3 percent in August to 4.4 percent in September, the highest rate since October 2021. The unemployment rate is above the 4.3 percent rate economists surveyed by FactSet had forecast. The unemployment rate had been remarkably stable, staying between 4.0 percent and 4.2 percent in each month from May 2024 to July 2025, before breaking out of that range in August. In September, the members of the Federal Open Market Committee (FOMC) forecast that the unemployment rate during the fourth quarter of 2025 would average 4.5 percent. The FOMC’s current estimate of the natural rate of unemployment—the normal rate of unemployment over the long run—is 4.2 percent. (We discuss the natural rate of unemployment in Macroeconomics, Chapter 9 and Economics, Chapter 19.)
Each month, the Federal Reserve Bank of Atlanta estimates how many net new jobs are required to keep the unemployment rate stable. Given slower growth in the working-age population due to the aging of the U.S. population and a sharp decline in immigration, the Atlanta Fed currently estimates that the economy would have to create 111,878 net new jobs each month to keep the unemployment rate stable at 4.4 percent. If this estimate is accurate, if the average monthly net job increase from May through September of 38,600 were to continue, the result would be a rising unemployment rate.
As the following figure shows, the monthly net change in jobs from the household survey moves much more erratically than does the net change in jobs from the establishment survey. As measured by the household survey, there was a net increase of 251,000 jobs in September, following a net increase of 288,000 jobs in August. As an indication of the volatility in the employment changes in the household survey note the very large swings in net new jobs in January and February. In any particular month, the story told by the two surveys can be inconsistent. as was the case in September with employment increasing much more in the household survey than in the employment survey. (In this blog post, we discuss the differences between the employment estimates in the two surveys.)
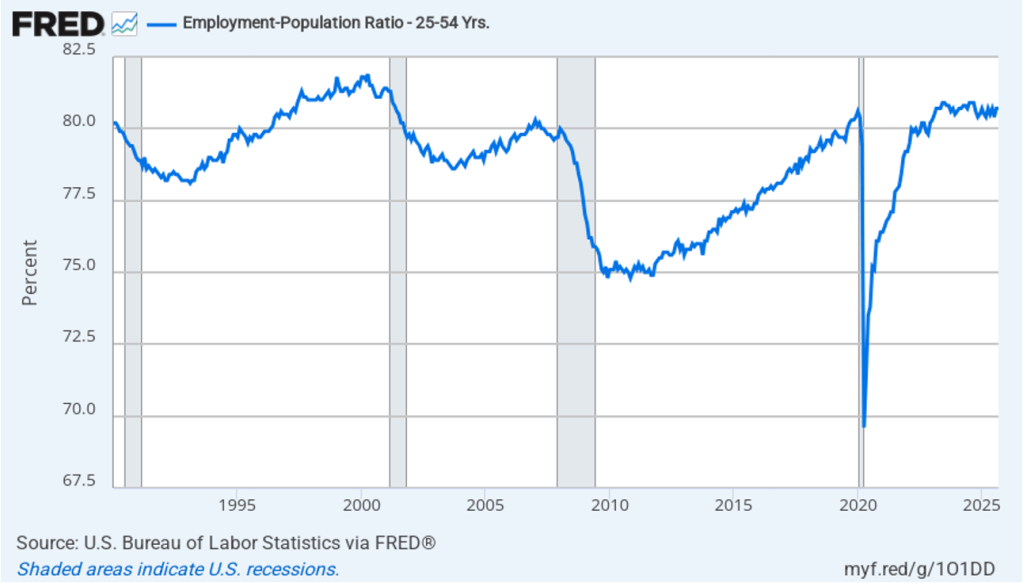
The household survey has another important labor market indicator: the employment-population ratio for prime age workers—those aged 25 to 54. In September the ratio was 80.7 percent, the same as in August. The prime-age employment-population ratio is somewhat below the high of 80.9 percent in mid-2024, but is still above what the ratio was in any month during the period from January 2008 to February 2020. The continued high levels of the prime-age employment-population ratio indicates strength in the labor market.
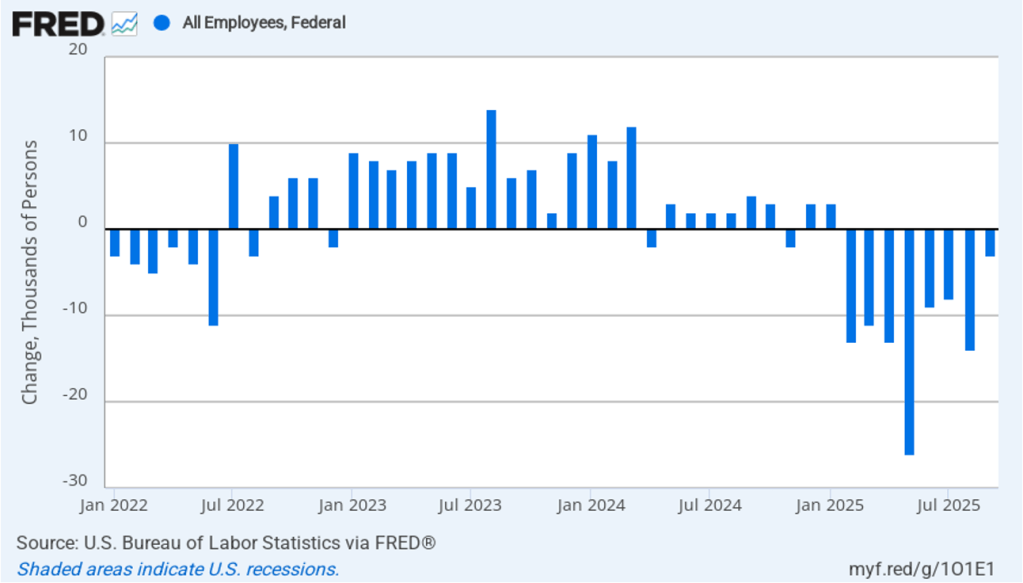
It is still unclear how many federal workers have been laid off since the Trump Administration took office. The establishment survey shows a decline in federal government employment of 3,000 in September and a total decline of 97,000 since the beginning of February 2025. However, the BLS notes that: “Employees on paid leave or receiving ongoing severance pay are counted as employed in the establishment survey.” It’s possible that as more federal employees end their period of receiving severance pay, future jobs reports may report a larger decline in federal employment. To this point, the decline in federal employment has had only a small effect on the overall labor market.
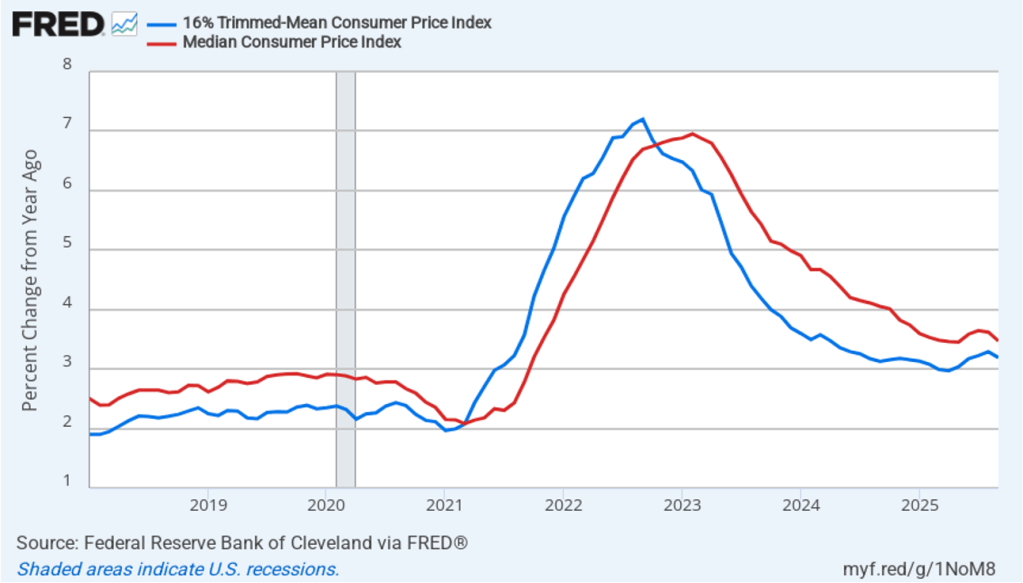
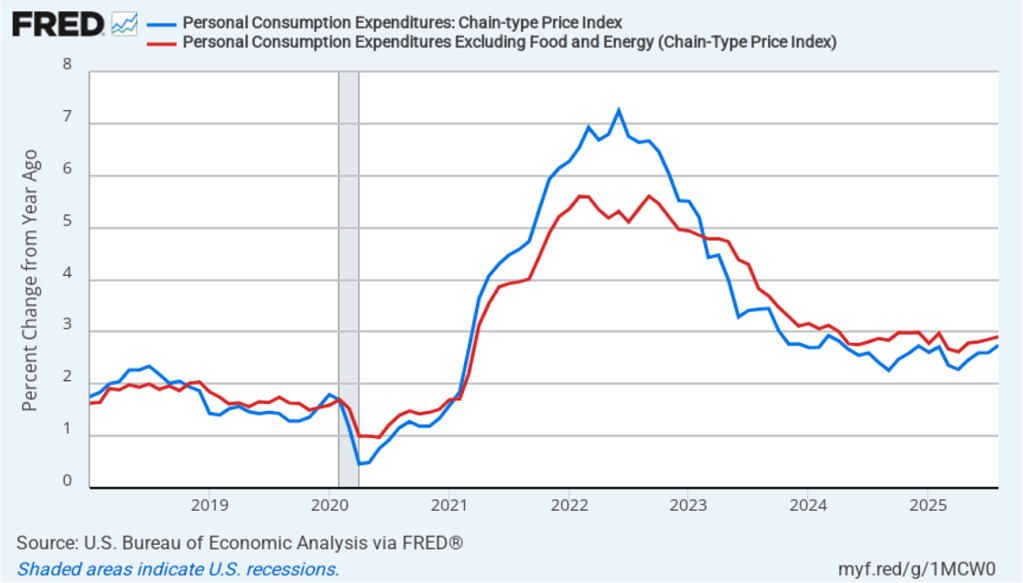
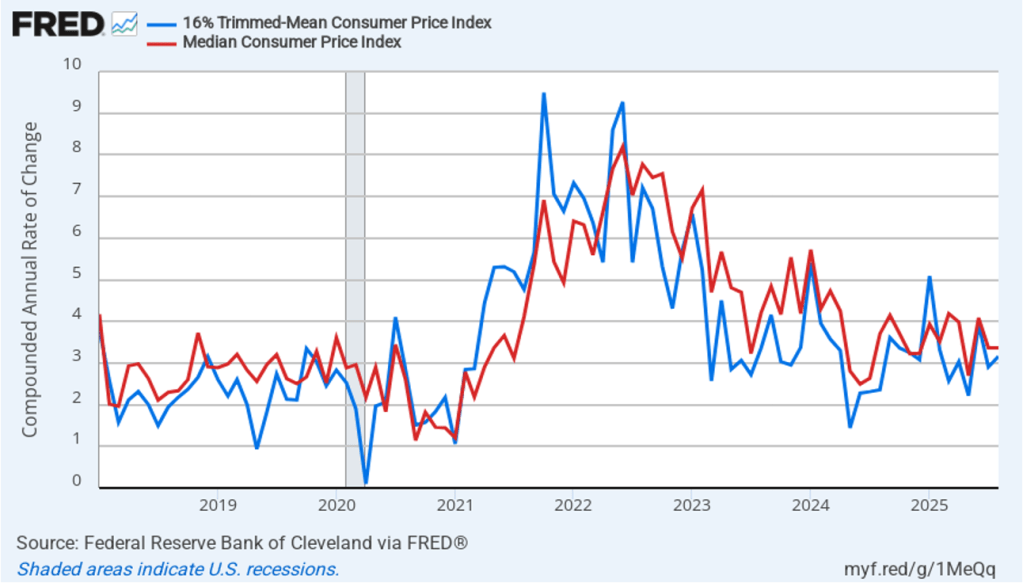
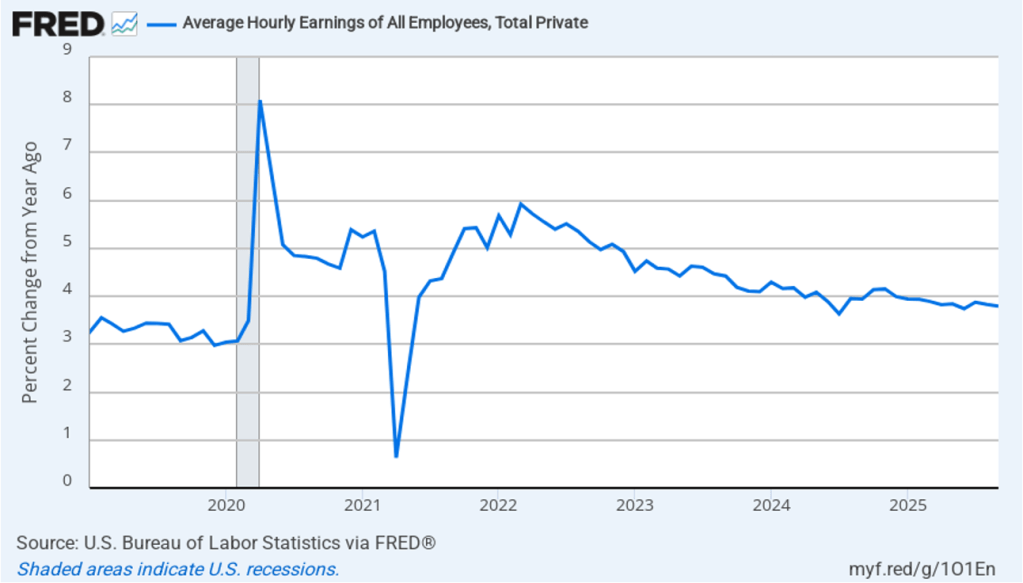
The establishment survey also includes data on average hourly earnings (AHE). As we noted in this post, many economists and policymakers believe the employment cost index (ECI) is a better measure of wage pressures in the economy than is the AHE. The AHE does have the important advantage of being available monthly, whereas the ECI is only available quarterly. The following figure shows the percentage change in the AHE from the same month in the previous year. The AHE increased 3.8 percent in September, the same as in August.
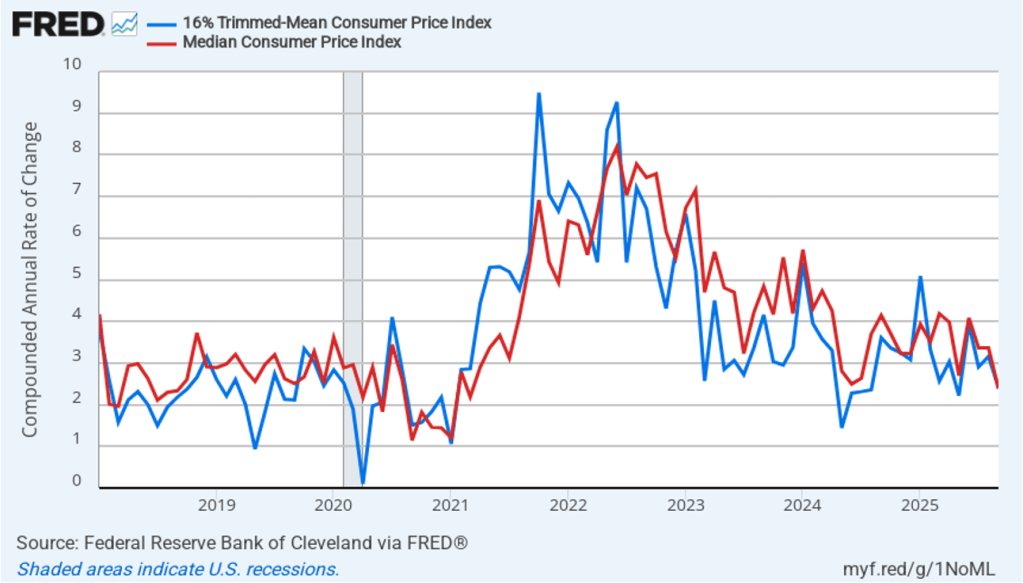
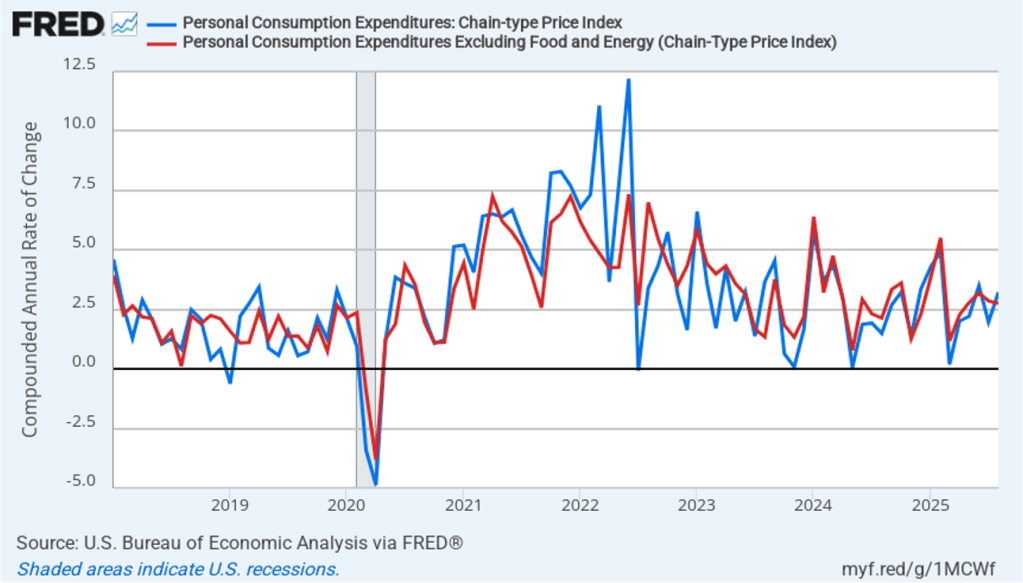
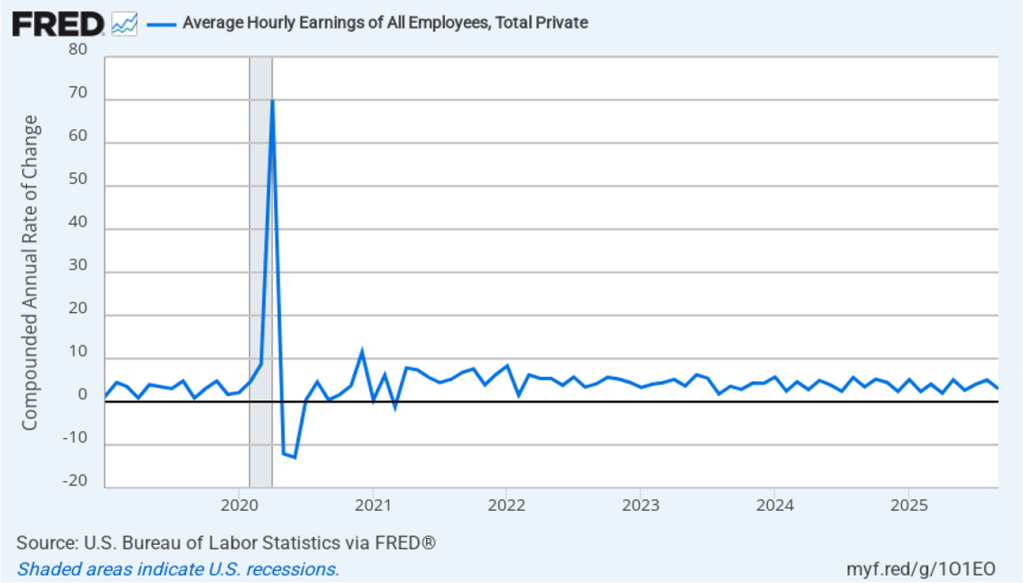
The following figure shows wage inflation calculated by compounding the current month’s rate over an entire year. (The figure above shows what is sometimes called 12-month wage inflation, whereas this figure shows 1-month wage inflation.) One-month wage inflation is much more volatile than 12-month wage inflation—note the very large swings in 1-month wage inflation in April and May 2020 during the business closures caused by the Covid pandemic. In September, the 1-month rate of wage inflation was 3.0 percent, down from 5.1 percent in August. This slowdown in wage growth may be an indication of a weakening labor market. But one month’s data from such a volatile series may not accurately reflect longer-run trends in wage inflation.
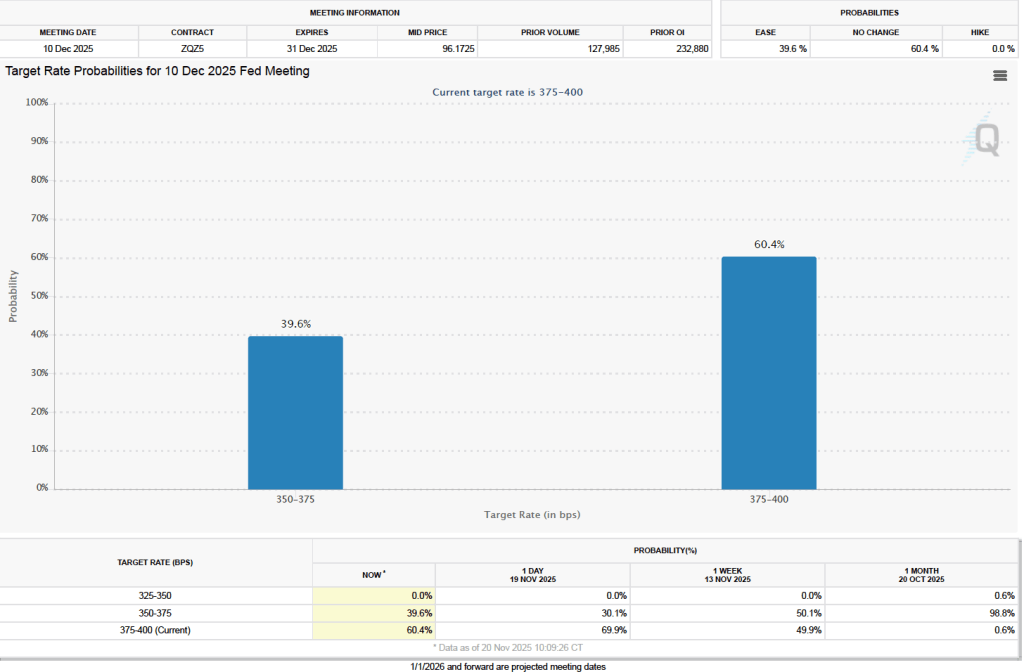
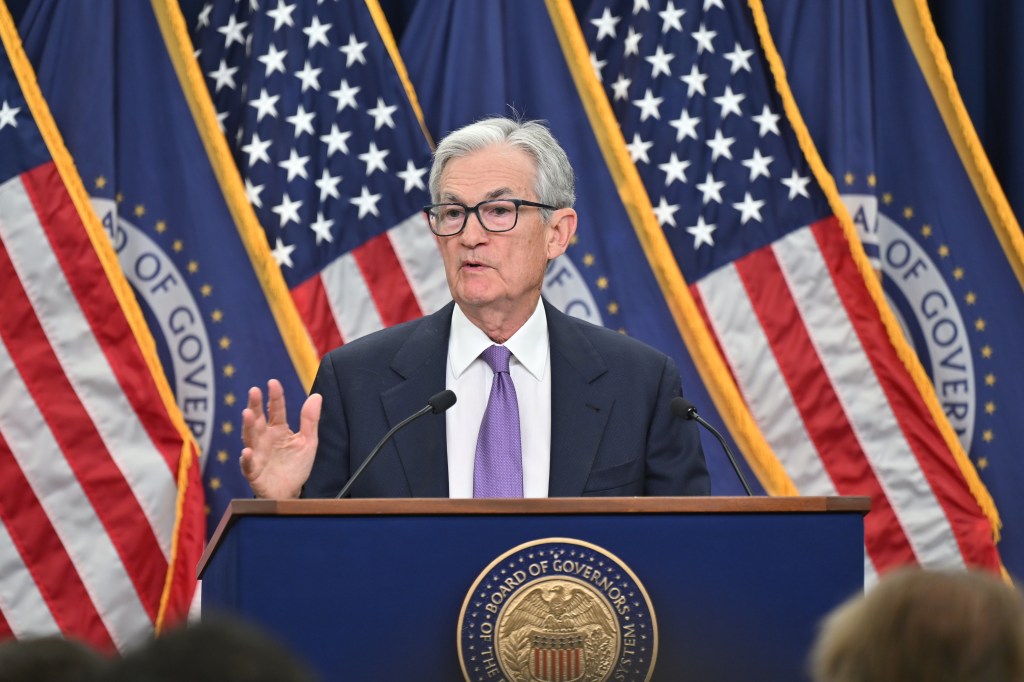
What effect might today’s jobs report have on the decisions of the Federal Reserve’s policymaking Federal Open Market Committee (FOMC) with respect to setting its target range for the federal funds rate? The minutes from the FOMC’s last meeting on October 28–29 indicate that committee members had “strongly differing views” over whether to cut the target range by 0.25 percentage point (25 basis points) at its next meeting on December 9–10 or to leave the target range unchanged.
One indication of expectations of future changes in the FOMC’s target for the federal funds rate comes from investors who buy and sell federal funds futures contracts. (We discuss the futures market for federal funds in this blog post.) A month ago, investors assigned a 98.8 percent probability of the committee cutting its target range to 3.50 percent to 3.75 percent at its December meeting. Since that time indications have increased that output and employment growth have continued to be relatively strong and that inflation is stuck above the Fed’s 2 percent annual target. This morning, as the following figure shows, investors assign a probability of 60. 4 percent to the committee keeping its target unchanged at 3.75 percent to 4.00 percent at the December meeting. Committee members will also release their Summary of Economic Projections (SEP) at that meeting. The SEP, along with Fed Chair Powell’s remarks at his press conference following the meeting, should provide additional information on the monetary policy path the committee intends to follow in the coming months.