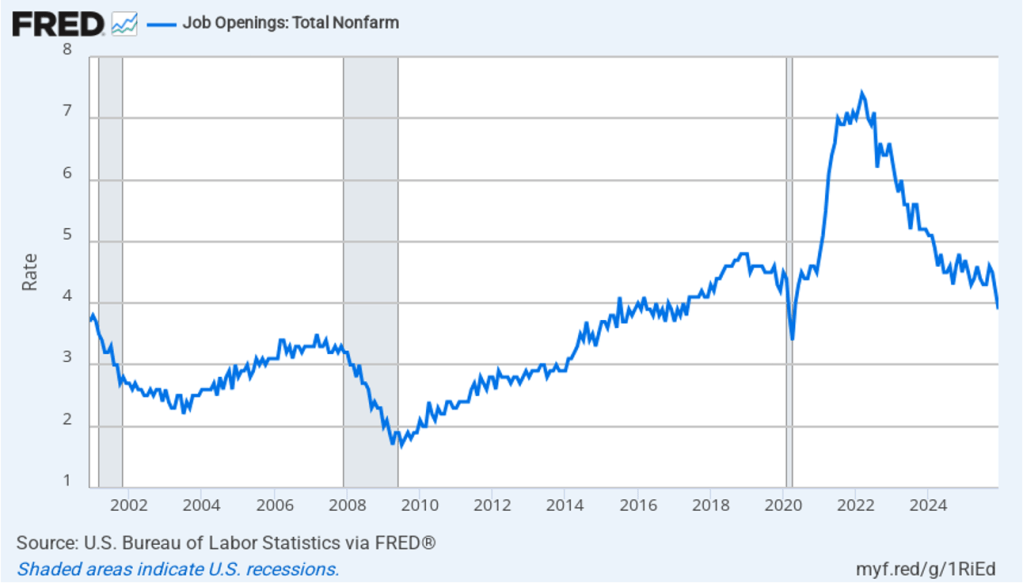
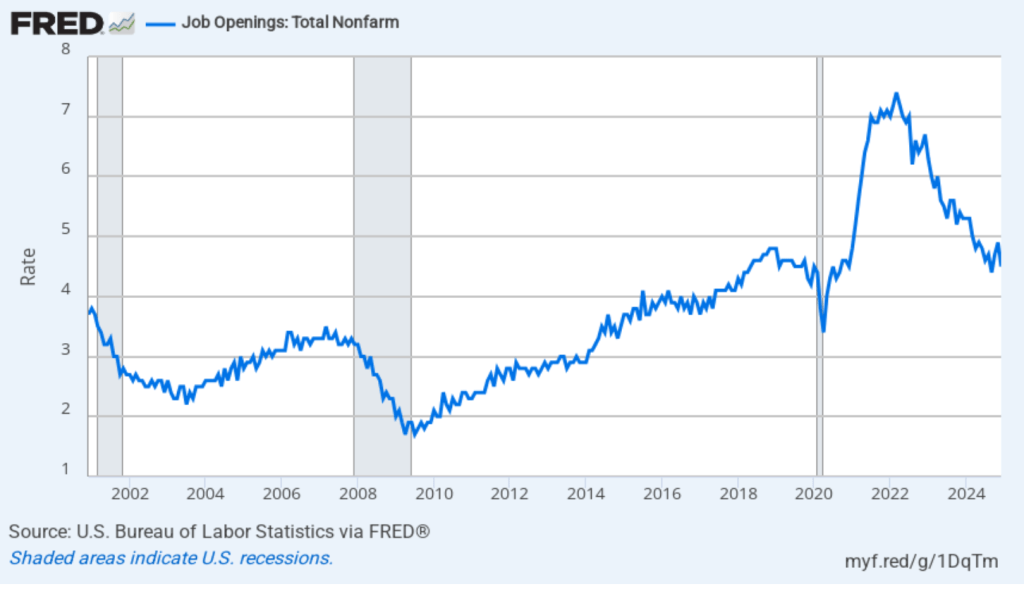
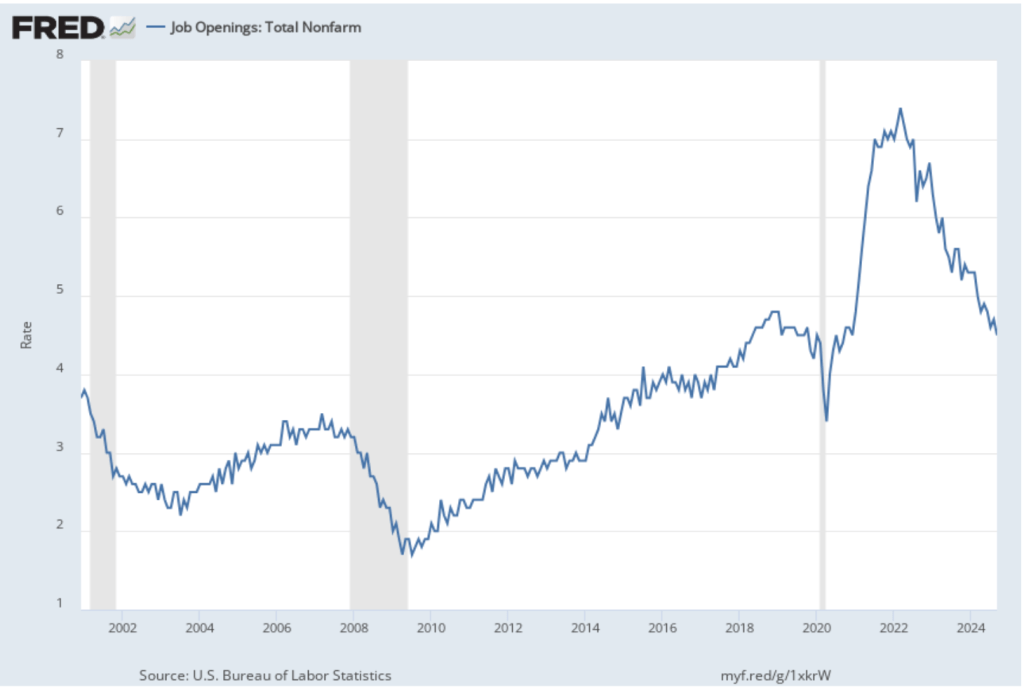
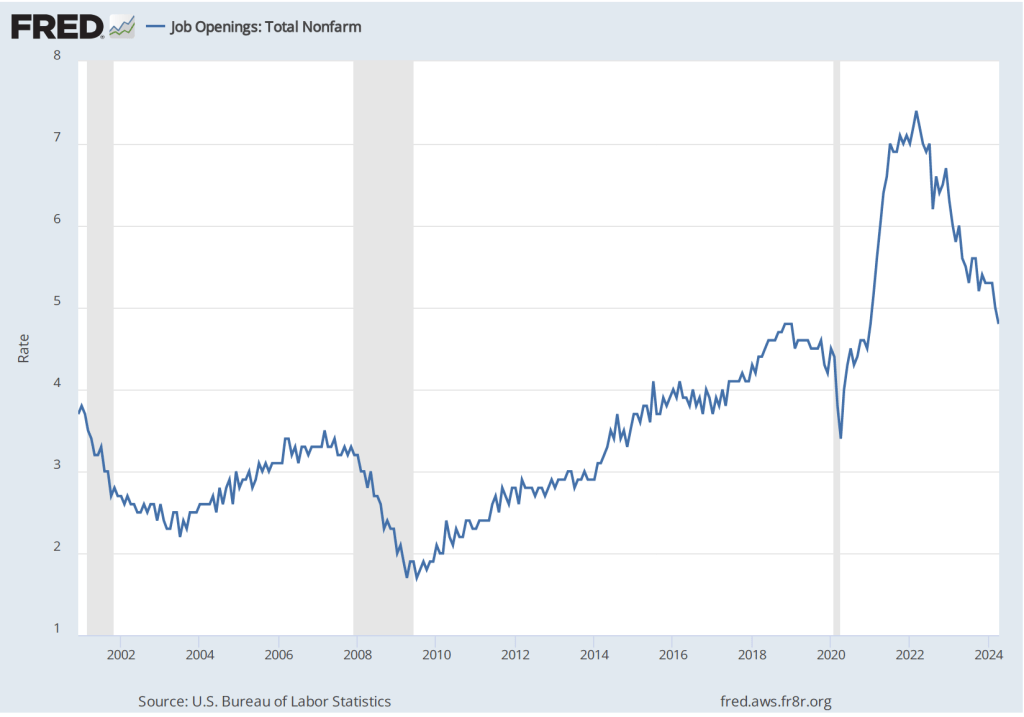
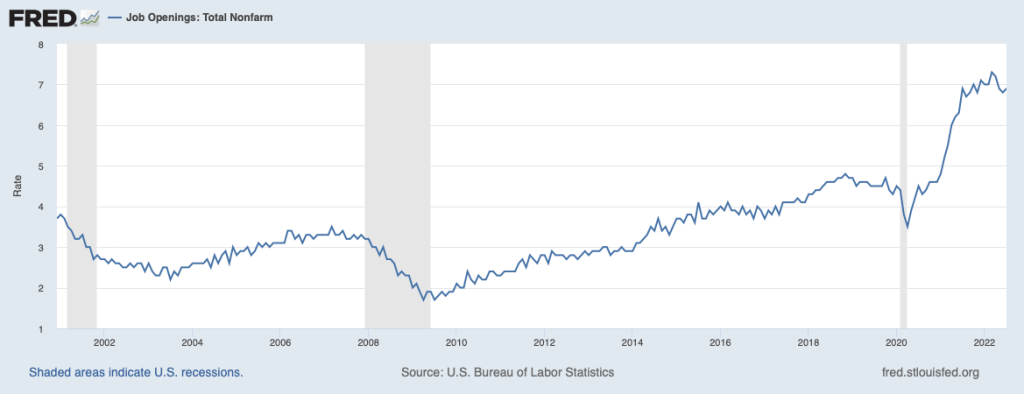
Today (February 5), the Bureau of Labor Statistics (BLS) released its “Job Openings and Labor Turnover” (JOLTS) report for December 2025. The report indicated that labor market conditions may be weakening. The following figure shows that the rate of job openings fell to 3.9 percent in December from 4.2 percent in November. The rate was 4.5 percent in October. The job openings rate is the lowest since April 2020, at the start of the Covid pandemic. We should note the usual caveat that the monthly JOLTS data is subject to potentially large revisions as the BLS receives more complete data.
(The BLS defines a job opening as a full-time or part-time job that a firm is advertising and that will start within 30 days. The rate of job openings is the number of job openings divided by the number of job openings plus the number employed workers, multiplied by 100.)
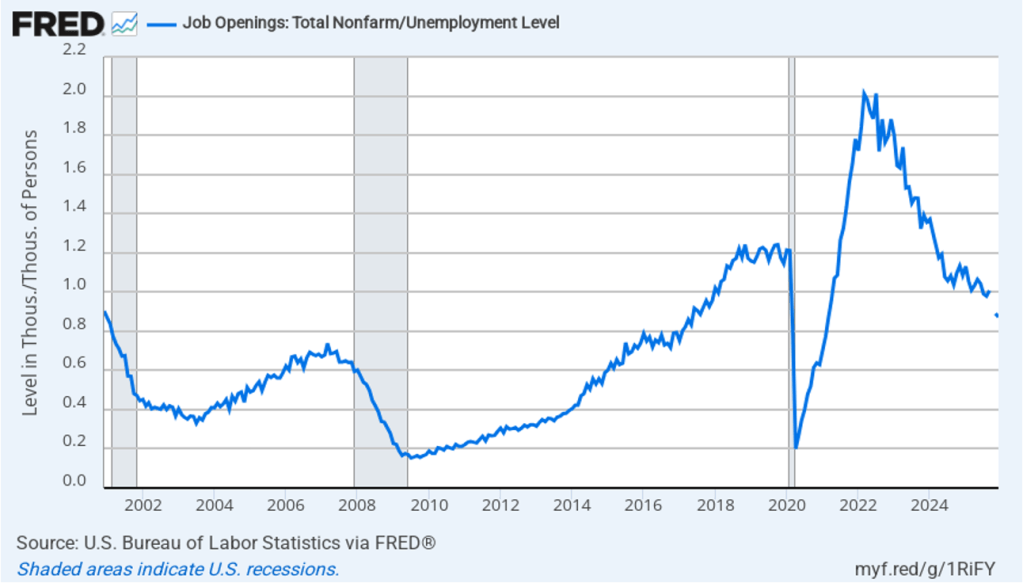
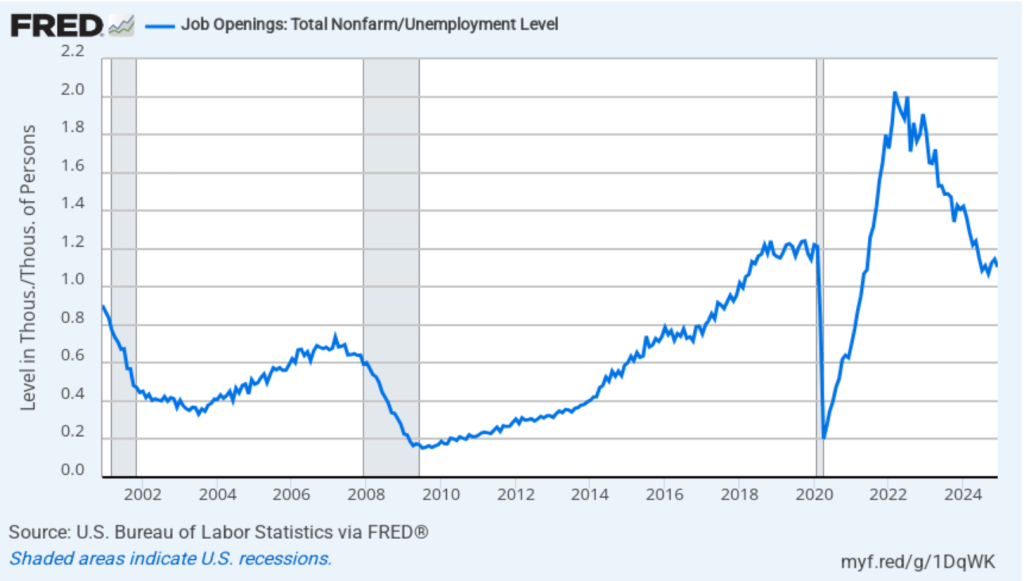
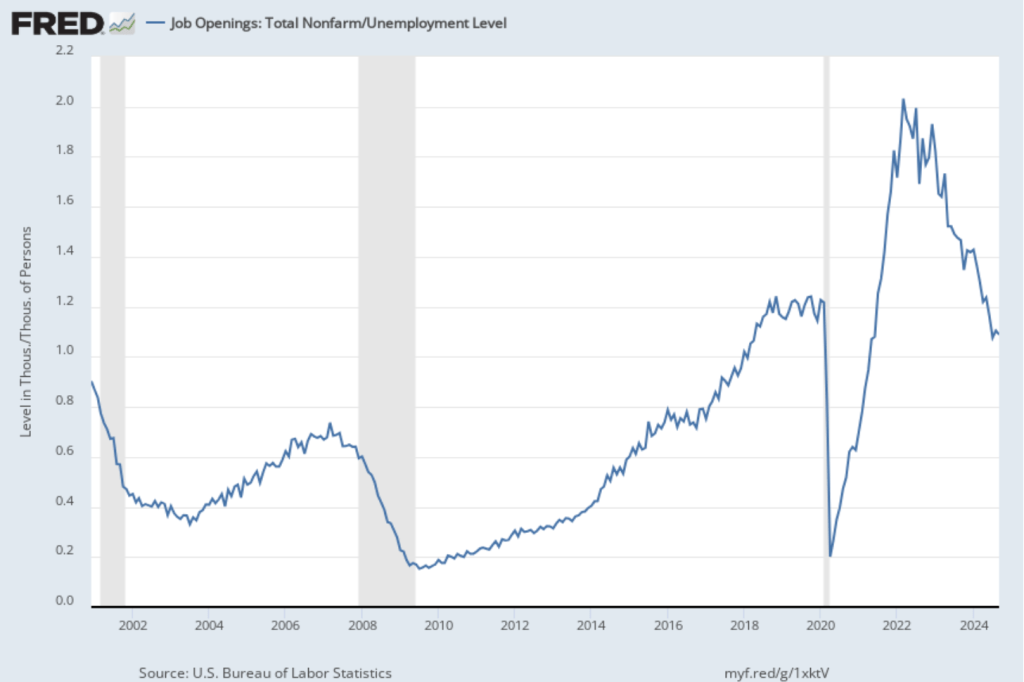
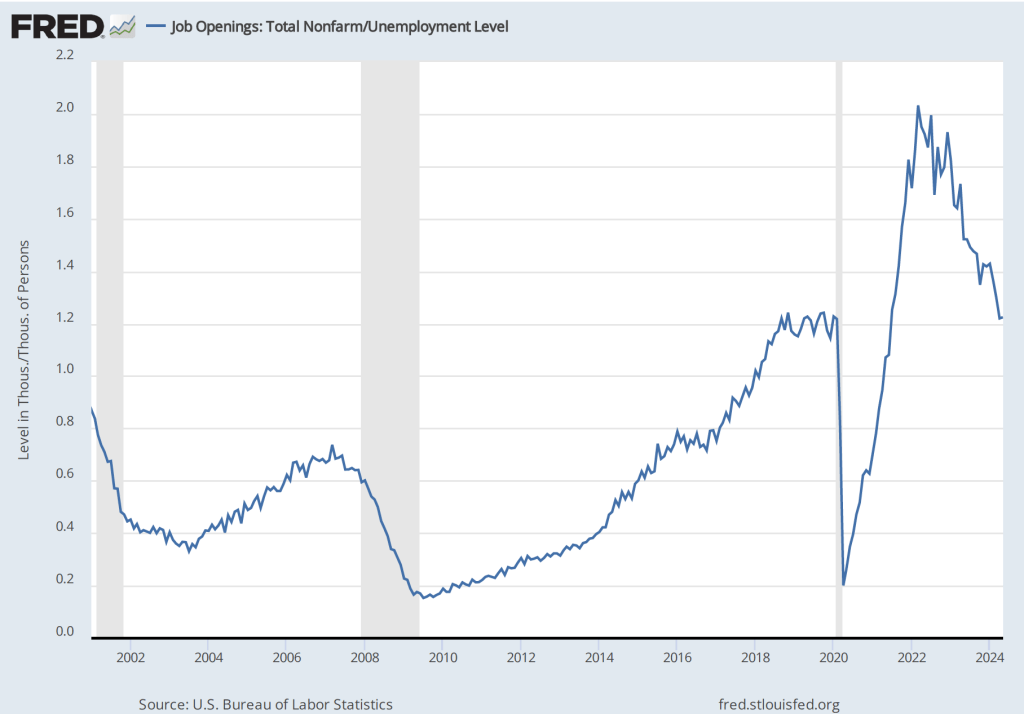
In the following figure, we show a measure of the state of the labor market that economists frequently use: the total number of job openings to the total number of people unemployed. In December there were 0.87 job openings per unemployed person, the lowest value for that measure since March 2021, during the recovery from the pandemic. The value was 1.0 in September. (Note that data for October and November are unavailable because the data weren’t collected during the shutdown of the federal government from October 1 to November 12 last year.) The value for December is well below the 1.21 job openings per employed person in February 2020, just before the pandemic. (Note that, as we discussed in this blog post, the employment-population ratio for prime age workers, which many economists consider a key measure of the state of the labor market, rose in December, putting it above what the ratio was in any month during the period from January 2008 to February 2020.)
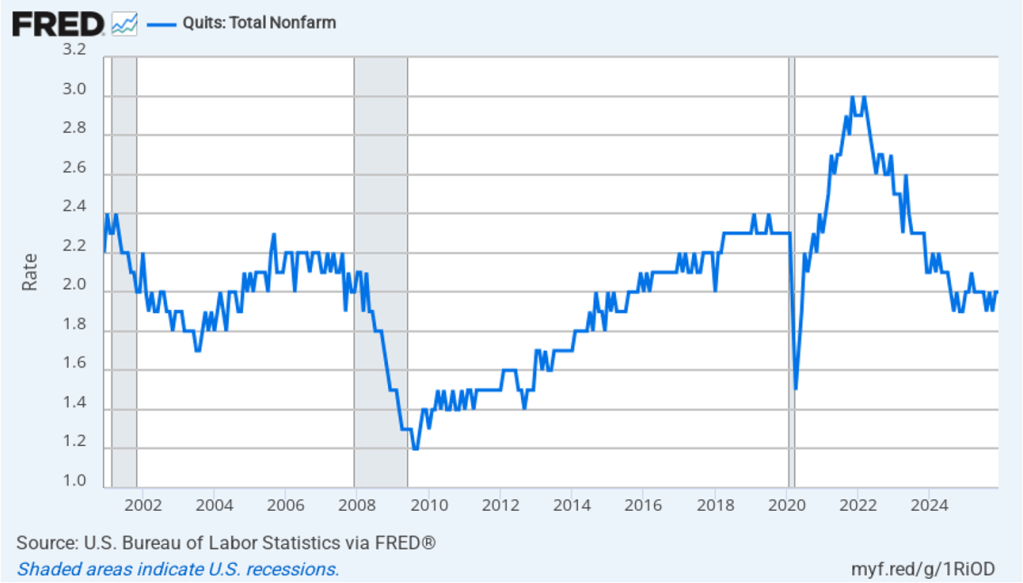
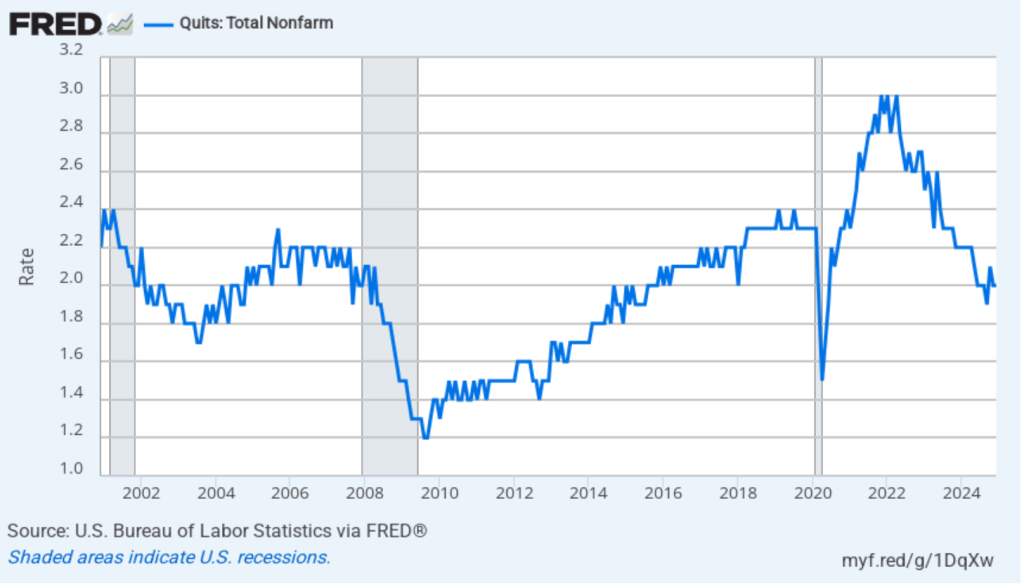
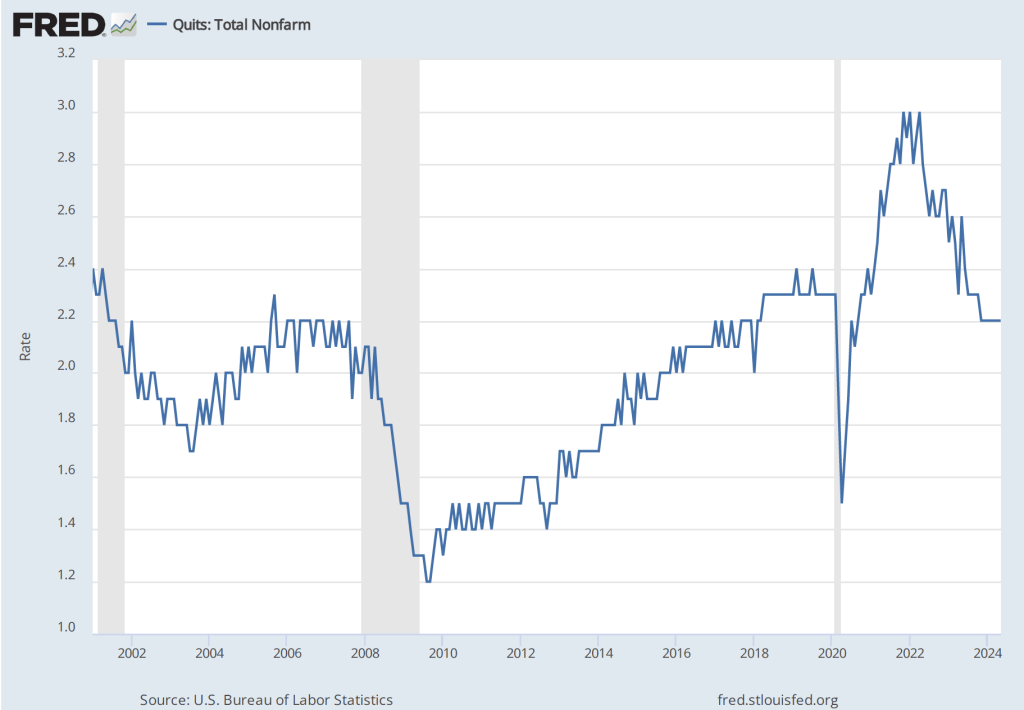
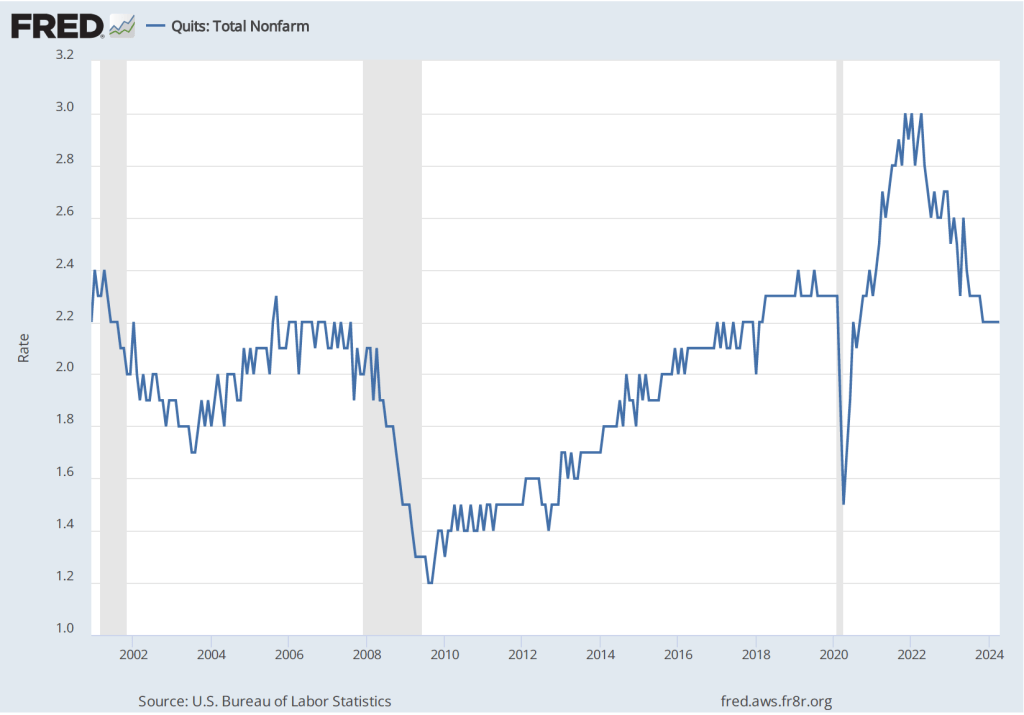
The rate at which workers are willing to quit their jobs is an indication of how they perceive the ease of finding a new job. As the following figure shows, the quit rate declined slowly from a peak of 3 percent in late 2021 and early 2022 to 2.0 percent in August 2024, the same value as in December 2025. That rate is below the rate during 2019 and early 2020. By this measure, workers’ perceptions of the state of the labor market have remained remarkably stable over the last year and a half.
Overall, this JOLTS report is consistent with what some economists have labeled a “slow hire, slow fire” labor market. Fed Chair Jerome Powell’s remarks at his press conference following the last meeting of the Federal Open Market Committee (FOMC) indicates that Fed policymakers share this view, which Powell believes complicates monetary policymaking:
“So there are lots of … little places that suggest that the labor market has softened, but part of … payroll job softening is that both the supply and demand for labor has come down … growth in those two have come down. So that makes it a difficult time to read the labor market. So, imagine they both came down a lot, to the point where there is no job growth. Is that full employment? In a sense it is. If demand and supply are … in balance, you could say that’s full employment. At the same time, is it—do we really feel like … that’s a maximum employment economy? It’s a challenging—it’s very challenging and quite unusual situation.”
The BLS was scheduled to release its monthly “Employment Situation” report (often called the “jobs report”) for January 2026 tomorrow. Because of the temporary lapse in funding that began Saturday, the report will instead be released next Wednesday, February 11. That report will provide additional data on the state of the labor market. (Note that the data in the JOLTS report lag the data in the “Employment Situation” report by one month.)
Image generated by ChatGPT 5 of a 1981 IBM personal computer.
The modern era of information technology began in the 1980s with the spread of personal computers. A key development was the introduction of the IBM personal computer in 1981. The Apple II, designed by Steve Jobs and Steve Wozniak and introduced in 1977, was the first widely used personal computer, but the IBM personal computer had several advantages over the Apple II. For decades, IBM had been the dominant firm in information technology worldwide. The IBM System/360, introduced in 1964, was by far the most successful mainframe computer in the world. Many large U.S. firms depended on IBM to meet their needs for processing payroll, general accounting services, managing inventories, and billing.
Because these firms were often reliant on IBM for installing, maintaining, and servicing their computers, they were reluctant to shift to performing key tasks with personal computers like the Apple II. This reluctance was reinforced by the fact that few managers were familiar with Apple or other early personal computer firms like Commodore or Tandy, which sold the TRS-80 through Radio Shack stores. In addition, many firms lacked the technical staffs to install, maintain, and repair personal computers. Initially, it was easier for firms to rely on IBM to perform these tasks, just as they had long been performing the same tasks for firms’ mainframe computers.
By 1983, the IBM PC had overtaken the Apple II as the best-selling personal computer in the United States. In addition, IBM had decided to rely on other firms to supply its computer chips (Intel) and operating system (Microsoft) rather than develop its own proprietary computer chips and operating system. This so-called open architecture made it possible for other firms, such as Dell and Gateway, to produce personal computers that were similar to IBM’s. The result was to give an incentive for firms to produce software that would run on both the IBM PC and the “clones” produced by other firms, rather than produce software for Apple personal computers. Key software such as the spreadsheet program Lotus 1-2-3 and word processing programs, such as WordPerfect, cemented the dominance of the IBM PC and the IBM clones over Apple, which was largely shut out of the market for business computers.
As personal computers began to be widely used in business, there was a general expectation among economists and policymakers that business productivity would increase. Productivity, measured as output per hour of work, had grown at a fairly rapid average annual rate of 2.8 percent between 1948 and 1972. As we discuss in Macroeconomics, Chapter 10 (Economics, Chapter 20 and Essentials of Economics, Chapter 14) rising productivity is the key to an economy achieving a rising standard of living. Unless output per hour worked increases over time, consumption per person will stagnate. An annual growth rate of 2.8 percent will lead to noticeable increases in the standard of living.
Economists and policymakers were concerned when productivity growth slowed beginning in 1973. From 1973 to 198o, productivity grew at an annual rate of only 1.3 percent—less than half the growth rate from 1948 to 1972. Despite the widespread adoption of personal computers by businesses, during the 1980s, the growth rate of productivity increased only to 1.5 percent. In 1987, Nobel laureate Robert Solow of MIT famously remarked: “You can see the computer age everywhere but in the productivity statistics.” Economists labeled Solow’s observation the “productivity paradox.” With hindsight, it’s now clear that it takes time for businesses to adapt to a new technology, such as personal computers. In addition, the development of the internet, increases in the computing power of personal computers, and the introduction of innovative software were necessary before a significant increase in productivity growth rates occurred in the mid-1990s.
Result when ChatGPT 5 is asked to create an image illustrating ChatGPT
The release of ChatGPT in November 2022 is likely to be seen in the future as at least as important an event in the evolution of information technology as the introduction of the IBM PC in August 1981. Just as with personal computers, many people have been predicting that generative AI programs will have a substantial effect on the labor market and on productivity.
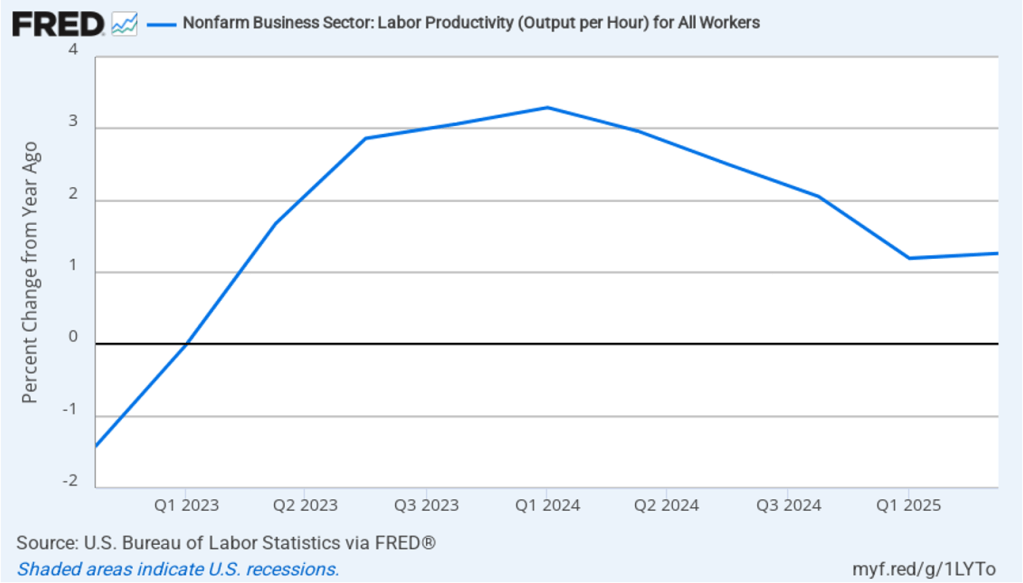
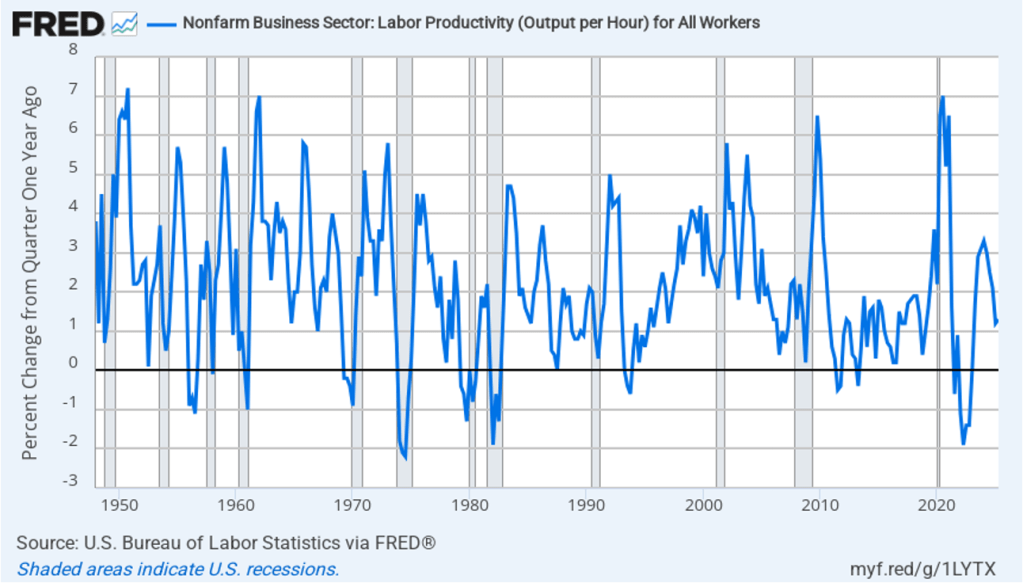
In this recent blog post, we discussed the conflicting evidence as to whether generative AI has been eliminating jobs in some occupations, such as software coding. Has AI had an effect on productivity growth? The following figure shows the rate of productivity growth in each quarter since the fourth quarter of 2022. The figure shows an acceleration in productivity growth beginning in the fourth quarter of 2023. From the fourth quarter of 2023 through the fourth quarter of 2024, productivity grew at an annual rate of 3.1 percent—higher than during the period from 1948 to 1972. Some commentators attributed this surge in productivity to the effects of AI.
However, the increase in productivity growth wasn’t sustained, with the growth rate in the first half of 2025 being only 1.3 percent. That slowdown makes it more likely that the surge in productivity growth was attributable to the recovery from the 2020 Covid recession or was simply an example of the wide fluctuations that can occur in productivity growth. The following figure, showing the entire period since 1948, illustrates how volatile quarterly rates of productivity growth are.
How large an effect will AI ultimately have on the labor market? If many current jobs are replaced by AI is it likely that the unemployment rate will soar? That’s a prediction that has often been made in the media. For instance, Dario Amodei, the CEO of generative AI firm Anthropic, predicted during an interview on CNN that AI will wipe out half of all entry level jobs in the U.S. and cause the unemployment rate to rise to between 10% and 20%.
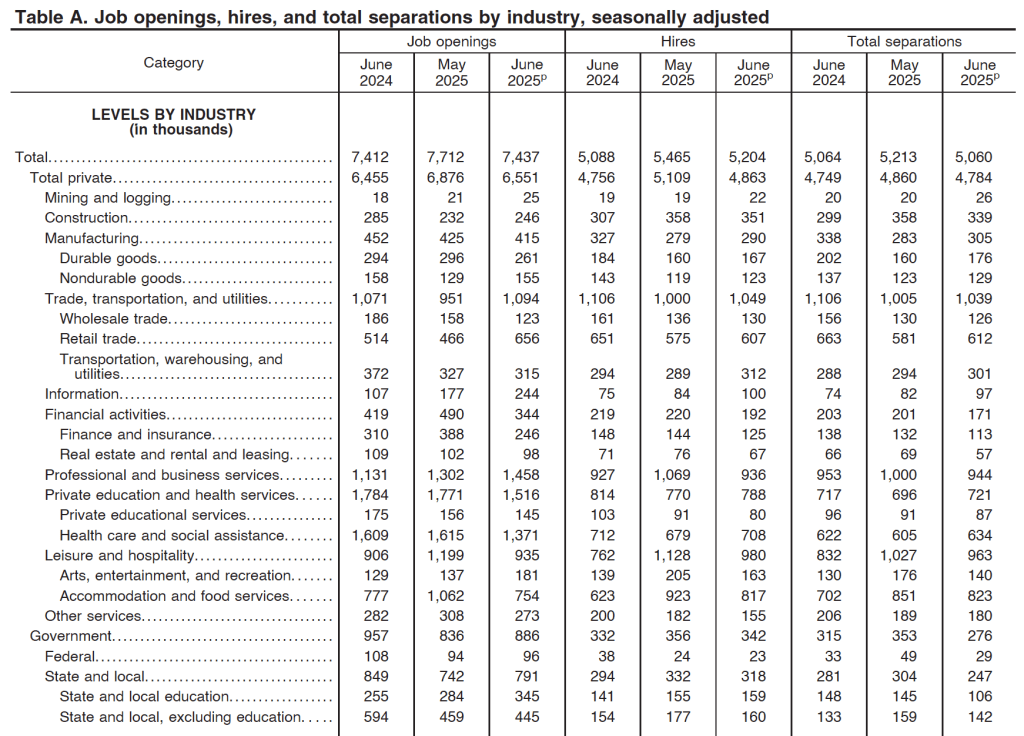
Although Amodei is likely correct that AI will wipe out many existing jobs, it’s unlikely that the result will be a large increase in the unemployment rate. As we discuss in Macroeconomics, Chapter 9 (Economics, Chapter 19 and Essentials of Economics, Chapter 13) the U.S. economy creates and destroys millions of jobs every year. Consider, for instance, the following table from the most recent “Job Openings and Labor Turnover” (JOLTS) report from the Bureau of Labor Statistics (BLS). In June 2025, 5.2 million people were hired and 5.1 million left (were “separated” from) their jobs as a result of quitting, being laid off, or being fired.
Most economists believe that one of the strengths of the U.S. economy is the flexibility of the U.S. labor market. With a few exceptions, “employment at will” holds in every state, which means that a business can lay off or fire a worker without having to provide a cause. Unionization rates are also lower in the United States than in many other countries. U.S. workers have less job security than in many other countries, but—crucially—U.S. firms are more willing to hire workers because they can more easily lay them off or fire them if they need to. (We discuss the greater flexibility of U.S. labor markets in Macroeconomics, Chapter 11 (Economics, Chapter 21).)
The flexibility of the U.S. labor market means that it has shrugged off many waves of technological change. AI will have a substantial effect on the economy and on the mix of jobs available. But will the effect be greater than that of electrification in the late nineteenth century or the effect of the automobile in the early twentieth century or the effect of the internet and personal computing in the 1980s and 1990s? The introduction of automobiles wiped out jobs in the horse-drawn vehicle industry, just as the internet has wiped out jobs in brick-and-mortar retailing. People unemployed by technology find other jobs; sometimes the jobs are better than the ones they had and sometimes the jobs are worse. But economic historians have shown that technological change has never caused a spike in the U.S. unemployment rate. It seems likely—but not certain!—that the same will be true of the effects of the AI revolution.
Which jobs will AI destroy and which new jobs will it create? Except in a rough sense, the truth is that it is very difficult to tell. Attempts to forecast technological change have a dismal history. To take one of many examples, in 1998, Paul Krugman, later to win the Nobel Prize, cast doubt on the importance of the internet: “By 2005 or so, it will become clear that the Internet’s impact on the economy has been no greater than the fax machine’s.” Krugman, Amodei and other prognosticators of the effects of technological change simply lack the knowledge to make an informed prediction because the required knowledge is spread across millions of people.
That knowledge only becomes available over time. The actions of consumers and firms interacting in markets mobilize information that is initially known only partially to any one person. In 1945, Friedrich Hayek made this argument in “The Use of Knowledge in Society,” which is one of the most influential economics articles ever written. One of Hayek’s examples is an unexpected decrease in the supply of tin. How will this development affect the economy? We find out only by observing how people adapt to a rising price of tin: “The marvel is that … without an order being issued, without more than perhaps a handful of people knowing the cause, tens of thousands of people whose identity could not be ascertained by months of investigation are made [by the increase in the price of tin] to use the material or its products more sparingly.” People adjust to changing conditions in ways that we lack sufficient information to reliably forecast. (We discuss Hayek’s view of how the market system mobilizes the knowledge of workers, consumers, and firms in Microeconomics, Chapter 2.)
It’s up to millions of engineers, workers, and managers across the economy, often through trial and error, to discover how AI can best reduce the cost of producing goods and services or improve their quality. Competition among firms drives them to make the best use of AI. In the end, AI may result in more people or fewer people being employed in any particular occupation. At this point, there is no way to know.
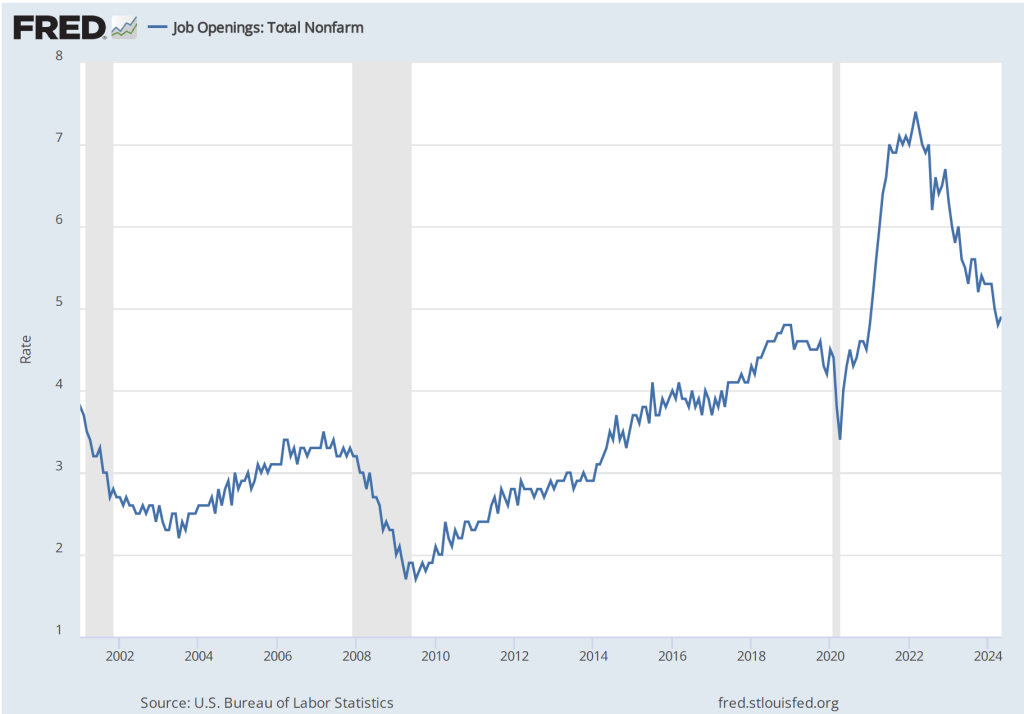
Earlier this week, the Bureau of Labor Statistics (BLS) released its “Job Openings and Labor Turnover” (JOLTS) report for December 2024. The report indicated that labor market conditions remain strong, with most indicators being in line with their values from 2019, immediately before the pandemic. The following figure shows that, at 4.5 percent, the rate of job openings remains in the same range as during the previous six months. While well down from the peak job opening rate of 7.4 percent in March 2022, the rate of job openings was the same as during the summer of 2019 and above the rates during most of the period following the Great Recession of 2007–2009.
(The BLS defines a job opening as a full-time or part-time job that a firm is advertising and that will start within 30 days. The rate of job openings is the number of job openings divided by the number of job openings plus the number employed workers, multiplied by 100.)
In the following figure, we compare the total number of job openings to the total number of people unemployed. The figure shows a slow decline from a peak of more than 2 job openings per unemployed person in the spring of 2022 to 1.1 job openings per unemployed person in December 2024—about the same as in 2019 and early 2020, before the pandemic. Note that the number is still above 1.0, indicating that the demand for labor is still high, although no higher than during the strong labor market of 2019.
The rate at which workers are willing to quit their jobs is an indication of how they perceive the ease of finding a new job. As the following figure shows, the quit rate declined slowly from a peak of 3 percent in late 2021 and early 2022 to 2.0 percent in July 2024, the same value as in December 2024. That rate is below the rate during 2019 and early 2020. By this measure, workers’ perceptions of the state of the labor market may have deteriorated slightly in recent months.
The JOLTS data indicate that the labor market is about as strong as it was in the months prior to the start of the pandemic, but it’s not as historically tight as it was through most of 2022 and 2023. In recent months, workers may have become less optimistic about finding a new job if they quit their current job. The “Great Quitting,” which was widely discussed in the business press during the period of high quit rates in 2022 and 2023 would seem to be over.
On Friday morning, the BLS will release its “Employment Situation” report for January, which will provide additional data on the state of the labor market. (Note that the data in the JOLTS report lag the data in the “Employment Situation” report by one month.)
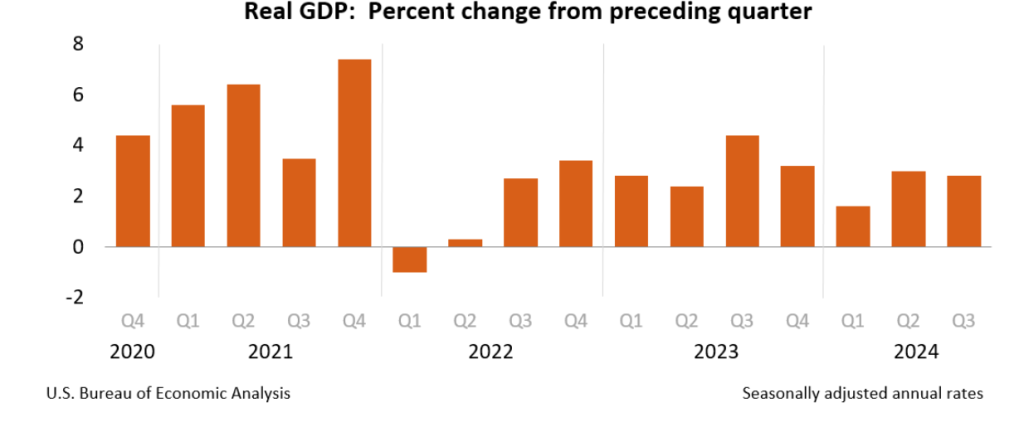
This week, two data releases paint a picture of the U.S. economy as possibly slowing slightly, but still demonstrating considerable strength. The Bureau of Economic Analysis (BEA) released its advance estimate of GDP for the third quarter of 2024. (The report can be found here.) The BEA estimates that real GDP increased by 2.8 percent at an annual rate in the third quarter—July through September. That was down from the 3.0 percent increase in real GDP in the second quarter and below the 3.1 percent that economists surveyed by the Wall Street Journal had expected. The following figure from the BEA report shows the growth rate of real GDP in each quarter since the fourth quarter of 2020.
Two other points to note: In June, the Congressional Budget Office (CBO) had forecast that the growth rate of real GDP in the third quarter would be only 2.1 percent. The CBO forecasts that, over the longer run, real GDP will grow at a rate of 1.7 to 1.8 percent per year. So, the growth rate of real GDP according to the BEA’s advance estimate (which, it’s worth recalling, is subject to potentially large revisions) was above expectations from earlier this year and above the likely long run growth rate.
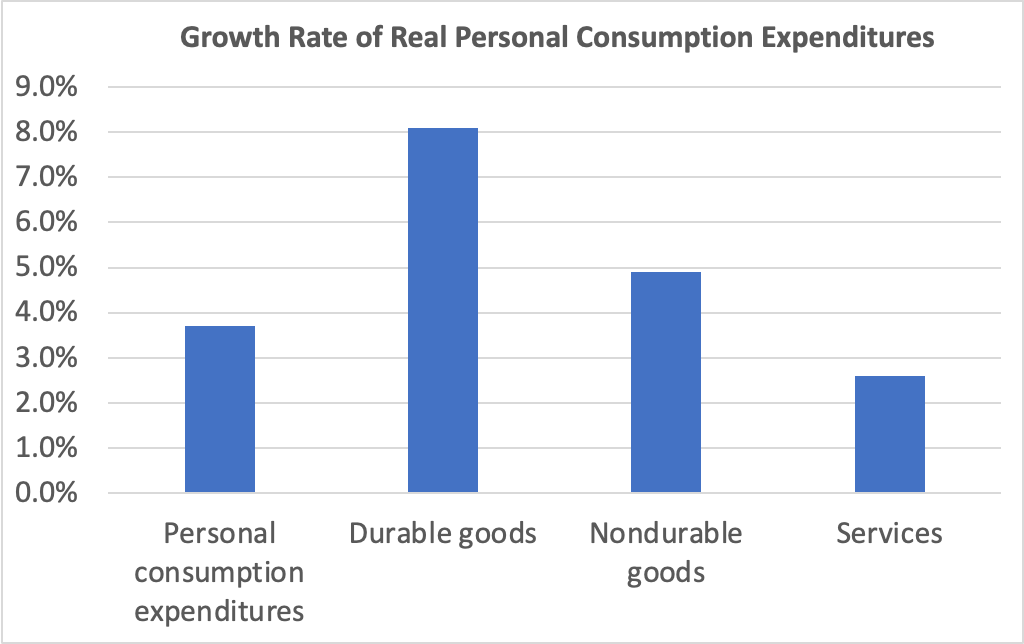
Consumer spending was the largest contributor to third quarter GDP growth. The following figure shows growth rates of real personal consumption expenditures and the subcategories of expenditures on durable goods, nondurable goods, and services. There was strong growth in each component of consumption spending. The 8.1 percent increase in expenditures on durables was particularly strong. It was the second quarter in a row of strong growth in spending on durables after a decline of –1.8 percent in the first quarter.
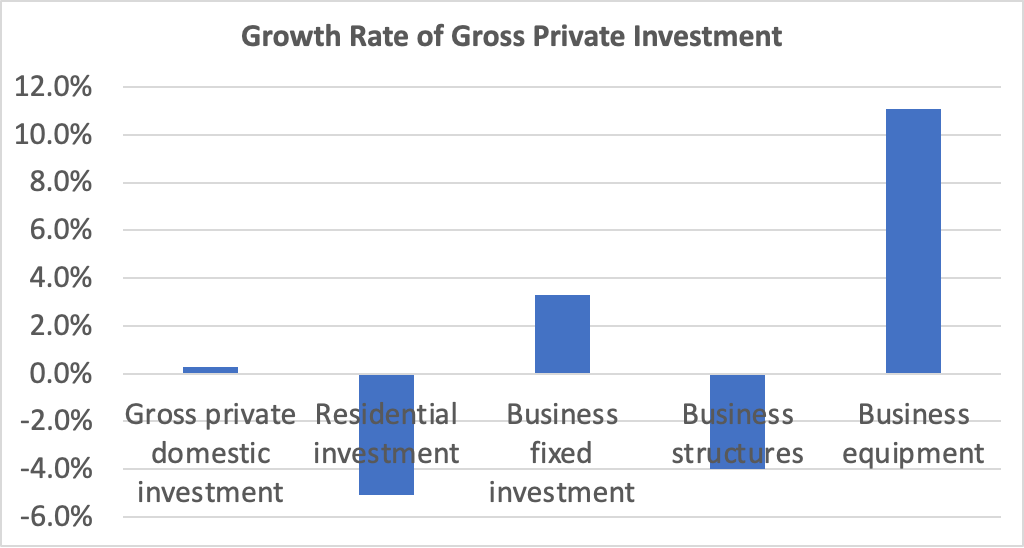
Investment spending and its components were a more mixed bag, as shown in the following figure. Investment spending is always more volatile than consumption spending. Overall, gross private domestic investment increased at a slow rate of 0.3 percent—the slowest rate since a decline in the first quarter of 2023. Residential investment decreased by 5.1 percent, reflecting difficulties in residential construction due to mortgage interest rates remaining high. Business fixed investment grew 3.1 percent, powered by an increase of 11.1 percent in spending on business equipment. Spending on structures—such as factories and office buildings—had increased rapidly over the past two years before slowing to a 0.2 percent increase in the second quarter and a decline of 4.0 percent in the fourth quarter.
The GDP report also contained data on the private consumption expenditure (PCE) price index, which the FOMC uses to determine whether it is achieving its goal of a 2 percent inflation rate. The following figure shows inflation as measured using the PCE and the core PCE—which excludes food and energy prices—since the beginning of 2016. (Note that these inflation rates are measured using quarterly data and as compound annual rates of change.) Despite the strong growth in real GDP, inflation as measured by PCE was only 1.5 percent, below the 2.5 percent increase in the second quarter and below the Federal Reserve’s 2.0 percent inflation target. Core PCE, which may be a better indicator of the likely course of inflation in the future, declined to 2.2 percent in the third quarter from 2.8 percent in the second quarter. The third quarter increase was slightly above the rate that economists surveyed by the Wall Street Journal had expected.
This week, the Bureau of Labor Statistics (BLS) released its “Job Openings and Labor Turnover” (JOLTS) report for September 2024. The report provided data indicating some weakening in the U.S. labor market. The following figure shows the rate of job openings. The BLS defines a job opening as a full-time or part-time job that a firm is advertising and that will start within 30 days and the rate of job openings as the number of job openings divided by the number of job openings plus the number of employed workers, multiplied by 100. The 4.9 percent job opening rate in September continued the slow decline from the peak rate of 7.4 percent in March 2022. The rate is also slightly below the rate during late 2018 and 2019 before the Covid pandemic.
In the following figure, we compare the total number of job openings to the total number of people unemployed. The figure shows a slow decline from a peak of more than 2 job openings per unemployed person in the spring of 2022 to 1.1 job openings per employed person in September 2024, somewhat below the levels in 2019 and early 2020, before the pandemic. Note that the number is still above 1.0, indicating that the demand for labor is still high, although no higher than during the strong labor market of 2019.
Finally, note from the figure that over the period during which the BLS has been conducting the JOLTS survey, the rate of job openings has declined just before and during recessions. Does that fact indicate that the decline in the job opening rate in recent months is signaling that a recession is likely to begin soon? We can’t say with certainty, particularly because the labor market was severely disrupted by the pandemic. The decline in the job openings rate since 2022 is more likely to reflect the labor market returning to more normal conditions than a weakening in hiring that signals a recession is coming.
To summarize these data:
Real GDP growth is strong, although below what economists had been projecting.
Inflation as measured by the PCE is below the Fed’s 2 percent target, although core inflation remains slightly above the target.
The job market has weakened somewhat, although there is no strong indication that a recession will happen in the near future.
When inflation began to accelerate in the spring of 2022, the highly unusual situation in the U.S. labor market was one of the reasons. This morning (July 2), the Bureau of Labor Statistics (BLS) released its “Job Openings and Labor Turnover” (JOLTS) report for May 2024. The report proivided more data indicating that the U.S. labor market is continuing its return to pre-pandemic conditions.
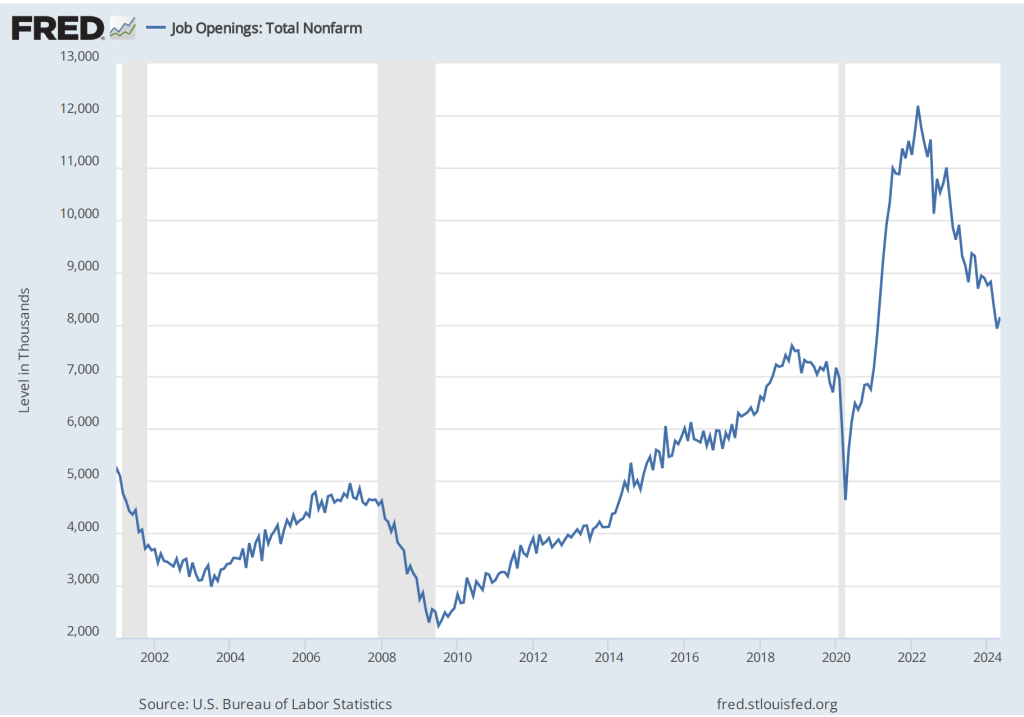
The following figures shows the total number of job openings. The BLS defines a job opening as a full-time or part-time job that a firm is advertising and that will start within 30 days. Although the total number of job openings, at 8.1 million, is still somewhat above pre-pandemic levels, it has been gradually declining since reaching a peak of 12.2 million in March 2022.
The next figure shows that, at 4.9 percent, the rate of job openings has continued its slow decline from 7.4 percent in March 2022. The rate in May was just slightly above the rate in January 2019, although it was till above the rates during most of 2019 and early 2020, as well as the rates during most of the period following the Great Recession of 2007–2009. The rate of job openings is defined by the BLS as the number of job openings divided by the number of job openings plus the number of employed workers, multiplied by 100.
In the following figure, we compare the total number of job openings to the total number of people unemployed. The figure shows a slow decline from a peak of more than 2 job openings per unemployed person in the spring of 2022 to 1.2 job openings per employed person in May 2024—the same as in April and about the same as in 2019 and early 2020, before the pandemic. Note that the number is still above 1.0, indicating that the demand for labor is still high, although no higher than during the strong labor market of 2019.
The rate at which workers are willing to quit their jobs is an indication of how they perceive the ease of finding a new job. As the following figure shows, the quit rate declined slowly from a peak of 3 percent in late 2021 and early 2022 to 2.2 percent in November 2023, where it has remained through May 2024. That rate is slightly below the rate during 2019 and early 2020. By this measure, workers perceptions of the state of the labor market seem largely unchanged in recent months.
The JOLTS data indicate that the labor market is about as strong as it was in the months priod to the start of the pandemic, but it’s not as historically tight as it was through most of 2022 and 2023. Speaking today at a conference hosted by the European Central Bank, Fed Chair Jerome Powell was quoted as saying that the Fed had made “a lot of progress” in reducing inflation and that the labor market had made “a pretty substantial” move toward a better balance between labor demand and labor supply.
On Friday morning, the BLS will release its “Employment Situation” report for June, which will provide additional data on the state of the labor market. (Note that the data in the JOLTS report lag the data in the “Employment Situation” report by one month.)
Image of “a small business with a help wanted sign in the window” generated by ChatGTP 4o.
This morning (June 4), the Bureau of Labor Statistics (BLS) released its “Job Openings and Labor Turnover” (JOLTS) report for April 2024. The report proivided more data indicating that the U.S. labor market is continuing its return to pre-pandemic conditions. The following figure shows that, at 4.8 percent, the rate of job openings has continued its slow decline from the rate of 7.4 percent in March 2022. The rate in April was the same as the rate in January 2019, although it was till above the rates during most of 2019 and early 2020, as well as the rates during most of the period following the Great Recession of 2007–2009.
The BLS defines a job opening as a full-time or part-time job that a firm is advertising and that will start within 30 days. The rate of job openings is the number of job openings divided by the number of job openings plus the number of employed workers, multiplied by 100.
In the following figure, we compare the total number of job openings to the total number of people unemployed. The figure shows a slow decline from a peak of more than 2 job openings per unemployed person in the spring of 2022 to 1.2 job openings per employed person in April 2024—about the same as in 2019 and early 2020, before the pandemic. Note that the number is still above 1.0, indicating that the demand for labor is still high, although no higher than during the strong labor market of 2019.
The rate at which workers are willing to quit their jobs is an indication of how they perceive the ease of finding a new job. As the following figure shows, the quit rate declined slowly from a peak of 3 percent in late 2021 and early 2022 to 2.2 percent in November 2023, where it has remained through April of 2024. That rate is slightly below the rate during 2019 and early 2020. By this measure, workers perceptions of the state of the labor market seem largely unchanged in recent months.
The JOLTS data indicate that the labor market is about as strong as it was in the months priod to the start of the pandemic, but it’s not as historically tight as it was through most of 2022 and 2023.
On Friday morning, the BLS will release its “Employment Situation” report for May, which will provide additional data on the state of the labor market. (Note that the data in the JOLTS report lag the data in the “Employment Situation” report by one month.)
Some interesting macro data were released during the past two weeks. On the key issues, the data indicate that inflation continues to run in the range of 3.0 percent to 3.5 percent, although depending on which series you focus on, you could conclude that inflation has dropped to a bit below 3 percent or that it is still in vicinity of 4 percent. On balance, output and employment data seem to be indicating that the economy may be cooling in response to the contractionary monetary policy that the Federal Open Market Committee began implementing in March 2022.
We can summarize the key data releases.
Employment, Unemployment, and Wages
On Friday morning, the Bureau of Labor Statistics (BLS) released its Employment Situation report. (The full report can be found here.) Economists and policymakers—notably including the members of the Federal Reserve’s Federal Open Market Committee (FOMC)—typically focus on the change in total nonfarm payroll employment as recorded in the establishment, or payroll, survey. That number gives what is generally considered to be the best indicator of the current state of the labor market.
The previous month’s report included a surprisingly strong net increase of 336,000 jobs during September. Economists surveyed by the Wall Street Journal last week forecast that the net increase in jobs in October would decline to 170,000. The number came in at 150,000, slightly below that estimate. In addition, the BLS revised down the initial estimates of employment growth in August and September by a 101,000 jobs. The figure below shows the net gain in jobs for each month of 2023.
Although there are substantial fluctuations, employment increases have slowed in the second half of the year. The average increase in employment from January to June was 256,667. From July to October the average increase declined to 212,000. In the household survey, the unemployment rate ticked up from 3.8 percent in September to 3.9 percent in October. The unemployment rate has now increased by 0.5 percentage points from its low of 3.4 percent in April of this year.
Finally, data in the employment report provides some evidence of a slowing in wage growth. The following figure shows wage inflation as measured by the percentage increase in average hourly earnings (AHE) from the same month in the previous year. The increase in October was 4.1 percent, continuing a generally downward trend since March 2022, although still somewhat above wage inflation during the pre-2020 period.
As the following figure shows, September growth in average hourly earnings measured as a compound annual growth rate was 2.5 percent, which—if sustained—would be consistent with a rate of price inflation in the range of the Fed’s 2 percent target. (The figure shows only the months since January 2021 to avoid obscuring the values for recent months by including the very large monthly increases and decreases during 2020.)
Job Openings and Labor Turnover Survey (JOLTS)
On November 1, the BLS released its Job Openings and Labor Turnover Survey (JOLTS) report for September 2023. (The full report can be found here.) The report indicated that the number of unfilled job openings was 9.5 million, well below the peak of 11.8 million job openings in December 2021 but—as shown in the following figure—well above prepandemic levels.
The following figure shows the ratio of the number of job opening to the number of unemployed people. The figure shows that, after peaking at 2.0 job openings per unemployed person in in March 2022, the ratio has decline to 1.5 job opening per unemployed person in September 2022. While high, that ratio was much closer to the ratio of 1.2 that prevailed during the year before the pandemic. In other words, while the labor market still appears to be strong, it has weakened somewhat in recent months.
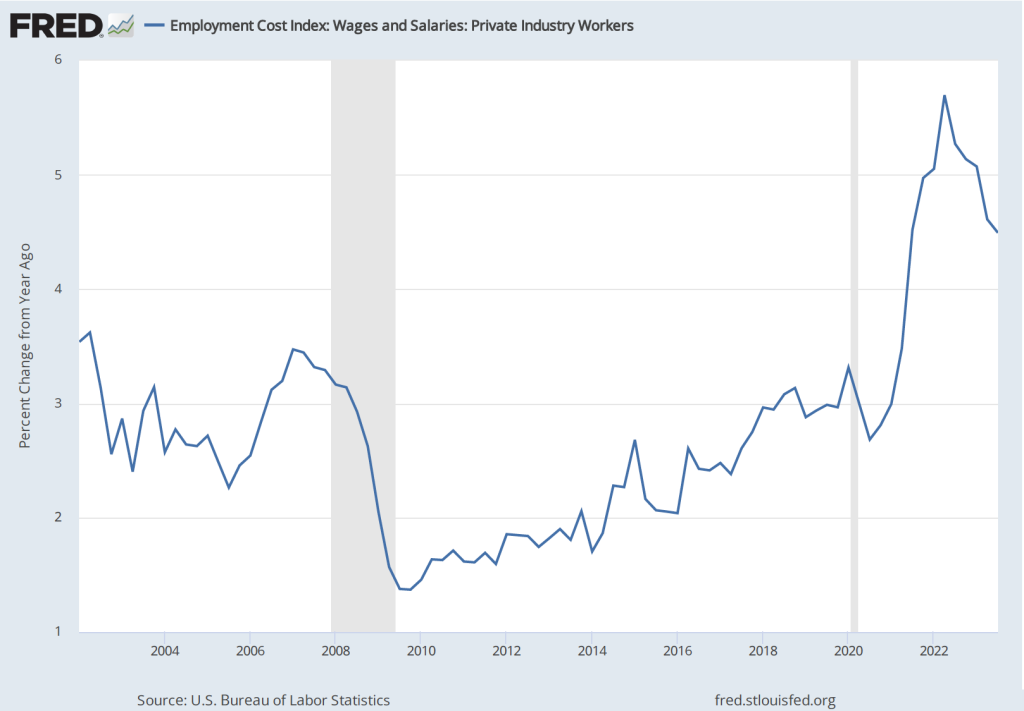
Employment Cost Index
As we note in this blog post, the employment cost index (ECI), published quarterly by the BLS, measures the cost to employers per employee hour worked and can be a better measure than AHE of the labor costs employers face. The BLS released its most recent report on October 31. (The report can be found here.) The first figure shows the percentage change in ECI from the same quarter in the previous year. The second figure shows the compound annual growth rate of the ECI. Both measures show a general downward trend in the growth of labor costs, although compound annual rate of change shows an uptick in the third quarter of 2023. (We look at wages and salaries rather than total compensation because non-wage and salary compensation can be subject to fluctuations unrelated to underlying trends in labor costs.)
The Federal Open Market Committee’s October 31-November 1 Meeting
As was widely expected from indications in recent statements by committee members, the Federal Open Market Committee voted at its most recent meeting to hold constant its targe range for the federal funds rate at 5.25 percent to 5.50 percent. (The FOMC’s statement can be found here.)
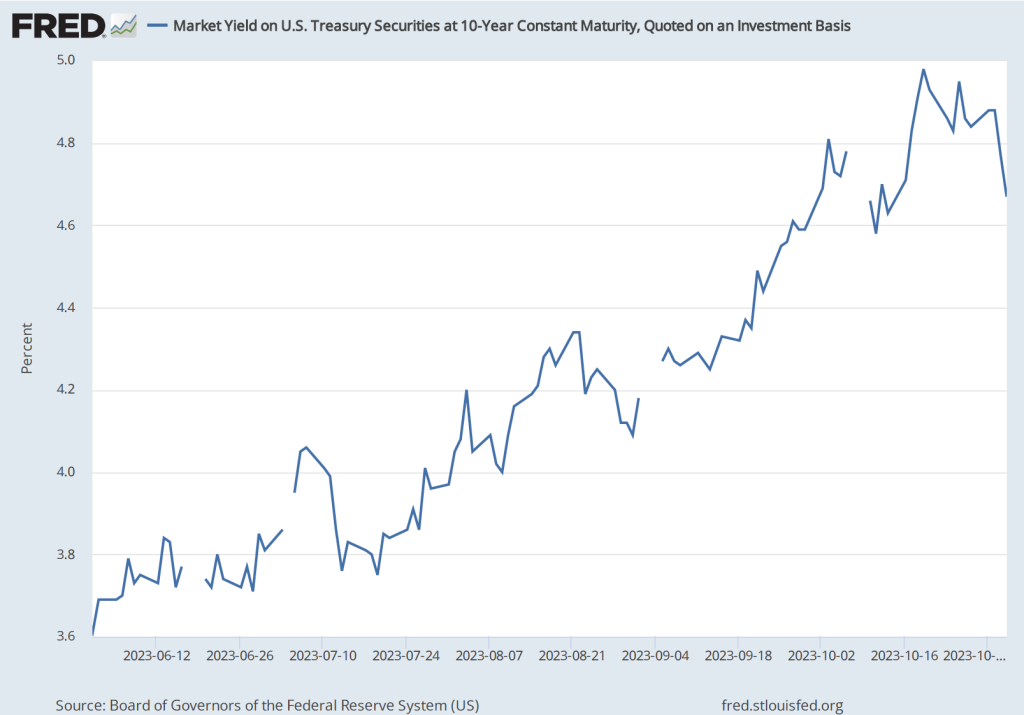
At a press conference following the meeting, Fed Chair Jerome Powell remarks made it seem unlikely that the FOMC would raise its target for the federal funds rate at its December 14-15 meeting—the last meeting of 2023. But Powell also noted that the committee was unlikely to reduce its target for the federal funds rate in the near future (as some economists and financial jounalists had speculated): “The fact is the Committee is not thinking about rate cuts right now at all. We’re not talking about rate cuts, we’re still very focused on the first question, which is: have we achieved a stance of monetary policy that’s sufficiently restrictive to bring inflation down to 2 percent over time, sustainably?” (The transcript of Powell’s press conference can be found here.)
Investors in the bond market reacted to Powell’s press conference by pushing down the interest rate on the 10-year Treasury note, as shown in the following figure. (Note that the figure gives daily values with the gaps representing days on which the bond market was closed) The interest rate on the Treasury note reflects investors expectations of future short-term interest rates (as well as other factors). Investors interpreted Powell’s remarks as indicating that short-term rates may be somewhat lower than they had previously expected.
Real GDPand the Atlanta Fed’s Real GDPNow Estimate for the Fourth Quarter
On October 26, the Bureau of Economic Analysis (BEA) released its advance estimate of real GDP for the third quarter of 2023. (The full report can be found here.) We discussed the report in this recent blog post. Although, as we note in that post, the estimated increase in real GDP of 4.9 percent is quite strong, there are indications that real GDP may be growing significantly more slowly during the current (fourth) quarter.
The Federal Reserve Bank of Atlanta compiles a forecast of real GDP called GDPNow. The GDPNow forecast uses data that are released monthly on 13 components of GDP. This method allows economists at the Atlanta Fed to issue forecasts of real GDP well in advance of the BEA’s estimates. On November 1, the GDPNow forecast was that real GDP in the fourth quarter of 2023 would increase at a slow rate of 1.2 percent. If this preliminary estimate proves to be accurate, the growth rate of the U.S. economy will have sharply declined from the third to the fourth quarter.
Fed Chair Powell has indicated that economic growth will likely need to slow if the inflation rate is to fall back to the target rate of 2 percent. The hope, of course, is that contractionary monetary policy doesn’t cause aggregate demand growth to slow to the point that the economy slips into a recession.
A job fair in Albuquerque, New Mexico earlier this year. (Photo from Zuma Press via the Wall Street Journal.)
In his speech at the Kansas City Fed’s Jackson Hole, Wyoming symposium, Fed Chair Jerome Powell noted that: “Getting inflation back down to 2 percent is expected to require a period of below-trend economic growth as well as some softening in labor market conditions.” To this point, there isn’t much indication that the U.S. economy is experiencing slower economic growth. The Atlanta Fed’s widely followed GDPNow forecast has real GDP increasing at a rapid 5.3 percent during the third quarter of 2023.
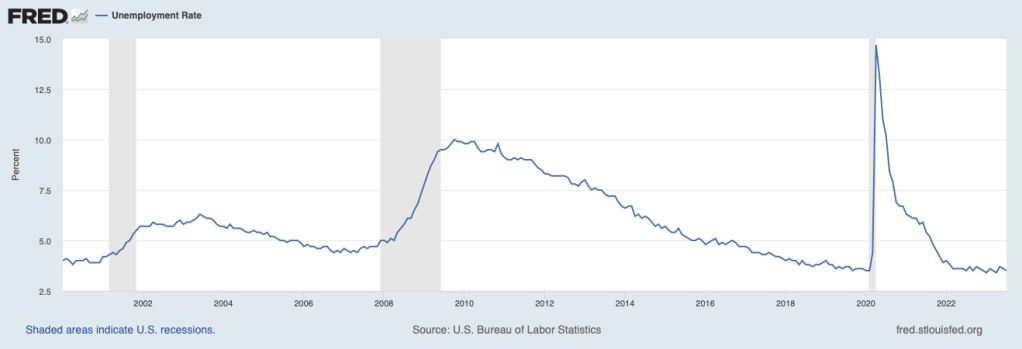
But the labor market does appear to be softening. The most familiar measure of the state of the labor market is the unemployment rate. As the following figure shows, the unemployment rate remains very low.
But, as we noted in this earlier post, an alternative way of gauging the strength of the labor market is to look at the ratio of the number of job openings to the number of unemployed workers. The Bureau of Labor Statistics (BLS) defines a job opening as a full-time or part-time job that a firm is advertising and that will start within 30 days. The higher the ratio of job openings to unemployed workers, the more difficulty firms have in filling jobs, and the tighter the labor market is. As indicated by the earlier quote from Powell, the Fed is concerned that in a very tight labor market, wages will increase more rapidly, which will likely lead firms to increase prices. The following figure shows that in July the ratio of job openings to unemployed workers has declined from the very high level of around 2.0 that was reached in several months between March 2022 and December 2022. The July 2023 value of 1.5, though, was still well above the level of 1.2 that prevailed from mid-2018 to February 2022, just before the beginning of the Covid–19 pandemic. These data indicate that labor market conditions continue to ease, although they remain tighter than they were just before the pandemic.
The following figure shows movements in the quit rate. The BLS calculates job quit rates by dividing the number of people quitting jobs by total employment. When the labor market is tight and competition among firms for workers is high, workers are more likely to quit to take another job that may be offering higher wages. The quit rate in July 2023 had fallen to 2.3 percent of total employment from a high of 3.0 percent, reached in both November 2021 and April 2022. The quit rate was back to its value just before the pandemic. The quit rate data are consistent with easing conditions in the labor market. (The data on job openings and quits are from the BLS report Job Openings and Labor Turnover—July 2023—the JOLTS report—released on August 29. The report can be found here.)
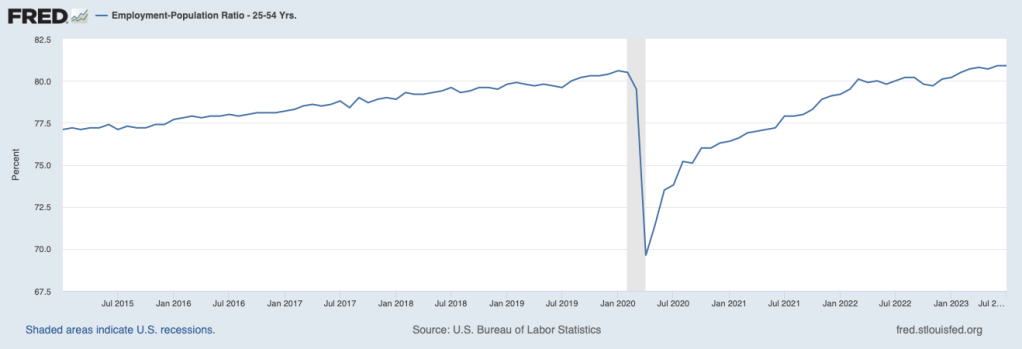
In his Jackson Hole speech, Powell noted that: “Labor supply has improved, driven by stronger participation among workers aged 25 to 54 and by an increase in immigration back toward pre-pandemic levels.” The following figure shows the employment-population ratio for people aged 25 to to 54—so-called prime-age workers. In July 2023, 80.9 percent of people in this age group were employed, actually above the ratio of 80.5 percent just before the pandemic. This increase in labor supply is another indication that the labor market disruptions caused by the pandemic has continued to ease, allowing for an increase in labor supply.
Taken together, these data indicate that labor market conditions are easing, likely reducing upward pressure on wages, and aiding the continuing decline in the inflation rate towards the Fed’s 2 percent target. Unless the data for August show an acceleration in inflation or a tightening of labor market conditions—which is certainly possible given what appears to be a strong expansion of real GDP during the third quarter—at its September meeting the Federal Open Market Committee is likely to keep its target for the federal funds rate unchanged.
On Tuesday, August 30, 2022, the U.S. Bureau of Labor Statistics (BLS) released its Job Openings and Labor Turnover Survey (JOLTS) report for July 2022. The report indicated that the U.S. labor market remained very strong, even though, according to the Bureau of Economic Analysis (BEA), real gross domestic product (GDP) had declined during the first half of 2022. (In this blog post, we discuss the possibility that during this period the real GDP data may have been a misleading indicator of the actual state of the economy.)
As the following figure shows, the rate of job openings remained very high, even in comparison with the strong labor market of 2019 and early 2020 before the Covid-19 pandemic began disrupting the U.S. economy. The BLS defines a job opening as a full-time or part-time job that a firm is advertising and that will start within 30 days. The rate of job openings is the number of job openings divided by the number of job openings plus the number of employed workers, multiplied by 100.
In the following figure, we compare the total number of job openings to the total number of people unemployed. The figure shows that in July 2022 there were almost two jobs available for each person who was unemployed.
Typically, a strong job market with high rates of job openings indicates that firms are expanding and that they expect their profits to be increasing. As we discuss in Macroeconomics, Chapter 6, Section 6.2 (Microeconomics and Economics, Chapter 8, Section 8.2) the price of a stock is determined by investors’ expectations of the future profitability of the firm issuing the stock. So, we might have expected that on the day the BLS released the July JOLTS report containing good news about the labor market, the stock market indexes like the Dow Jones Industrial Average, the S&P 500, and the Nasdaq Composite Index would rise. In fact, though the indexes fell, with the Dow Jones Industrial Average declining a substantial 300 points. As a column in the Wall Street Journal put it: “A surprisingly tight U.S. labor market is rotten news for stock investors.” Why did good news about the labor market could cause stock prices to decline? The answer is found in investors’ expectations of the effect the news would have on monetary policy.
In August 2022, Fed Chair Jerome Powell and the other members of the Federal Reserve Open Market Committee (FOMC) were in the process of tightening monetary policy to reduce the very high inflation rates the U.S. economy was experiencing. In July 2022, inflation as measured by the percentage change in the consumer price index (CPI) was 8.5 percent. Inflation as measured by the percentage change in the personal consumption expenditures (PCE) price index—which is the measure of inflation that the Fed uses when evaluating whether it is hitting its target of 2 percent annual inflation—was 6.3 percent. (For a discussion of the Fed’s choice of inflation measure, see the Apply the Concept “Should the Fed Worry about the Prices of Food and Gasoline,” in Macroeconomics, chapter 15, Section 15.5 and in Economics, Chapter 25, Section 25.5.)
To slow inflation, the FOMC was increasing its target for the federal funds rate—the interest rate that banks charge each other on overnight loans—which in turn was leading to increases in other interest rates, such as the interest rate on residential mortgage loans. Higher interest rates would slow increases in aggregate demand, thereby slowing price increases. How high would the FOMC increase its target for the federal funds rate? Fed Chair Powell had made clear that the FOMC would monitor economic data for indications that economic activity was slowing. Members of the FOMC were concerned that unless the inflation rate was brought down quickly, the U.S. economy might enter a wage-price spiral in which high inflation rates would lead workers to push for higher wages, which, in turn, would increase firms’ labor costs, leading them to raise prices further, in response to which workers would push for even higher wages, and so on. (We discuss the concept of a wage-price spiral in this earlier blog post.)
In this context, investors interpretated data showing unexpected strength in the economy—particularly in the labor market—as making it likely that the FOMC would need to make larger increases in its target for the federal fund rate. The higher interest rates go, the more likely that the U.S. economy will enter an economic recession. During recessions, as production, income, and employment decline, firms typically experience lower profits or even suffer losses. So, a good JOLTS report could send stock prices falling because news that the labor market was stronger than expected increased the likelihood that the FOMC’s actions would push the economy into a recession, reducing profits. Or as the Wall Street Journal column quoted earlier put it:
“So Tuesday’s [JOLTS] report was good news for workers, but not such good news for stock investors. It made another 0.75-percentage-point rate increase [in the target for the federal funds rate] from the Fed when policy makers meet next month seem increasingly likely, while also strengthening the case that the Fed will keep raising rates well into next year. Stocks sold off sharply following the report’s release.”
Sources: U.S. Bureau of Labor Statistics, “Job Openings and Labor Turnover–July 2022,” bls.gov, August 30, 2022; Justin Lahart, “Why Stocks Got Jolted,” Wall Street Journal, August 30, 2022; Jerome H. Powell, “Monetary Policy and Price Stability,” speech at “Reassessing Constraints on the Economy and Policy,” an economic policy symposium sponsored by the Federal Reserve Bank of Kansas City, Jackson Hole, Wyoming, August 26, 2022; and Federal Reserve Bank of St. Louis.