Does the Latest GDP Report Indicate the U.S. Economy Is Entering a Period of Stagflation?

Arthur Burns was Fed chair during the stagflation of the 1970s. (Photo from the Wall Street Journal)

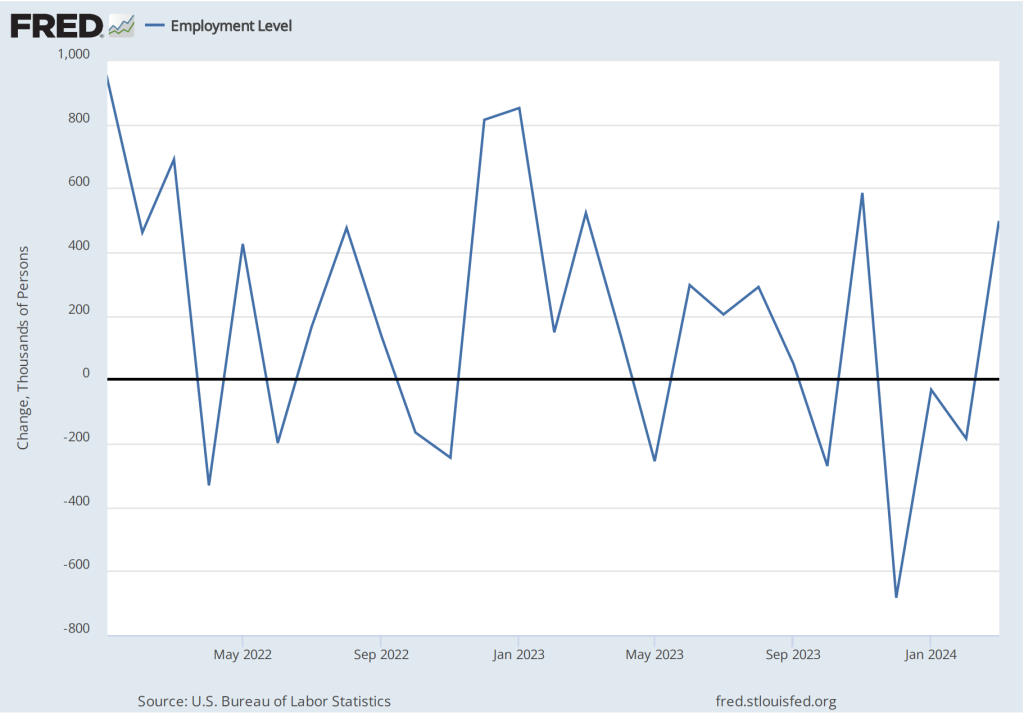
This morning, Thursday April 25, the Bureau of Economic Analysis (BEA) released its advance estimate of real GDP growth during the first quarter of 2024. The two most striking points in the report are, first, that real GDP increased in the first quarter at an annual rate of only 1.6 percent—well below the 2.5 percent increase expected in a survey of economists and the 2.7 percent increase indicated by the Federal Reserve Bank of Atlanta’s GDPNow forecast. As the following figure shows, the growth rate of real GDP has declined in each of the last two quarters from the very strong growth rate of 4.9 percent during the third quarter of 2023.  

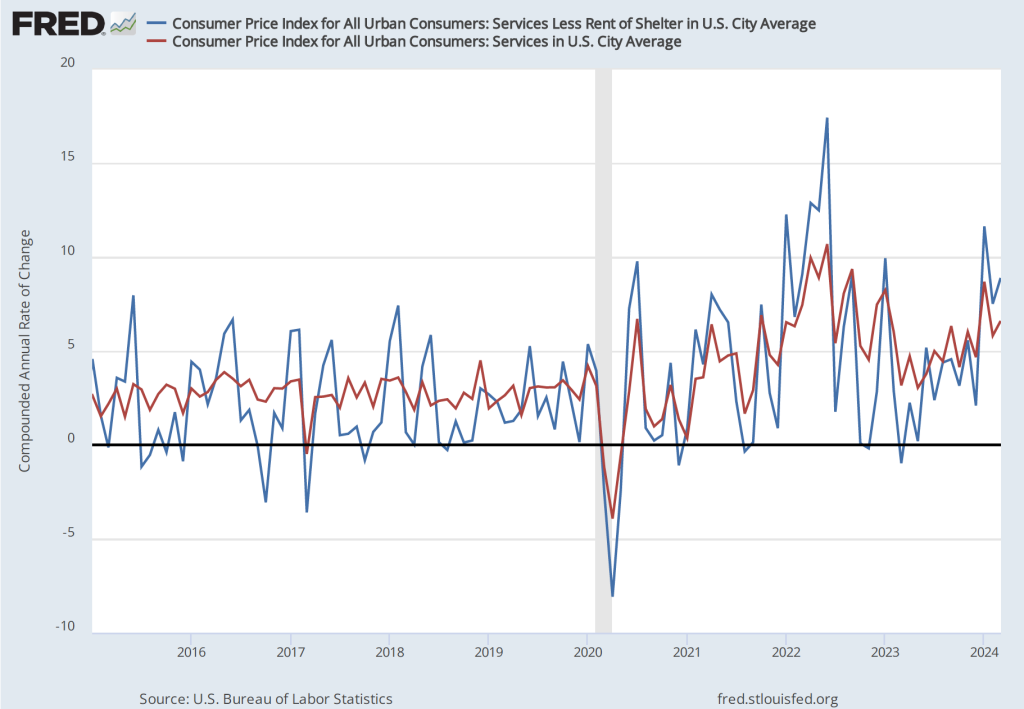
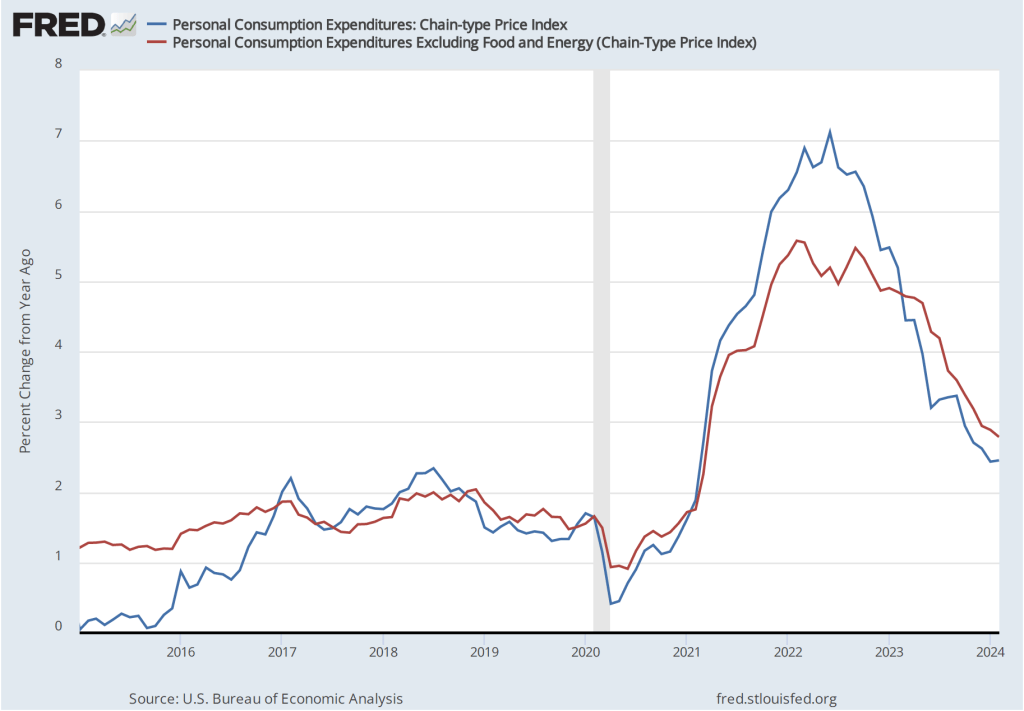
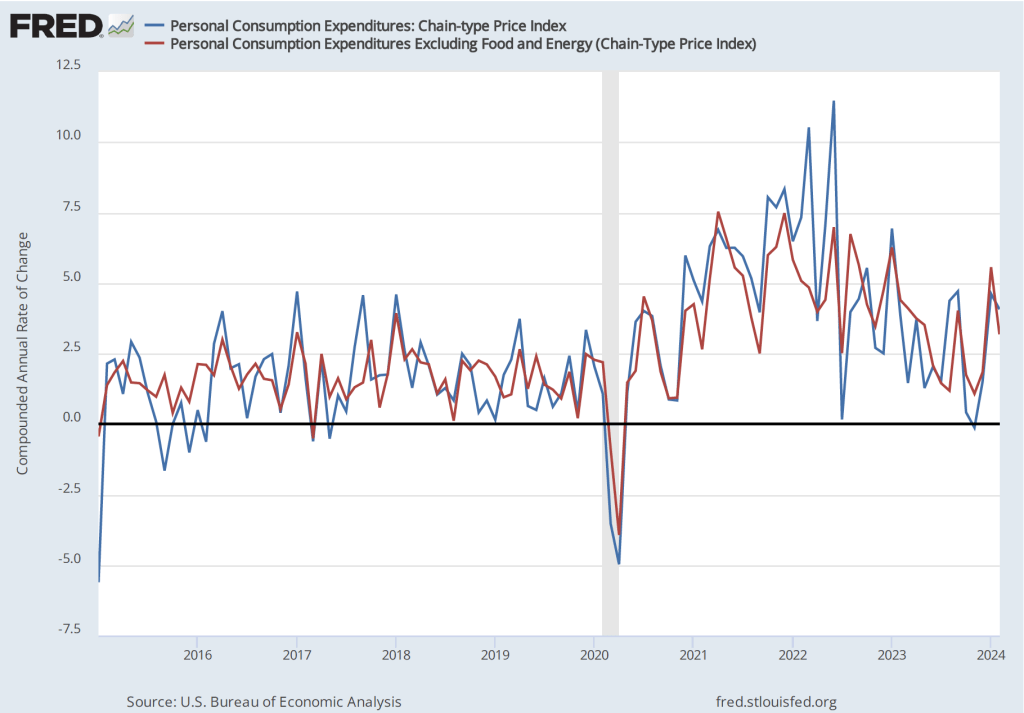
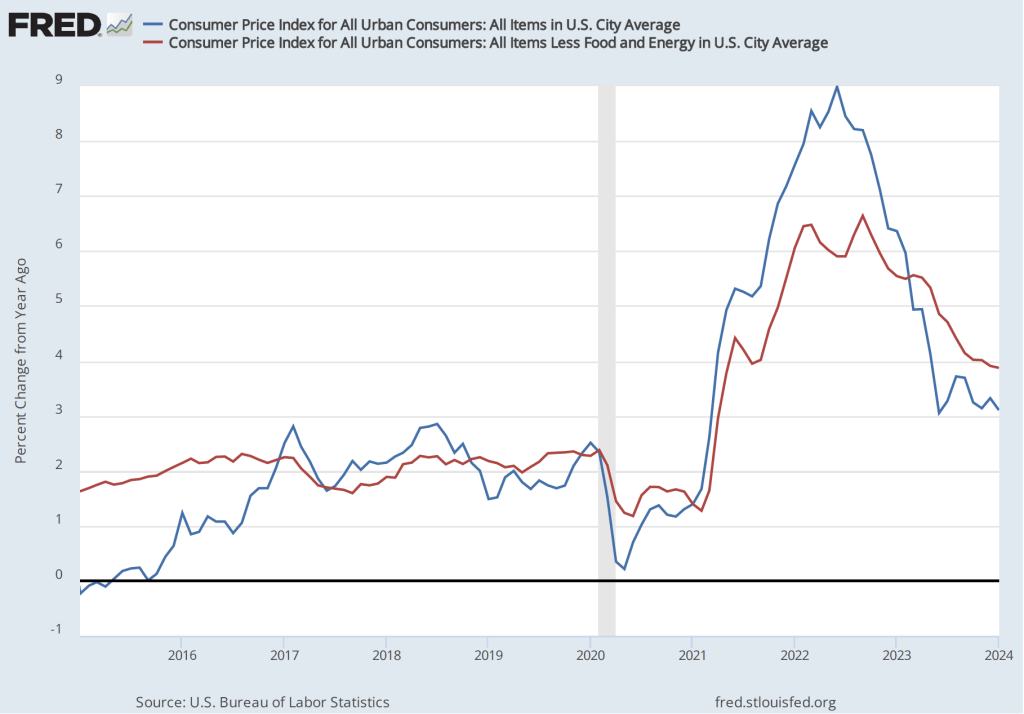
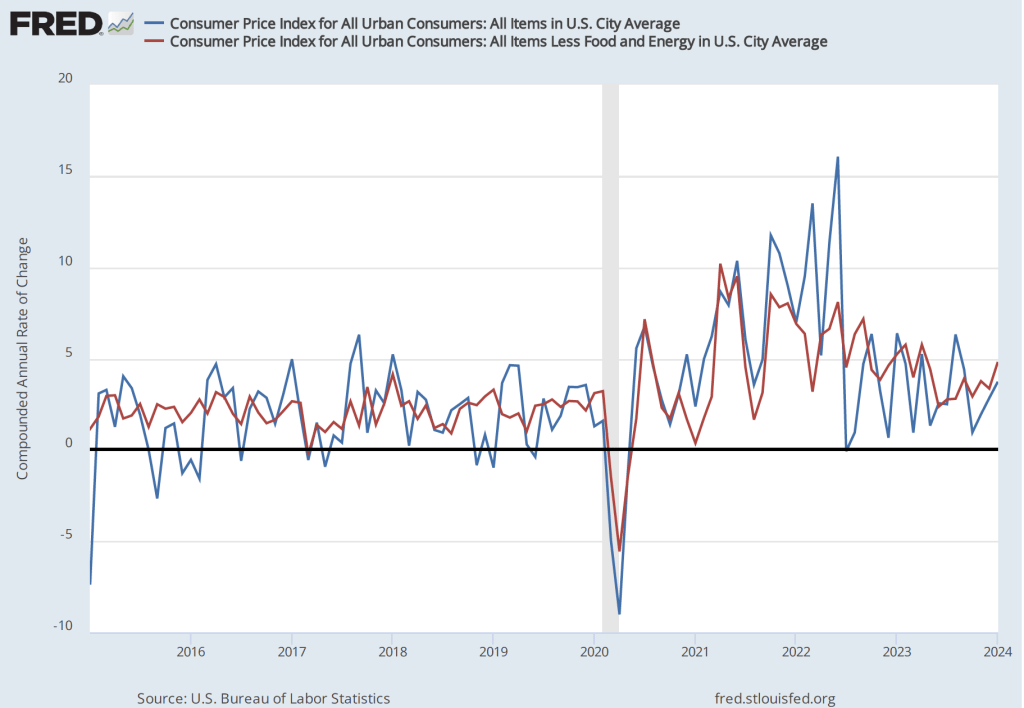
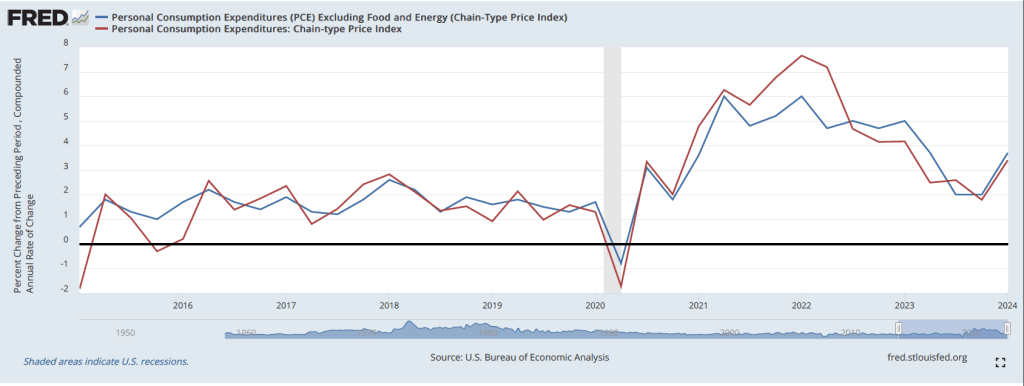
The second striking point in the report was an unexpected increase in inflation, as measured using the personal consumption expenditures (PCE) price index. As the following figure shows, PCE inflation (the red line), measured as a compound annual rate of change, increased from 1.8 percent in the fourth quarter of 2023 to 3.4 percent in the first quarter of 2024. Core PCE inflation (the blue line), which excludes food and energy prices, increased from 2.0 percent in the fourth quarter of 2023 to 3.7 percent in the first quarter of 2024. These data indicate that inflation in the first quarter of 2024 was running well above the Federal Reserve’s 2.0 percent target.

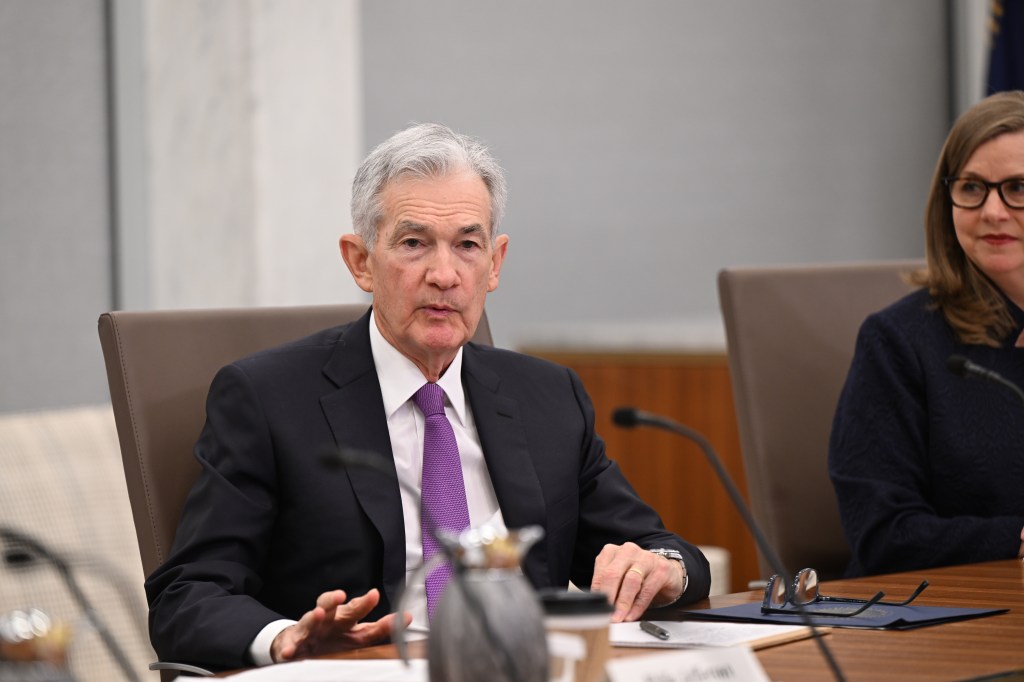
A combination of weak economic growth and above-target inflation poses a policy dilemma for the Fed. As we discuss in Macroeconomics, Chapter 13, Section 13.3 (Economics, Chapter 23, Section 23.3), the combination of slow growth and inflation is called stagflation. During the 1970s, when the U.S. economy suffered from stagflation, Fed Chair Arthur Burns (whose photo appears at the beginning of this post) was heavily criticized by members of Congress for his inability to deal with the problem. Stagflation poses a dilemma for the Fed because using an expansionary monetary policy to deal with slow economic growth may cause the inflation rate to rise. Using a contractionary monetary policy to deal with high inflation can cause growth to slow further, possibly pushing the economy into a recession.

Is Fed Chair Jerome Powell in as difficult a situation as Arthur Burns was in the 1970s? Not yet, at least. First, Burns faced a period of recession—declining real GDP and rising unemployment—whereas currently, although economic growth seems to be slowing, real GDP is still rising and the unemployment rate is still below 4 percent. In addition, the inflation rate in these data are below 4 percent, far less than the 10 percent inflation rates during the 1970s.

Second, it’s always hazardous to draw conclusions on the basis of a single quarter’s data. The BEA’s real GDP estimates are revised several times, so that the value for the first quarter of 2024 may well be revised significantly higher (or lower) in coming months.

Third, the slow rate of growth of real GDP in the first quarter is accounted for largely by a surge in imports—which are subtracted from GDP—and a sharp decline in inventory investment. Key components of aggregate demand remained strong: Consumption expenditures increased at annual rate of 2.5 per cent and business investment increased at an annual rate of 3.2 percent. Residential investment was particularly strong, growing at an annual rate 0f 13.2 percent—despite the effects of rising mortgage interest rates. One way to strip out the effects of net exports, inventory investment, and government purchases—which can also be volatile—is to look at final sales to domestic purchasers, which includes only spending by U.S. households and firms on domestic production. As the following figure shows, real final sales to domestic purchasers declined only modertately from 3.3 percent in the fourth quarter of 2023 to 3.1 percent in the first quarter of 2024.

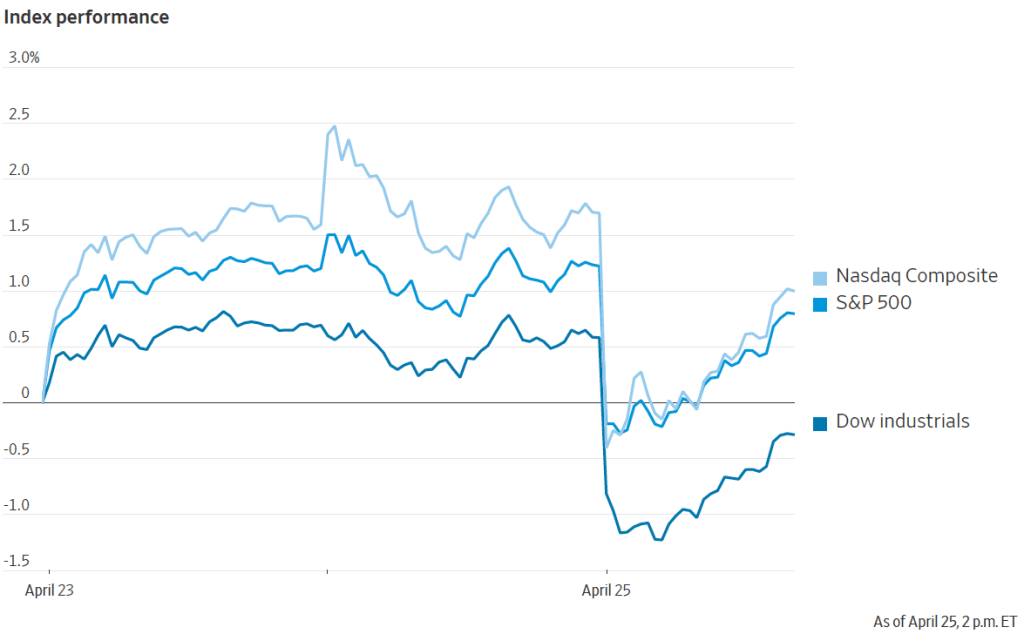
Looking at these details of the GDP report indicate that growth may have slowed less during the first quarter than the growth rate of real GDP seems to indicate. Investors on Wall Street may have come to this same conclusion. As shown by this figure from the Wall Street Journal, shows that stock prices fell sharply when trading opened at 9:30 am, but by 2 pm has recovered some of their losses as investors considered further the implications of the GDP report. (As we discuss in Macroeconomics, Chapter 6, Section 6.2 and Economics, Chapter 8, Section 8.2, movements in stock price indexes can provide some insight into investors’ expectations of future movements in corporate profits, which, in turn, depend in part on future movements in economic growth.)

Finally, we may get more insight into the rate of inflation tomorrow morning when the BEA releases its report on “Personal Income and Outlays,” which will include data on PCE inflation during March. The monthly PCE data provide more current information than do the quarterly data in the GDP report.

In short, today’s report wasn’t good news, but may not have been as bad as it appeared at first glance. We are far from being able to conclude that the U.S. economy is entering into a period of stagflation.

Will the Fed Not Cut Rates at All this Year?

Federal Reserve Vice Chair Philip Jefferson (photo from the Federal Reserve)

Federal Reserve Chair Jerome Powell (photo from the Federal Reserve)

At the beginning of 2024, investors were expecting that during the year the Fed’s policy-making Federal Open Market Committee (FOMC) would cut its target range for the federal funds rate six or seven times. At its meeting on March 19-20 the economic projections of the members of the FOMC indicated that they were expecting to cut the target range three times from its current 5.25 percent to 5.50 percent. But, as we noted in this recent post and in this podcast, macroeconomic data during the first three months of this year indicated that the U.S. economy was growing more rapidly than the Fed had expected and the reductions in inflation that occurred during the second half of 2023 had not persisted into the beginning of 2024.

The unexpected strength of the economy and the persistence of inflation above the Fed’s 2 percent target have raised the issue of whether the FOMC will cut its target range for the federal funds rate at all this year. Earlier this month, Neel Kashkari, president of the Federal Reserve Bank of Minneapolis raised the possibility that the FOMC would not cut its target range this year.

Today (April 16) both Fed Vice Chair Philip Jefferson and Fed Chair Jerome Powell addressed the issue of monetary policy. They gave what appeared to be somewhat different signals about the likely path of the federal funds target during the remainder of this year—bearing in mind that Fed officials never commit to any specific policy when making a speech. Adressing the International Research Forum on Monetary Policy, Vice Chair Jefferson stated that:

“My baseline outlook continues to be that inflation will decline further, with the policy rate held steady at its current level, and that the labor market will remain strong, with labor demand and supply continuing to rebalance. Of course, the outlook is still quite uncertain, and if incoming data suggest that inflation is more persistent than I currently expect it to be, it will be appropriate to hold in place the current restrictive stance of policy for longer.”

One interpretation of his point here is that he is still expecting that the FOMC will cut its target for the federal funds rate sometime this year unless inflation remains persistently higher than the Fed’s target—which he doesn’t expect.

Chair Powell, speaking at a panel discussion at the Wilson Center in Washington, D.C., seemed to indicate that he believed it was less likely that the FOMC would reduce its federal funds rate target in the near future. The Wall Street Journal summarized his remarks this way:

“Federal Reserve Chair Jerome Powell said firm inflation during the first quarter had introduced new uncertainty over whether the central bank would be able to lower interest rates this year without signs of an economic slowdown. His remarks indicated a clear shift in the Fed’s outlook following a third consecutive month of stronger-than-anticipated inflation readings ….”

An article on bloomberg.com had a similar interpretation of Powell’s remarks: “Federal Reserve Chair Jerome Powell signaled policymakers will wait longer than previously anticipated to cut interest rates following a series of surprisingly high inflation readings.”

Politics may also play a role in the FOMC’s decisions. As we discuss in Macroeconomics, Chapter 17, Section 17.4 (Economics, Chapter 27, Section 27.4), the Federal Reserve Act, which Congress passed in 1913 and has amended several times since, puts the Federal Reserve in an unusal position in the federal government. Although the members of the Board of Governors are appointed by the president and confirmed by the Senate, the Fed was intended to act independently of Congress and the president. Over the years, Fed Chairs have protected that independence by, for the most part, avoiding taking actions beyond the narrow responsibilites Congress has given to the Fed by Congress and by avoiding actions that could be interpreted as political.

This year is, of course, a presidential election year. The following table from the Fed’s web site lists the FOMC meetings this year. The presidential election will occur on November 5. There are four scheduled FOMC meetings before then. Given that inflation has been running well above the Fed’s target during the first three months of the year, it would likely take at least two months of lower inflation data—or a weakening of the economy as indicated by a rising unemployment rate—before the FOMC would consider lowering its federal funds rate target. If so, the meeting on July 30-31 might be the first meeting at which a rate reduction would occur. If the FOMC doesn’t act at its July meeting, it might be reluctant to cut its target at the September 17-18 meeting because acting close to the election might be interpreted as an attempt to aid President Joe Biden’s reelection.

Although we don’t know whether avoiding the appearance of intervening in politics is an important consideration for the members of the FOMC, some discussion in the business press raises the possibility. For instance, a recent article in the Wall Street Journal noted that:

“The longer that officials wait, the less likely there will be cuts this year, some analysts said. That is because officials will likely resist starting to lower rates in the midst of this year’s presidential election campaign to avoid political entanglements.”

These are clearly not the easiest times to be a Fed policymaker!

How Will the Fed React to Another High Inflation Report?

In a recent podcast we discussed what actions the Fed may take if inflation continues to run well above the Fed’s 2 percent target. We are likely a step closer to finding out with the release this morning (April 10) by the Bureau of Labor Statistics (BLS) of data on the consumer price index (CPI) for March. The inflation rate measured by the percentage change in the CPI from the same month in the previous month—headline inflation—was 3.5 percent, slightly higher than expected (as indicated here and here). As the following figure shows, core inflation—which excludes the prices of food and energy—was 3.8 percent, the same as in January.

If we look at the 1-month inflation rate for headline and core inflation—that is the annual inflation rate calculated by compounding the current month’s rate over an entire year—the values seem to confirm that inflation, while still far below its peak in mid-2022, has been running somewhat higher than it did during the last months of 2023. Headline CPI inflation in March was 4.6 percent (down from 5.4 percent in February) and core CPI inflation was 4.4 percent (unchanged from February). It’s worth bearing in mind that the Fed’s inflation target is measured using the personal consumption expenditures (PCE) price index, not the CPI. But CPI inflation at these levels is not consistent with PCE inflation of only 2 percent.

As has been true in recent months, the path of inflation in the prices of services has been concerning. As we’ve noted in earlier posts, Federal Reserve Chair Jerome Powell has emphasized that as supply chain problems have gradually been resolved, inflation in the prices of goods has been rapidly declining. But inflaion in services hasn’t declined nearly as much. Last summer he stated the point this way:

“Part of the reason for the modest decline of nonhousing services inflation so far is that many of these services were less affected by global supply chain bottlenecks and are generally thought to be less interest sensitive than other sectors such as housing or durable goods. Production of these services is also relatively labor intensive, and the labor market remains tight. Given the size of this sector, some further progress here will be essential to restoring price stability.”

The following figure shows the 1-month inflation rate in services prices and in services prices not included including housing rent. Some economists believe that the rent component of the CPI isn’t well measured and can be volatile, so it’s worthwhile to look at inflation in service prices not including rent. The figure shows that inflation in all service prices has been above 4 percent in every month since July 2023. Inflation in service prices increased from 5.8 percent in February to 6.6 percent in March . Inflation in service prices not including housing rent was even higher, increasing from 7.5 percent in February to 8.9 percent in March. Such large increases in the prices of services, if they were to continue, wouldn’t be consistent with the Fed meeting its 2 percent inflation target.

Finally, some economists and policymakers look at median inflation to gain insight into the underlying trend in the inflation rate. If we listed the inflation rate in each individual good or service in the CPI, median inflation is the inflation rate of the good or service that is in the middle of the list—that is, the inflation rate in the price of the good or service that has an equal number of higher and lower inflation rates. As the following figure shows, although median inflation declined in March, it was still high at 4.3 percent. Median inflation is volatile, but the trend has been generally upward since July 2023.

Financial investors, who had been expecting that this CPI report would show inflation slowing, reacted strongly to the news that, in fact, inflation had ticked up. As of late morning, the Dow Jones Industrial Average had decline by nearly 500 points and the S&P 5o0 had declined by 59 points. (We discuss the stock market indexes in Macroeconomics, Chapter 6, Section 6.2 and in Microeconomics and Economics, Chapter 8, Section 8.2.) The following figure from the Wall Street Journal shows the sharp reaction in the bond market as the interest rate on the 10-year Treasury note rose sharply following the release of the CPI report.

Lower stock prices and higher long-term interest rates reflect the fact that investors have changed their views concerning when the Fed’s Federal Open Market Committee (FOMC) will cut its target for the federal funds and how many rate cuts there may be this year. At the start of 2024, the consensus among investors was for six or seven rate cuts, starting as early as the FOMC’s meeting on March 19-20. But with inflation remaining persistently high, investors had recently been expecting only two or three rate cuts, with the first cut occurring at the FOMC’s meeting on June 11-12. Two days ago, Neel Kashkari, president of the Federal Reserve Bank of Minneapolis raised the possibility that the FOMC might not cut its target for the federal funds rate during 2024. Some economists have even begun to speculate that the FOMC might feel obliged to increase its target in the coming months.

After the FOMC’s next meeting on April 30-May 1 first, Chair Powell may provide some additional information on the committee’s current thinking.

Another Surprisingly Strong Employment Report

Photo from Reuters via the Wall Street Journal.

On Friday, April 5—the first Friday of the month—the Bureau of labor Statistics (BLS) released its “Employment Situation” report with data on the state of the labor market in March. The BLS reported a net increase in employment during March of 303,000, which was well above the increase that economists had been expecting. The previous estimates of employment in January and February were revised upward by 22,000 jobs. (We also discuss the employment report in this podcast.)

Employment increases during the second half of 2023 had slowed compared with the first half of the year. But, as the following figure from the BLS report shows, since December 2023, employment has increased by more than 250,000 in each month. These increases are far above the estimated increases of 70,000 to 100,000 new jobs needed to keep up with population growth. (But note our later discussion of this point.)

The unemployment rate had been expected to stay steady at 3.9 percent, but declined slightly to 3.8 percent. As the following figure shows, the unemployment rate has been remarkably stable for more than two years and has been below 4.0 percent each month since December 2021. The members of the Federal Open Market Committee (FOMC) expect that the unemployment rate for 2024 will be 4.0 percent, a forcast that is beginning to seem too high.

The monthly employment number most commonly reported in media accounts is from the establishment survey (sometimes referred to as the payroll survey), whereas the unemployment rate is taken from the household survey. The results of both surveys are included in the BLS’s monthly “Employment Situation” report. As we discuss in Macroeconomics, Chapter 9, Section 9.1 (Economics, Chapter 19, Section 19.1), many economists and policymakers at the Federal Reserve believe that employment data from the establishment survey provides a more accurate indicator of the state of the labor market than do either the employment data or the unemployment data from the household survey.

As we noted in a previous post, whereas employment as measured by the establishment survey has been increasing each month, employment as measured by the household surve declined each month from December 2023 through February 2024. But, as the following figure shows, this trend was reversed in March, with employment as measured by the household survey increasing 498,000—far more than the 303,000 increase in employment in establishment survey. This reversal may be another indication of the underlying strength of the labor market.

As the following figure shows, despite the substantial increases in employment, wages, as measured by the percentage change in average hourly earnings from the same month in the previous year, have been trending down. The increase in average hourly earnings declined from 4.3 percent February in to 4.1 percent in March.

The following figure shows wage inflation calculated by compounding the current month’s rate over an entire year. (The figure above shows what is sometimes called 12-month wage inflation, whereas this figure shows 1-month wage inflation.) One-month wage inflation is much more volatile than 12-month inflation—note the very large swings in 1-month wage inflation in April and May 2020 during the business closures caused by the Covid pandemic.

Wages increased by 6.1 percent in January 2024, 2.1 percent in February, and 4.2 percent in March. So, the 1-month rate of wage inflation did show an increase in March, although it’s unclear whether the increase was a result of the strength of the labor market or reflected the greater volatility in wage inflation when calculated this way.

Some economists and policymakers are surprised that low levels of unemployment and large monthly increases in employment have not resulted in greater upward pressure on wages. One possibility is that the supply of labor has been increasing more rapidly than is indicated by census data. In a January report, the Congressional Budget Office (CBO) argued that the Census Bureau’s estimate of the population of the United States is too low by about 6 million people. This undercount is attributable, according to the CBO, largely the Census Bureau having underestimated the amount of immigration that has occurred. If the CBO is correct, then the economy may need to generate about 200,000 net new jobs each month to accommodate the growth of the labor force, rather than the 80,000 to 100,000 we mentioned earlier in this post.

Federal Reserve Chair Jerome Powell noted in a press conference following the most recent meeing of the FOMC that: “Strong job creation has been accompanied by an increase in the supply of workers, reflecting increases in participation among individuals aged 25 to 54 years and a continued strong pace of immigration.” As a result:

“what you would have is potentially kind of what you had last year, which is a bigger economy where inflationary pressures are not increasing. In fact, they were decreasing. So you can have that if you have a continued supply-side activity that we had last year with—both with supply chains and also with, with growth in the size of the labor force.”

If Powell is correct, in the coming months the U.S. economy may be able to sustain rapid increases in employment without those increases leading to an increase in the rate of inflation.

Latest PCE Report Shows Moderate, but Persistent, Inflation

McDonald’s raising the price of its burgers by 10 percent in 2023 led to a decline in sales. (Photo from mcdonalds.com)

Inflation as measured by changes in the consumer price index (CPI) receives the most attention in the media, but the Federal Reserve looks instead to inflation as measured by changes in personal consumption expenditures (PCE) price index when evaluating whether it is meeting its 2 percent inflation target. The Bureau of Economic Analysis (BEA) released PCE data for February as part of its “Personal Income and Outlays” report on March 29.  

The following figure shows PCE inflation (blue line) and core PCE inflation (red line)—which excludes energy and food prices—for the period since January 2015 with inflation measured as the change in PCE from the same month in the previous year. Measured this way, PCE inflation increased slightly from 2.4 percent in January to 2.5 percent in February. Core PCE inflation decreased slightly from 2.9 percent to 2.8 percent.

The following figure shows PCE inflation and core PCE inflation calculated by compounding the current month’s rate over an entire year. (The figure above shows what is sometimes called 12-month inflation, while this figure shows 1-month inflation.) Measured this way, both PCE inflation and core PCE inflation declined in February, but the decline only partly offset the sharp increases in December and January. Both PCE inflation—at 4.1 percent—and core PCE inflation—at 3.2 percent—remained well above the Fed’s 2 percent target. 

The following figure shows another way of gauging inflation by including the 12-month inflation rate in the PCE (the same as shown in the figure above—although note that PCE inflation is now the red line rather than the blue line), inflation as measured using only the prices of the services included in the PCE (the green line), and the trimmed mean rate of PCE inflation (the blue line). Fed Chair Jerome Powell has said that he is particularly concerned by elevated rates of inflation in services. The trimmed mean measure is compiled by economists at the Federal Reserve Bank of Dallas by dropping from the PCE the goods and services that have the highest and lowest rates of inflation. It can be thought of as another way of looking at core inflation.

In February, 12-month trimmed mean PCE inflation was 3.1 percent, a little below core inflation of 3.3 percent. Twelve-month inflation in services was 3.8 percent, a slight decrease from 3.9 percent in January. Trimmed mean and services inflation tell the same story as PCE and PCE core inflation: Inflation has decline significantly from its highs of mid-2022, but remains stubbornly above the Fed’s 2 percent target.

It seems unlikely that this month’s PCE data will have much effect on when the members of the Federal Open Market Committee will decide to lower the target for the federal funds rate.

Another Steady-as-She-Goes FOMC Meeting

Federal Reserve Chair Jerome Powell (Photo from the New York Times)

As always, economists and investors had been awaiting the outcome of today’s meeting of the Federal Reserve’s policy-making Federal Open Market Committee (FOMC) to get further insight into future monetary policy. The expectation has been that the FOMC would begin reducing its target for the federal funds rate, mostly likely beginning with its meeting on June 11-12. Financial markets were expecting that the FOMC would make three 0.25 percentage point cuts by the end of the year, reducing its target range from the current 5.25 to 5.50 percent to 4.50 to 4.75 percent.

There appears to be nothing in the committees statement (found here) or in Powell’s press conference following the meeting to warrant a change in expectations of future Fed policy. The committee’s statement noted that: “The Committee does not expect it will be appropriate to reduce the target range until it has gained greater confidence that inflation is moving sustainably toward 2 percent.” As Powell stated in his press conference, although the committee found the general trend in inflation data to be encouraging, they would have to see additional months of data that were consistent with their 2 percent inflation target before reducing their target for the federal funds rate.

As we’ve noted in earlier blog posts (here, here, and here), inflation during January and February has been somewhat higher than expected. Some economists and investors had wondered if, as a result, the committee might delay its first cut in the federal funds target range or implement only two cuts rather than three. In his press conference, Powell seemed unconcerned about the January and February data and expected that falling inflation rates of the second half of 2023 to resume.

Typically, at the FOMC’s December, March, June, and September meetings, the committee releases a “Summary of Economic Projections” (SEP), which presents median values of the committee members’ forecasts of key economic variables.

The table shows that the committee members made relatively small changes to their projections since their December meeting. Most notable was an increase in the median projection of growth in real GDP for 2024 from 1.4 percent at the December meeting to 2.1 percent at this meeting. Correspondingly, the median projection of unemployment during 2024 dropped from 4.1 percent to 4.0 percent. The key projection of the value of the federal funds rate at the end of 2024 was left unchanged at 4.6 percent. As noted earlier, that rate is consistent with three 0.25 percent cuts in the target range during the remainder of the year.

The SEP also includes a “dot plot.” Each dot in the plot represents the projection of an individual committee member. (The committee doesn’t disclose which member is associated with which dot.) Note that there are 19 dots, representing the 7 members of the Fed’s Board of Governors and the 12 presidents of the Fed’s district banks. Although only the president of the New York Fed and the presidents of 4 of the 11 district banks are voting members of the committee, all the district bank presidents attend the committee meetings and provide economic projections.

The plots on the far left of the figure represent the projections of each of the 19 members of the value of the federal funds rate at the end of 2024. These dots are bunched fairly closely around the median projection of 4.6 percent. The dots representing the projections for 2025 and 2026 are more dispersed, representing greater uncertainty among committee members about conditions in the future. The dots on the far right represent the members’ projections of the value of the federal funds rate in the long run. As Table 1 shows, the median projected value is 2.6 percent (up slightly from 2.5 percent in December), although the plot indicates that all but one member expects that the long-run rate will be 2.5 percent or higher. In other words, few members expect a return to the very low federal funds rates of the period from 2008 to 2016.

Consumer Price Inflation Comes in Somewhat Higher than Expected

Federal Reserve Chair Jerome Powell (Photo from Bloomberg News via the Wall Street Journal.)

Economists, policymakers, and Wall Street analysts have been waiting for macroeconomic data to confirm that the Federal Reserve has brought the U.S. economy in for a soft landing, with inflation arrving back at the Fed’s target of 2 percent without the economy slipping into a recession. Fed officials have been cautious about declaring that they have yet seen sufficient data to be sure that a soft landing has actually been achieved. Accordingly, they are not yet willing to begin cutting their target for the federal funds rate.

For instance, on March 6, in testifying before the Commitee on Financial Services of the U.S. House of Representatives, Fed Chair Jerome Powell stated that the Fed’s Federal Open Market Committee (FOMC) “does not expect that it will be appropriate to reduce the target range until it has gained greater confidence that inflation is moving sustainably toward 2 percent.” (Powell’s statement before his testimony can be found here.)

The BLS’s release today (March 12) of its report on the consumer price index (CPI) (found here) for February indicated that inflation was still running higher than the Fed’s target, reinforcing the cautious approach that Powell and other members of the FOMC have been taking. The increase in the CPI that includes the prices of all goods and services in the market basket—often called headline inflation—was 3.2 percent from the same month in 2023, up slightly from 3.1  In January. (We discuss how the BLS constructs the CPI in Macroeconomics, Chapter 9, Section 19.4, Economics, Chapter 19, Section 19.4, and Essentials of Economics, Chapter 3, Section 13.4.) As the following figure shows, core inflation—which excludes the prices of food and energy—was 3.8 percent, down slightly from 3.9 percent in January.

If we look at the 1-month inflation rate for headline and core inflation—that is the annual inflation rate calculated by compounding the current month’s rate over an entire year—the values are more concerning, as indicated in the following figure. Headline CPI inflation is 5.4 percent (up from 3.7 percent in January) and core CPI inflation is 4.4 percent (although that is down from 4.8 percent in January). The Fed’s inflation target is measured using the personal consumption expenditures (PCE) price index, not the CPI. But CPI inflation at these levels is not consistent with PCE inflation of only 2 percent.

Even more concerning is the path of inflation in the prices of services. As we’ve noted in earlier posts, Chair Powell has emphasized that as supply chain problems have gradually been resolved, inflation in the prices of goods has been rapidly declining. But inflaion in services hasn’t declined nearly as much. Last summer he stated the point this way:

“Part of the reason for the modest decline of nonhousing services inflation so far is that many of these services were less affected by global supply chain bottlenecks and are generally thought to be less interest sensitive than other sectors such as housing or durable goods. Production of these services is also relatively labor intensive, and the labor market remains tight. Given the size of this sector, some further progress here will be essential to restoring price stability.”

The following figure shows the 1-month inflation rate in services prices and in services prices not included including housing rent. Some economists believe that the rent component of the CPI isn’t well measured and can be volatile, so it’s worthwhile to look at inflation in service prices not including rent. The figure shows that inflation in all service prices has been above 4 percent in every month since July 2023. Although inflation in service prices declined from January, it was still a very high 5.8 percent in February. Inflation in service prices not including housing rent was even higher at 7.5 percent. Such large increases in the prices of services, if they were to continue, wouldn’t be consistent with the Fed meeting its 2 percent inflation target.

Finally, some economists and policymakers look at median inflation to gain insight into the underlying trend in the inflation rate. If we listed the inflation rate in each individual good or service in the CPI, median inflation is the inflation rate of the good or service that is in the middle of the list—that is, the inflation rate in the price of the good or service that has an equal number of higher and lower inflation rates. As the following figure shows, although median inflation declined in February, it was still high at 4.6 percent and, although median inflation is volatile, the trend has been generally upward since July 2023.

The data in this month’s BLS report on the CPI reinforces the view that the FOMC will not move to cut its target for the federal funds rate in the meeting next week and makes it somewhat less likely that the committee will cut its target at the following meeting on April 30-May 1.

The Latest Employment Report: How Can Total Employment and the Unemployment Rate Both Increase?

Photo courtesy of Lena Buonanno.

On the first Friday of each month, the Bureau of Labor Statistics (BLS) releases its “Employment Sitution” report for the previous month. The data for February in today’s report at first glance seem contradictory: The BLS reported that the net increase in employment in February was 275,000, which was above the increase of 200,000 that economists participating in media surveys had expected (see here and here). But the unemployment rate, which had been expected to remain constant at 3.7 percent, rose to 3.9 percent.

The apparent paradox of employment and the unemployment rate both increasing in the same month is (partly) attributable to the two numbers being from different surveys. The employment number most commonly reported in media accounts is from the establishment survey (sometimes referred to as the payroll survey), whereas the unemployment rate is taken from the household survey. The results of both surveys are included in the BLS’s monthly “Employment Situation” report. As we discuss in Macroeconomics, Chapter 9, Section 9.1 (Economics, Chapter 19, Section 19.1), many economists and policymakers at the Federal Reserve believe that employment data from the establishment survey provides a more accurate indicator of the state of the labor market than do either the employment data or the unemployment data from the household survey. Accordingly, most media accounts interpreted the data released today as indicating continuing strength in the labor market.

However, it can be worth looking more closely at the differences between the measures of employment in the two series because it’s possible that the household survey data is signalling that the labor market is weaker than it appears from the establishment survey data. The following table shows the data on employment from the two surveys for January and February.

Establishment SurveyHousehold Survey
January157,533,000161,152,000
February157,808,000160,968,000
Change+275,000-184,000

Note that in addition to the fact that employment as measured by the household survey is falling, while employment as measured by the establishment survey is increasing, household survey employment is significantly higher in both months. Household survey employment is always higher than establishment survey employment because the household survey includes employment of three groups that are not included in the establishment survey:

  1. Self-employed workers
  2. Unpaid family workers
  3. Agricultural workers

(A more complete discuss of the differences in employment in the two surveys can be found here.) The BLS also publishes a useful data series in which it attempts to adjust the household survey data to more closely mirror the establishment survey data by, among other adjustments, removing from the household survey categories of workers who aren’t included in the payroll survey. The following figure shows three series—the establishment series (gray line), the reported household series (orange line), and the adjusted household series (blue line)—for the months since 2021. For ease of comparison the three series have been converted to index numbers with January 2021 set equal to 100. 

Note that for most of this period, the adjusted household survey series tracks the establishment survey series fairly closely. But in November 2023, both household survey measures of employment begin to fall, while the establishment survey measure of employment continues to increase. Falling employment in the household survey may be signalling weakness in the labor market that employment in the establishment survey may be missing, but it might also be attributed to the greater noisiness in the household survey’s employment data.

There are three other things to note in this month’s employment report. First, the BLS revised the initially reported increase in December establishement survey employment downward by 35,000 jobs and the January increase downward by 124,000 jobs. The January adjustment was large—amounting to more than 35 percent of the initially reported increase of 353,000. It’s normal for the BLS to revise its initial estimates of employment from the establishment survey but a series of negative revisions is typical of periods just before or at the beginning of a recession. It’s important to note, though, that several months of negative revisions to establishment employment are far from an infallible predictor of recessions.

Second, as shown in the following figure, the increase in average hourly earnings slowed from the high rate of 6.8 percent in January to 1.7 percent in February—the smallest increase since early 2022.. (These increases are measured at a compounded annual rate, which is the rate wages would increase if they increased at that month’s rate for an entire year.) A slowing in wage growth may be another sign that the labor market is weakening, although the data are noisy on a month-to-month basis.

Finally, one positive indicator of the state of the labor market is that average weekly hours worked increased. As shown in the following figure, average hours worked had been slowly, if irregularly, trending downward since early 2021. In February, average hours worked increased slightly to 34.3 hours per week from 34.2 hours per week in January. But, again, it’s difficult to draw strong conclusions from one month’s data.

In testifying before Congress earlier this week, Fed Chair Jerome Powell noted that:

“We believe that our policy rate [the federal funds rate] is likely at its peak for this tightening cycle. If the economy evolves broadly as expected, it will likely be appropriate to begin dialing back policy restraint at some point this year. But the economic outlook is uncertain, and ongoing progress toward our 2 percent inflation objective is not assured.”

It seems unlikely that today’s employment report will change how Powell and the other memebers of the Fed’s Federal Open Market Committee evaluate the current economic situation.

Surprisingly Strong CPI Report

Photo courtesy of Lena Buonanno.

As we’ve discussed in several blog posts (for instance, here and here), recent macro data have been consistent with the Federal Reserve being close to achieving a soft landing. The Fed’s increases in its target for the federal funds rate have slowed the growth of aggregate demand sufficiently to bring inflation closer to the Fed’s 2 percent target, but haven’t, to this point, slowed the growth of aggregate demand so much that the U.S. economy has been pushed into a recession.

By January 2024, many investors in financial markets and some economists were expecting that at its meeting on March 19-20, the Fed’s Federal Open Market Committee would be cutting its target for the federal funds. However, members of the committee—notably, Chair Jerome Powell—have been cautious about assuming prematurely that inflation had, in fact, been brought under control. In fact, in his press conference on January 31, following the committee’s most recent meeting, Powell made clear that the committee was unlikely to reduce its target for the federal funds rate at its March meeting. Powell noted that “inflation is still too high, ongoing progress in bringing it down is not assured, and the path forward is uncertain.”

Powell’s caution seemed justified when, on February 2, the Bureau of Labor Statistics (BLS) released its most recent “Employment Situation Report” (discussed in this post). The report’s data on growth in employment and growth in wages, as measured by the change in average hourly earnings, might be indicating that aggregate demand is growing too rapidly for inflation to continue to decline.

The BLS’s release today (February 13) of its report on the consumer price index (CPI) (found here) for January provided additional evidence that the Fed may not yet have put inflation on a firm path back to its 2 percent target. The average forecast of economists surveyed before the release of the report was that the increase in the version of the CPI that includes the prices of all goods and services in the market basket—often called headline inflation—would be 2.9 percent. (We discuss how the BLS constructs the CPI in Macroeconomics, Chapter 9, Section 19.4, Economics, Chapter 19, Section 19.4, and Essentials of Economics, Chapter 3, Section 13.4.) As the following figure shows, headline inflation for January was higher than expected at 3.1 percent (measured by the percentage change from the same month in the previous year), while core inflation—which excludes the prices of food and energy—was 3.9 percent. Headline inflation was lower than in December 2023, while core inflation was almost unchanged.

Although the values for January might seem consistent with a gradual decline in inflation, that conclusion may be misleading. Headline inflation in January 2023 had been surprisingly high at 6.4 percent. Hence, the comparision between the value of the CPI in January 2024 with the value in January 2023 may be making the annual CPI inflation rate seem artificially low. If we look at the 1-month inflation rate for headline and core inflation—that is the annual inflation rate calculated by compounding the current month’s rate over an entire year—the values are more concerning, as indicated in the following figure. Headline CPI inflation is 3.7 percent and core CPI inflation is 4.8 percent.

Even more concerning is the path of inflation in the prices of services. Chair Powell has emphasized that as supply chain problems have gradually been resolved, inflation in the prices of goods has been rapidly declining. But inflaion in services hasn’t declined nearly as much. Last summer he stated the point this way:

“Part of the reason for the modest decline of nonhousing services inflation so far is that many of these services were less affected by global supply chain bottlenecks and are generally thought to be less interest sensitive than other sectors such as housing or durable goods. Production of these services is also relatively labor intensive, and the labor market remains tight. Given the size of this sector, some further progress here will be essential to restoring price stability.”

The following figure shows the 1-month inflation rate in services prices. The figure shows that inflation in services has been above 4 percent in every month since July 2023. Inflation in services was a very high 8.7 percent in January. Clearly such large increases in the prices of services aren’t consistent with the Fed meeting its 2 percent inflation target.

How should we interpret the latest CPI report? First, it’s worth bearing in mind that a single month’s report shouldn’t be relied on too heavily. There can be a lot of volatility in the data month-to-month. For instance, inflation in the prices of services jumped from 4.7 percent in December to 8.7 percent in January. It seems unlikely that inflation in the prices of services will continue to be over 8 percent.

Second, housing prices are a large component of service prices and housing prices can be difficult to measure accurately. Notably, the BLS includes in its measure the implicit rental price that someone who owns his or her own home pays. The BLS calculates that implict rental price by asking consumers who own their own homes the following question: “If someone were to rent your home today, how much do you think it would rent for monthly, unfurnished and without utilities?” (The BLS discusses how it measures the price of housing services here.) In practice, it may be difficult for consumers to accurately answer the question if very few houses similar to theirs are currently for rent in their neighborhood.

Third, the Fed uses the personal consumption expenditures (PCE) price index, not the CPI, to gauge whether it is achieving its 2 percent inflation target. The Bureau of Economic Analysis (BEA) includes the prices of more goods and services in the PCE than the BLS includes in the CPI and measures housing services using a different approach than that used by the BLS. Although inflation as measured by changes in the CPI and as measured by changes in the PCE move roughly together over long periods, the two measures can differ significantly over a period of a few months. The difference between the two inflation measures is another reason not to rely too heavily on a single month’s CPI data.

Despite these points, investors on Wall Street clearly interpreted the CPI report as bad news. Investors have been expecting that the Fed will soon cut its target for the federal funds rate, which should lead to declines in other key interest rates. If inflation continues to run well above the Fed’s 2 percent target, it seems likely that the Fed will keep its federal funds target at its current level for longer, thereby slowing the growth of aggregate demand and raising the risk of a recession later this year. Accordingly, the Dow Jones Industrial Average declined by more than 500 points today (February 13) and the interest rate on the 10-year Treasury note rose above 4.3 percent.

The FOMC has more than a month before its next meeting to consider the implications of the latest CPI report and the additional macro data that will be released in the meantime.

Surprisingly Strong Jobs Report

Photo courtesy of Lena Buonanno.

This morning of Friday, February 2, the Bureau of Labor Statistics (BLS) issued its “Employment Situation Report” for January 2024.  Economists and policymakers—notably including the members of the Fed’s Federal Open Market Committee (FOMC)—typically focus on the change in total nonfarm payroll employment as recorded in the establishment, or payroll, survey. That number gives what is generally considered to be the best gauge of the current state of the labor market.

Economists surveyed in the past few days by business news outlets had expected that growth in payroll employment would slow to an increase of between 180,000 and 190,000 from the increase in December, which the BLS had an initially estimated as 216,00. (For examples of employment forecasts, see here and here.) Instead, the report indicated that net employment had increased by 353,000—nearly twice the expected amount. (The full report can be found here.)

In this previous blog post on the December employment report, we noted that although the net increase in employment in that month was still well above the increase of 70,000 to 100,000 new jobs needed to keep up with population growth, employment increases had slowed significantly in the second half of 2023 when compared with the first.

That slowing trend in employment growth did not persist in the latest monthly report. In addition, to the strong January increase of 353,000 jobs, the November 2023 estimate was revised upward from 173,000 jobs to 182,000 jobs, and the December estimate was substantially revised from 216,000 to 333,000. As the following figure from the report shows, the net increase in jobs now appears to have trended upward during the last three months of 2023.

Economists surveyed were also expecting that the unemployment rate—calculated by the BLS from data gathered in the household survey—would increase slightly to 3.8 percent. Instead, it remained constant at 3.7 percent. As the following figure shows, the unemployment rate has been remarkably stable for more than two years and has been below 4.0 percent each month since December 2021. The members of the FOMC expect that the unemployment rate during 2024 will be 4.1 percent, a forcast that will be correct only if the demand for labor declines significantly over the rest of the year.

The “Employment Situation Report” also presents data on wages, as measured by average hourly earnings. The growth rate of average hourly earnings, measured as the percentage change from the same month in the previous year, had been slowly declining from March 2022 to October 2023, but has trended upward during the past few months. The growth of average hourly earnings in January 2024 was 4.5 percent, which represents a rise in firms’ labor costs that is likely too high to be consistent with the Fed succeeding in hitting its goal of 2 percent inflation. (Keep in mind, though, as we note in this blog post, changes in average hourly earnings have shortcomings as a measure of changes in the costs of labor to businesses.)

Taken together, the data in today’s “Employment Situation Report” indicate that the U.S. labor market remains very strong. One implication is that the FOMC will almost certainly not cut its target for the federal funds rate at its next meeting on March 19-20. As Fed Chair Jerome Powell noted in a statement to reporters after the FOMC earlier this week: “The Committee does not expect it will be appropriate to reduce the target range until it has gained greater confidence that inflation is moving sustainably toward 2 percent. We will continue to make our decisions meeting by meeting.” (A transcript of Powell’s press conference can be found here.) Today’s employment report indicates that conditions in the labor market may not be consistent with a further decline in price inflation.

It’s worth keeping several things in mind when interpreting today’s report.

  1. The payroll employment data and the data on average hourly earnings are subject to substantial revisions. This fact was shown in today’s report by the large upward revision in net employment creation in December, as noted earlier in this post.
  2. A related point: The data reported in this post are all seasonally adjusted, which means that the BLS has revised the raw (non-seasonally adjusted) data to take into account normal fluctuations due to seasonal factors. In particular, employment typically increases substantially during November and December in advance of the holiday season and then declines in January. The BLS attempts to take into account this pattern so that it reports data that show changes in employment during these months holding constant the normal seasonal changes. So, for instance, the raw (non-seasonally adjusted) data show a decrease in payroll employment during January of 2,635,000 as opposed to the seasonally adjusted increase of 353,000. Over time, the BLS revises these seasonal adjustment factors, thereby also revising the seasonally adjusted data. In other words, the BLS’s initial estimates of changes in payroll employment for these months at the end of one year and the beginning of the next should be treated with particular caution.
  3. The establishment survey data on average weekly hours worked show a slow decline since November 2023. Typically, a decline in hours worked is an indication of a weakening labor market rather than the strong labor market indicated by the increase in employment. But as the following figure shows, the data on average weekly hours are noisy in that the fluctuations are relatively large, as are the revisons the BLS makes to these data over time.

4. In contrast to today’s jobs report, other labor market data seem to indicate that the demand for labor is slowing. For instance, quit rates—or the number of people voluntarily leaving their jobs as a percentage of the total number of people employed—have been declining. As shown in the following figure, the quit rate peaked at 3.0 percent in November 2021 and March 2022, and has declined to 2.2 percent in December 2023—a rate lower than just before the beginning of the Covid–19 pandemic.

Similarly, as the following figure shows, the number of job openings per unemployed person has declined from a high of 2.0 in March 2022 to 1.4 in December 2023. This value is still somewhat higher than just before the beginning of the Covid–19 pandemic.

To summarize, recent data on conditions in the labor market have been somewhat mixed. The strong increases in net employment and in average hourly earnings in recent months are in contrast with declining average number of hours worked, a declining quit rate, and a falling number of job openings per unemployed person. Taken together, these data make it likely that the FOMC will be in no hurry to cut its target for the federal funds rate. As a result, long-term interest rates are also likely to remain high in the coming months. The following figure from the Wall Street Journal provides a striking illustration of the effect of today’s jobs report on the bond market, as the interest rate on the 10-year Treasury note rose above 4.0 percent for the first time in more than a month. The interest rate on the 10-year Treasury note plays an important role in the financial system, influencing interest rates on mortgages and corporate bonds.