California Deals with the Paradox of Tobacco Taxes

(Photo from Zuma Press via the Wall Street Journal.)

When state and local governments impose taxes on sales of liquor, on cigarettes and other tobacco products, or on soda and other sweetened beverages, they typically have two objectives: (1) Discourage consumption of the taxed goods, and (2) raise revenue to pay for government services.  As we discuss in Chapter 6 of Microeconomics (also Economics, Chapter 6), these objectives can be at odds with each other. The tax revenue a government receives depends on both the size of the tax and the number of units sold. Therefore, the more successful a tax is in significantly reducing, say, sales of cigarettes, the less tax revenue the government receives from the tax.

As we discuss in Chapter 6, a tax on a good shifts the supply curve for the good up by the amount of the tax. (We think it’s intuitively easier to think of a tax as shifting up a supply curve, but analytically the effect on equilibrium is the same if we illustrate the effect of the tax by shifting down the demand curve for the taxed good by the amount of the tax.)  A tax will raise the equilibrium price consumers pay and reduce the equilibrium quantity of the taxed good that they buy. For a supply curve of a given price elasticity in the relevant range of prices, how much a tax increases equilibrium  price relative to how much it decreases equilibrium quantity is determined by the price elasticity of demand. 

The following figure illustrates these points. If a city implements a tax of $0.75 per 2-liter bottle of soda, the supply curve shifts up from S1 to S2. If demand is price elastic, the equilibrium price increases from $1.75 to $2.00, while the equilibrium quantity falls from 90,000 bottles per day to 70,000. If demand is price inelastic, the equilibrium price rises by more, but the equilibrium quantity falls by less. Therefore, a more price elastic demand curve is good news for objective (1) above—soda consumption falls by more—but bad news for the amount of tax revenue the government collects. When the demand for soda is price inelastic, the government collects tax revenue of $0.75 per bottle multiplied by 80,000 bottles, or $60,000 per day. When the demand for soda is price elastic, the government collects tax revenue of $0.75 per bottle multiplied by 70,000 bottles, or only $52,500 per day.

One further point: We would expect the amount of revenue the government earns from the tax to decline over time, holding constant other variables that might affect the market for the taxed good, . This conclusion follows from the fact that demand typically becomes more price elastic over time. In other words, when a tax is first imposed (or an existing tax is increased), consumers are likely to reduce purchases of the taxed good less in the short run than in the long run. This result can a problem for governments that make a commitment to use the tax revenues for a particular purpose.

A recent article in the Los Angeles Times highlighted this last point. In 1999, California voters passed Proposition 10, which increased the tax on cigarettes by $0.50 per pack, with similar tax increases on other tobacco products. The tax revenues were dedicated to funding “First 5” state government agencies, which are focused on providing services to children 5 years old and younger.  The article notes, as the above analysis would lead us to expect, that the additional revenue the state received from the tax increase was largest in the first year and has gradually declined since as the quantity of cigarettes and other tobacco products sold has fallen. (Note that over such a long period of time, other factors in addition to the effects of the tax have contributed to the decline in smoking in California.) As a result, the state and county governments have had to scramble to find additional sources of funds for the First 5 agencies. The article quotes Deborah Daro, a researcher at the University of Chicago, as noting: “It seemed like a brilliant solution—tax the sinners who are smoking to help newborns and their parents …. But then people stopped smoking, which from a public health perspective is great, but from a funding perspective for First 5—they don’t have another funding stream.”

Think the Concept of Price Elasticity is Hard? Just Ask Bob Iger.

The Magic Kingdom in Walt Disney World in Florida. Photo by the AP via the Wall Street Journal.

Elasticity is near the top of the list of topics that students struggle with in the principles course. Some students struggle with the arithmetic of calculating elasticities, while others have difficulty understanding the basic concept. The importance and difficulty of elasticity led us to devote an entire chapter to it: Chapter 6 in both Microeconomics and Economics. (We include a briefer discussion in Chapter 7, Sections 7.5 and 7.6 in Essentials of Economics.)

When the Walt Disney Company released its 2023 second quarter earnings report on May 10, it turned out that Disney CEO Bob Iger is also a little shaky on the concept of price elasticity. During Iger’s previous time as Disney CEO he had started the Disney+ subscription streaming service. Like some other streaming services during the past year, Disney+ has struggled to earn a profit. Disney’s announcement in November 2022 that Disney+ had lost $1.47 billion during the previous quarter contributed to Bob Chapek, Iger’s predecessor as CEO, being fired by Disney’s board of directors.

For this quarter, Iger was able to announce that losses at Disney+ had been reduced to $659 million, although skepticism among investors about whether the service would turn a profit by next year as Iger indicated contributed to a sharp decline in Disney’s stock price. The smaller loss at Disney+ was largely the result of Disney having raised the price of the service in December 2022 from $7.99 per month to $10.99 per month. According to an article in the Wall Street Journal, Iger noted that the price increase had caused only a very small decline in subscribers. Iger was quoted as concluding: “That leads us to believe that we, in fact, have pricing elasticity” with respect to Disney+.

Taken literally, Iger has the concept of elasticity backwards. If “having pricing elasticity” means having price elastic demand, then Disney would have experienced a large loss of Disney+ subscribers after the price increase, not a small loss. To use the concept correctly, Iger should have said something like “we have price inelastic demand.” If we give Iger the benefit of the doubt and assume that he knows the definitions of price elastic and price inelastic, then we can interpret what he said as meaning “we have favorable price elasticity.” Favorable in this case would mean demand is price inelastic.

In any case, this episode is a good example of why many students–and CEOs!–can struggle with the concept of price elasticity.

The Many Uses of Elasticity: An Example from Law Enforcement Policy

In this chapter, we have studied several types of elasticities, starting with the price elasticity of demand. Elasticity is a general concept that economists use to measure the effect of a change in one variable on another variable. An example of a more general use of elasticity, beyond the uses we discussed in this chapter, appears in a new academic paper written by Anne Sofie Tegner Anker of the University of Copenhagen, Jennifer L. Doleac of Texas A&M University, and Rasmus LandersØ of Aarshus University. 

The authors are interested in studying the effects of crime deterrence. They note that rational offenders will be deterred by government policies that increase the probability that an offender will be arrested. Even offenders who don’t respond rationally to an increase in the probability of being arrested will still commit fewer crimes because they are more likely to be arrested. Governments have different policies available to reduce crime. Given that government resources are scarce, efficient allocation of resources requires policymakers to choose policies that provide the most deterrence per dollar of cost.

The authors note “we currently know very little about precisely how much deterrence we achieve for any given increase in the likelihood that an offender is apprehended.” They attempt to increase knowledge on this point by analyzing the effects of a policy change in Denmark in 2005 that made it much more likely that an offender would have his or her DNA entered into a DNA database: “The goal of DNA registration is to deter offenders and increase the likelihood of detection of future crimes by enabling matches of known offenders with DNA from crime scene evidence.”

The authors find that the expansion of Denmark’s DNA database had a substantial effect on recidivism—an offender committing additional crimes—and on the probability that an offender who did commit additional crimes would be caught. They estimate that “a 1 percent higher detection probability reduces crime by more than 2 percent.” In other words, the elasticity of crime with respect to the detection probability is −2.

Just as the price elasticity of demand gives a business manager a useful way to summarize the responsiveness of the quantity demanded of the firm’s product to a change in its price, the elasticity the authors estimated gives a policymaker a useful way to summarize the responsiveness of crime to a policy that increases the probability of catching offenders.  

Source: Anne Sofie Tegner Anker, Jennifer L. Doleac, and Rasmus LandersØ, “The Effects of DNA Databases on the Deterrence and Detection of Offenders,” American Economic Journal: Applied Economics, Vol. 13, No. 4, October 2021, pp. 194-225. 

Is Bitcoin the New Gold?

As we discuss in the chapter, initially, bitcoin was thought of as a way to buy and sell goods and services. Some stores accepted bitcoin and allowed customers to make payment by scanning a bar code with a phone. Some websites offered merchants a way to process purchases made with bitcoins in a manner similar to the way merchants process credit card payments.

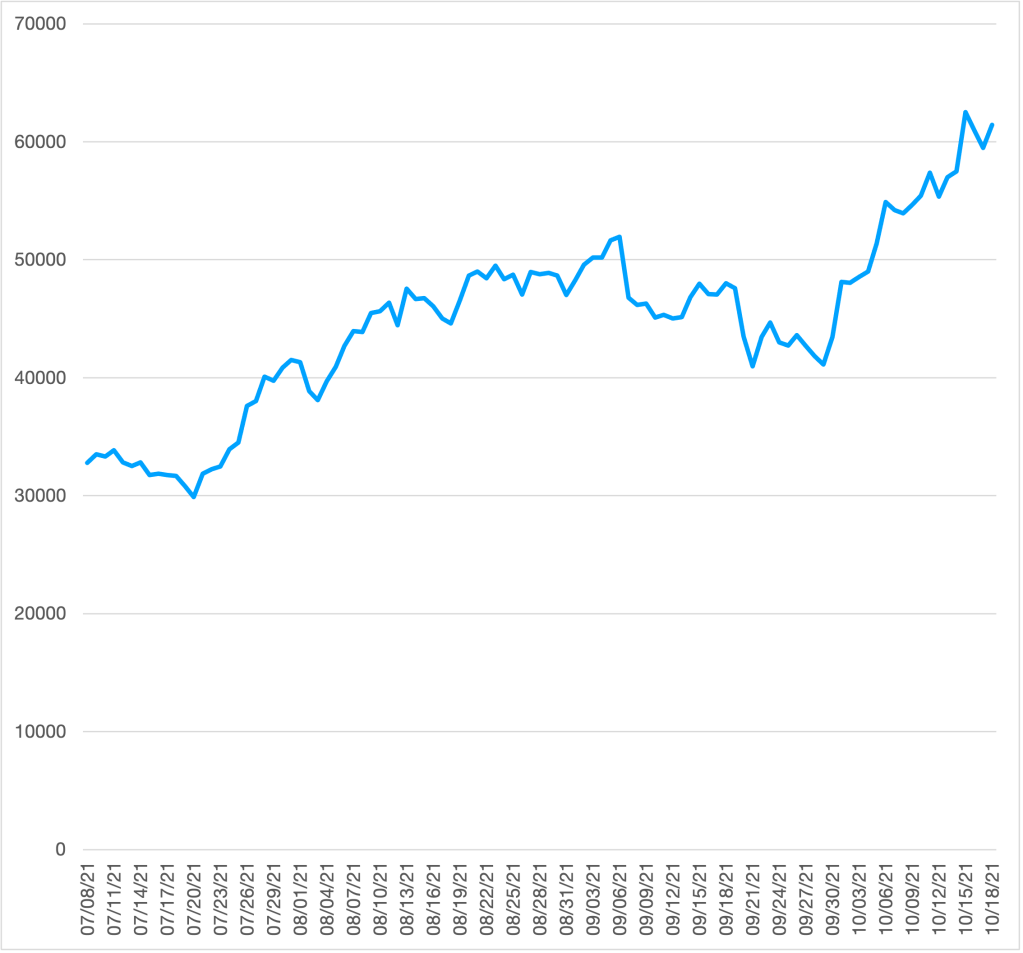
In practice, though, swings in the value of bitcoin have been much too large to make it a good substitute for cash, checks, or credit cards in everyday transactions. For instance, at the beginning of 2015, one bitcoin was worth about $300. Over the following five years, the price of bitcoin rose as high at $17,000 before falling to about $8,000 at the beginning of 2020. During 2021, the volatility of bitcoin prices increased, rising as high as $62,000 in April and falling as low as $30,000 in July before rising back above $60,000 in October. (The following chart shows movements in the price of bitcoin from early July to mid-October 2021; the vertical axis shows the price as dollars per bitcoin.)

Some economists have suggested that rather being a medium of exchange, like dollar bills, bitcoin has become a speculative asset, like gold. Bitcoin shares with gold the characteristic that ultimately its total supplied is limited. The supply of Bitcoin can’t increase beyond 21 million, a limit that is expected to be reached in 2030. The gold stock slowly increases as mines produce more gold, although the output of mines is small compared with the existing stock of gold. Some investors and speculators are reassured that, in contrast to the assets in M1 and M2 that can increase as much as the Fed chooses, gold and bitcoin have limits on how much they can increase.

Will Bitcoin Be a Good Hedge Against Inflation? Can It Be Useful in Diversifying a Portfolio?

Some investors and speculators believe that the limited quantities of gold and bitcoin available make them good hedges against inflation—that is, they believe that the prices of gold and bitcoin will reliably increase during periods of inflation.  In fact, though, gold has proven to be a poor hedge against inflation because in the long run the price of gold has not reliably increased faster than the inflation rate. There is no good economic reason to expect that over the long run bitcoin would be a good inflation hedge either.

From a broader perspective than as just an inflation hedge, some economists argue that gold has a role to play in an investor’s portfolio—which is the collection of assets, such as stocks and bonds, that an investor owns. Investors can reduce the financial risk they face through diversification, or spreading their wealth among different assets. For instance, an investor who only holds Apple stock in her portfolio is subject to more risk than an investor with the same dollar amount invested in a portfolio that holds the stocks of multiple firms as well as non-stock investments. An investor obtains the benefits of diversification best by adding assets to her portfolio that are not well correlated with the assets she already owns—that is the prices of the assets she adds to her portfolio don’t typically move in the same direction as the prices of the assets she already owns.

For instance, during a typical recession sales of consumer staples, like baby diapers and laundry detergent, hold up well, while sales of consumers durables, like automobiles, usually decline significantly. So adding shares of stock in Proctor & Gamble to a portfolio that already has many shares of General Motors achieves diversification and reduces financial risk because movements in the price of shares of Proctor & Gamble are likely not to be highly correlated with movements in the price of shares of General Motors.

Studies have shown that during some periods movements in gold prices are not correlated with movements in prices of stocks or bonds. In other words, gold prices may rise during a period when stock prices are declining. As a result, an investor may want to add gold to her portfolio to diversify it. To this point, bitcoin hasn’t been around long enough to draw firm conclusions about whether adding bitcoin to a portfolio provides significant diversification, although some investors believes that it does. 

Finance professionals are divided in their opinions on whether bitcoin is a good substitute for gold in a financial portfolio. In an interview, billionaire investor Ray Dalio, founder of Bridgewater Associates, the world’s hedge fund, noted that while he believes that bitcoin may serve as a hedge against inflation, but if he could only hold gold or bitcoin, “I would choose gold.” His preference for gold is due in part to his belief that the federal government may increase regulation of bitcoin and that regulators might eventually even decide to ban it. A businessinsider.com survey of 10 financial experts found them divided with five preferring gold as an investment and five preferring bitcoin.

Sources: Jade Scipioni, “Bitcoin vs. Gold: Here’s What Billionaire Ray Dalio Thinks,” cnbc.com, August 4, 2021; and Isabelle Lee and Will Daniel, “Bitcoin vs. Gold: 10 Experts Told Us Which Asset They’d Rather Hold for the Next 10 Years, and Why,” businessinsider.com, February 20, 2021.

10/17/21 Podcast – Authors Glenn Hubbard & Tony O’Brien discuss economic impact of infrastructure spending & the supply-chain challenges.

Authors Glenn Hubbard and Tony O’Brien discuss the economic impact of the recent infrastructure bill and what role fiscal policy plays in determining shovel-ready projects. Also, they explore the vast impact of the economy-wide supply-chain issues and the challenges companies face. Until the pandemic, we had a very efficient supply chain but now we’re seeing companies employ the “just-in-case” inventory method vs. “just-in-time”!

Some links referenced in the podcast:

Here’s Alan Cole’s blog: https://fullstackeconomics.com/how-i-reluctantly-became-an-inflation-crank/

Neil Irwin wrote a column referencing Cole here:  https://www.nytimes.com/2021/10/10/upshot/shadow-inflation-analysis.html

Here’s a Times article on the inefficiency of subway construction in NYC:  https://www.nytimes.com/2017/12/28/nyregion/new-york-subway-construction-costs.html

A recent article on the state of CA’s bullet train:  https://www.kcra.com/article/california-bullet-trains-latest-woe-high-speed/37954851

A WSJ column on goods v. services: https://www.wsj.com/articles/at-times-like-these-inflation-isnt-all-bad-11634290202

The College Majors of U.S. Billionaires

Jim McKelvey, cofounder of Square and undergraduate economics major

Each year, Forbes magazine compiles a list of the 400 richest people in the United States. A recent article in Forbes reports on the college majors of these billionaires. Forbes was able to find that information for 357 of the 400. Perhaps unsurprisingly, 65 chose business, making it the most popular undergraduate major.  

Economics was the second most popular major, with 58 having chosen it, followed closely by engineering with 55. There is a substantial drop to the next most popular major—politics and government—with 22 of the 400 billionaires having chosen it. Given that we often associate billion dollar fortunes with the founders of tech companies, it may be surprising that only 17 of the 400 majored in computer science. Included among them, though, is Jeff Bezos, who majored in computer science and engineering at Princeton and who holds first place on the Forbes list of the wealthiest Americans. 

The article quotes Jim McKelvey, cofounder of credit card processor Square, as observing about economics: “There are a few basic concepts in economics that help in business. Micro and especially game theory are helpful to predict customer behavior. And macro has been super helpful ever since I joined the board of the Federal Reserve.” McKelvey currently serves as deputy chair of the board of directors of the Federal Reserve Bank of St. Louis.

Source: Matt Durot, “Want to Be a Billionaire? These Are the Most Popular Majors of the Richest Americans,” forbes.com, October 8, 2021. LINK

Coming Attractions: Hubbard and O’Brien Principles of Economics Updated

It’s customary for textbook authors to note that “much has happened in the economy” since the last edition of their book appeared. To say that much has happened since we prepared our last edition in 2019 would be a major understatement. Never in the lifetimes of today’s students and instructors have events like those of 2020 and 2021 occurred. The U.S. and world economies had experienced nothing like the Covid-19 pandemic since the influenza pandemic of 1918. In the spring of 2020, the U.S. economy suffered an unprecedented decline in the supply of goods and services as a majority of businesses in the country shut down to reduce spread of the virus. Many businesses remained closed or operated at greatly reduced capacity well into 2021. Most schools, including most colleges, switched to remote learning, which disrupted the lives of many students and their parents.

During the worst of the pandemic, total spending in the economy declined as the unemployment rate soared to levels not seen since the Great Depression of the 1930s. Reduced spending and closed businesses resulted in by far the largest decline in total production in such a short period in the history of the U.S. economy. Congress, the Trump and Biden administrations, and the Federal Reserve responded with fiscal and monetary policies that were also unprecedented.

Our updated Eighth Edition covers all of these developments as well as the policy debates they initiated. As with previous editions, we rely on extensive digital resources, including: author-created application videos and audio recordings of the chapter openers and Apply the Concept features; figure animation videos; interactive real-time data graphs animations; and Solved Problem whiteboard videos.

Glenn and Tony discuss the updated edition in this video:

Sample chapters will be available by October 15.

The full Macroeconomics text will available in early to mid December.

The full Microeconomics text will be available in mid to late December.

If you would like to view the sample chapters or are considering adopting the updated Eighth Edition for the spring semester, please contact your local Pearson representative. You can use this LINK to find and contact your representative.