

Tony and Glenn signing copies of the first edition of the principles text at an ASSA meeting. (Thanks to Lena Buonanno for providing the image of the caricature.)
Tony and Glenn signing copies of the first edition of the principles text at an ASSA meeting. (Thanks to Lena Buonanno for providing the image of the caricature.)

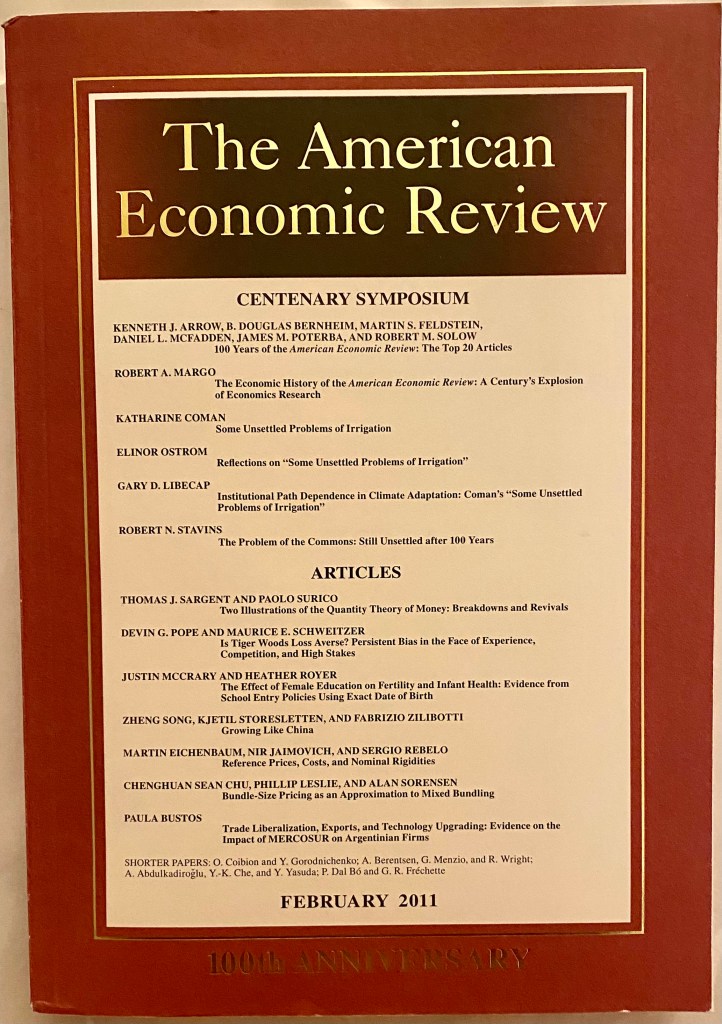
An issue of the American Economic Review celebrating the 100th anniversary of the journal in 2011.
The American Economic Association (AEA) was founded in 1885 and is the leading organization of business and academic economists in the United States. It first began publishing the American Economic Review (AER) in 1911. The AER remains the leading academic economic journal in the United States. Like most other academic journals, in recent years the AER has been available in both digital format and in paper copies mailed to subscribers. In January 2024, the AEA announced that the paper version of the journal will soon end:
“The AEA will phase out print journals over the next year by no longer offering print subscriptions for members and institutional subscribers as of February 1. Existing print subscriptions for members and institutions will be honored through January 2025 but will be unable to be renewed.”
The transition of the AER from a paper-only to a digital-only format has been a long one, strecthing over three decades. The tranisition began in the 1990s when the development of the internet made electronic publishing feasible. An important step in making academic journals available electronically was the establishment by William Bowen of the Mellon Foundation of JSTOR in 1994. JSTOR was intended to make electronic versions of back issues of academic journals available inexpensively to libraries and other institutions.
Typically, at the end of a year, libraries would send the issues of academic journals published during that year to be bound into volumes. The libraries would then put the volumes on library shelves making them available to faculty, students, and researchers. University libraries that subscribed to large numbers of academic journals found that over time they were devoting more and more space to shelving bound volumes of academic journals. Many libraries began storing the volumes off site in warehouses, making the volumes less accessible to faculty and students. JSTOR made it possible for libraries to store back issues of journals electronically rather than physically. Many academic societies, like the AEA, were happy to allow JSTOR to make electronic copies of the back issues of their journals. Although academic societies often fund their activities in part from subscriptions to their journals, the societies earned little or no revenue from back issues of their journals.
During the 1990s, the AEA and other academic societies began to make current issues of some journals available on CD-ROMs as more factulty began to use personal computers that had those drives available. Many faculty—including Glenn and Tony!—found the CD-ROM versions of journal issues a little awkward and time consuming to use. CD-Roms never became an important way of distributing journal issues to subscribers. (This article published in 1997 by Hal Varian, who was then at the University of California, Berkeley and is now the chief economist at Google, provides an interesting discuss of the AEA’s first steps toward transitioning its journals to electronic formats.)
By the 2000s, the AEA was offering subscribers to the AER the choice of electronic-only subscriptions—with issues available for download on the AEA’s website—or electronic access along with print copies at a higher annual price. This model was one widely used by non-academic magazines and newspapers. As the number of subscribers receiving print copies of the AER dwindled, the leadership of the AEA eventually decided to eliminate print copies, as indicated in the announcement quoted at the beginning of this post.
For better or worse, in most fields, print copies of academic journals seem to be well on their way to extinction.

Photo courtesy of Lena Buonanno.
During the last few months of 2023, the macroeconomic data has generally been consistent with the Federal Reserve successfully bringing about a soft landing: Inflation returning to the Fed’s 2 percent target without the economy entering a recession. On the morning of Friday, January 5, the Bureau of Labor Statistics (BLS) issued its latest “Employment Situation Report” for December 2023. The report was generally consistent with the economy still being on course for a soft landing, but because both employment growth and wage growth were stronger than expected, the report makes it somewhat less likely that the Federal Reserve’s Federal Open Market Committee (FOMC) will soon begin reducing its target for the federal funds rate. (The full report can be found here.)
Economists and policymakers—notably including the members of the FOMC—typically focus on the change in total nonfarm payroll employment as recorded in the establishment, or payroll, survey. That number gives what is generally considered to be the best gauge of the current state of the labor market.
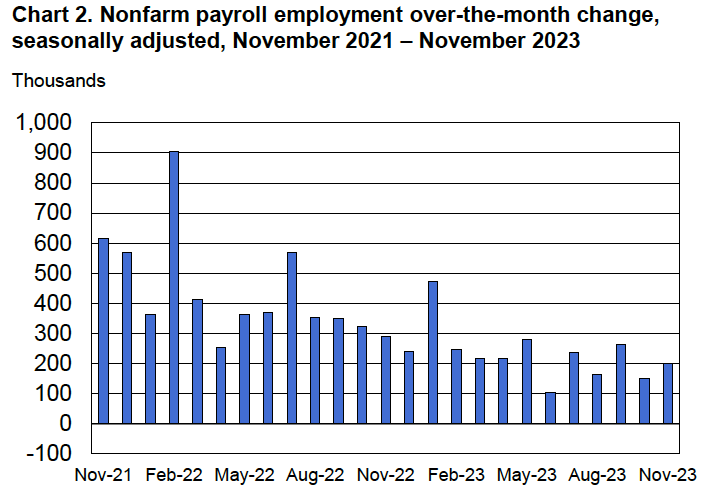
The report indicated that during December there had been a net increase of 216,000 jobs. This number was well above the expected gain of 160,000 to 170,000 jobs that several surveys of economists had forecast (see here, here, and here). The BLS revised downward by a total of 71,000 jobs its previous estimates for October and November, somewhat offsetting the surprisingly strong estimated increase in net jobs for December.
The following figure from the report shows the net increase in jobs each month since December 2021. Although the net number of jobs created has trended up from September to December, the longer run trend has been toward slower growth in employment. In the first half of 2023, an average of 257,000 net jobs were created per month, whereas in the second half of 2023, an average of 193,000 net jobs were created per month. Average weekly hours worked have also been slowly trending down, from 34.6 hours per week in January to 34.3 hours per week in December.

Economists surveyed were also expecting that the unemployment rate—calculated by the BLS from data gathered in the household survey—would increase slightly. Instead, it remained constant at 3.7 percent. As the following figure shows, the unemployment rate has been below 4.0 percent each month since December 2021. The members of the FOMC expect that the unemployment rate during 2024 will be 4.1 percent. (The most recent economic projections of the members of the FOMC can be found here.)

Although the employment data indicate that conditions in the labor market are easing in a way that may be consistent with inflation returning to the Fed’s 2 percent target, the data on wage growth are so far sending a different message. Average hourly earnings—data on which are collected in the establishment survey—increased by 4.1 percent in December compared with the same month in 2022. This rate of increase was slightly higher than the 4.0 percent increase in November. The following figure shows movements in the rate of increase in average hourly earnings since January 2021.
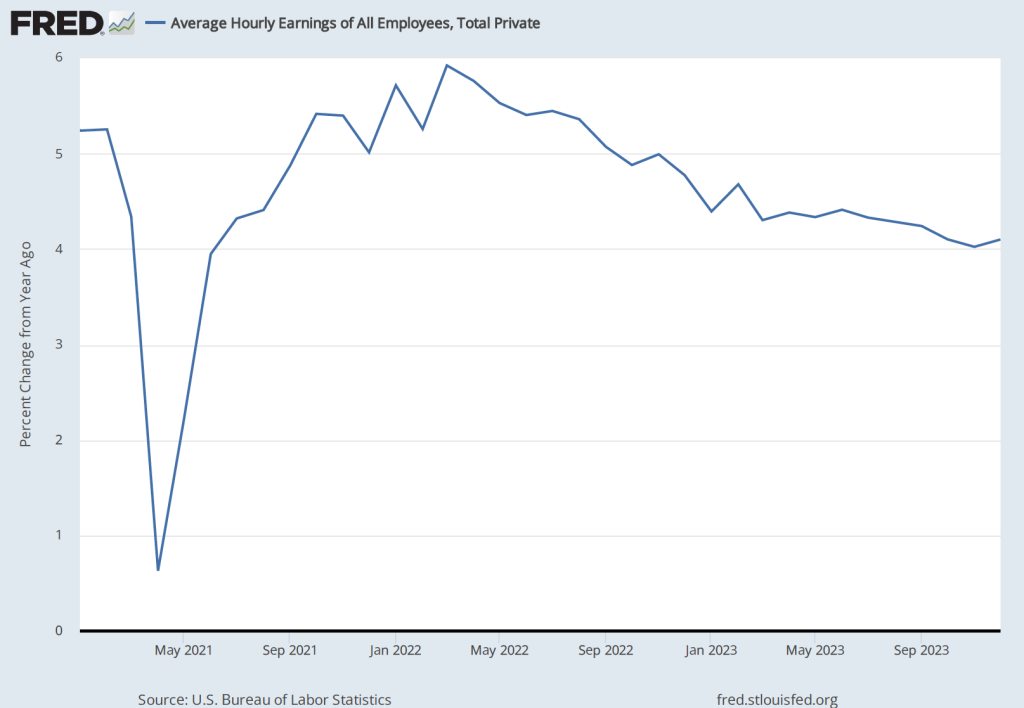
In his press conference following the FOMC’s December 13, 2023 meeting, Fed Chair Jerome Powell noted that increases in wages at 4 percent or higher were unlikely to result in inflation declining to the Fed’s 2 percent goal:
“So wages are still running a bit above what would be consistent with 2 percent inflation over a long period of time. They’ve been gradually cooling off. But if wages are running around 4 percent, that’s still a bit above, I would say.”
The FOMC’s next meeting is on January 30-31. At this point it seems likely that the committee will maintain its current target for the federal funds. The data in the latest employment report make it somewhat less likely that the committee will begin reducing its target at its meeting on March 19-20, as some economists and some Wall Street analysts had been expecting. (The calendar of the FOMC’s 2024 meetings can be found here.)

Photo courtesy of Lena Buonanno.
In recent months, the macroeconomic data has generally been consistent with the Federal Reserve successfully bringing about a soft landing: Inflation returning to the Fed’s 2 percent target without the economy entering a recession. The Bureau of Labor Statistics’ latest Employment Situation Report, released on the morning of Friday, December 8, was consistent with this trend. (The full report can be found here.)
Economists and policymakers—notably including the members of the Federal Reserve’s Federal Open Market Committee (FOMC)—typically focus on the change in total nonfarm payroll employment as recorded in the establishment, or payroll, survey. That number gives what is generally considered to be the best gauge of the current state of the labor market.
The report indicated that during November there had been a net increase of 199,000 jobs. This number was somewhat above the expected gain of 153,000 jobs Reuters news service reported from its survey of economists and just slightly above an expected gain of 190,000 jobs the Wall Street Journal reported from a separate survey of economists. The BLS revised downward by 35,000 jobs its previous estimate for September. It left its estimate for October unchanged. The following figure from the report shows the net increase in jobs each month since November 2021.
Because the BLS often substantially revises its preliminary estimates of employment from the establishment survey, it’s important not to overinterpret data for a single month or even for a few months. But general trends in the data can give useful information on changes in the state of the labor market. The estimate for November is the fourth time in the past six months that employment has increased by less than 200,000. Prior to that, employment had increased by more than 200,000 every month since January 2021.
Although the rate of job increases is slowing, it’s still above the rate at which new entrants enter the labor market, which is estimated to be roughly 90,000 people per month. The additional jobs are being filled in part by increased employment among people aged 25 to 54—so-called prime-age workers. (We discuss the employment-population ratio in Macroeconomics, Chapter 9, Section 9.1, Economics, Chapter 19, Section 9.1, and Essentials of Economics, Chapter 13, Section 13.1.) As the following figure shows, the employment-population ratio for prime-age workers remains above its level in early 2020, just before the spread of the Covid–19 pandemic in the United States.

The estimated unemployment rate, which is collected in the household survey, was down slightly from 3.9 percent to 3.7 percent. A shown in the following figure, the unemployment rate has been below 4 percent every month since February 2022.

The Employment Situation Report also presents data on wages, as measured by average hourly earnings. The growth rate of average hourly earnings, measured as the percentage change from the same month in the previous year, continued its gradual decline, as shown in the following figure. As a result, upward pressure on prices from rising labor costs is easing. (Keep in mind, though, as we note in this blog post, changes in average hourly earnings have shortcomings as a measure of changes in the costs of labor to businesses.)

Taken together, the data in the latest employment report indicate that the labor market is becoming less tight, reflecting a gradual slowing in U.S. economic growth. The data are consistent with the U.S. economy approaching a soft landing. It’s still worth bearing in mind, of course, that, as Fed Chair Jerome Powell continues to caution, there’s no certainty that inflation won’t surge again or that the U.S. economy won’t enter a recession.

(Photo from Zuma Press via the Wall Street Journal.)
When state and local governments impose taxes on sales of liquor, on cigarettes and other tobacco products, or on soda and other sweetened beverages, they typically have two objectives: (1) Discourage consumption of the taxed goods, and (2) raise revenue to pay for government services. As we discuss in Chapter 6 of Microeconomics (also Economics, Chapter 6), these objectives can be at odds with each other. The tax revenue a government receives depends on both the size of the tax and the number of units sold. Therefore, the more successful a tax is in significantly reducing, say, sales of cigarettes, the less tax revenue the government receives from the tax.
As we discuss in Chapter 6, a tax on a good shifts the supply curve for the good up by the amount of the tax. (We think it’s intuitively easier to think of a tax as shifting up a supply curve, but analytically the effect on equilibrium is the same if we illustrate the effect of the tax by shifting down the demand curve for the taxed good by the amount of the tax.) A tax will raise the equilibrium price consumers pay and reduce the equilibrium quantity of the taxed good that they buy. For a supply curve of a given price elasticity in the relevant range of prices, how much a tax increases equilibrium price relative to how much it decreases equilibrium quantity is determined by the price elasticity of demand.
The following figure illustrates these points. If a city implements a tax of $0.75 per 2-liter bottle of soda, the supply curve shifts up from S1 to S2. If demand is price elastic, the equilibrium price increases from $1.75 to $2.00, while the equilibrium quantity falls from 90,000 bottles per day to 70,000. If demand is price inelastic, the equilibrium price rises by more, but the equilibrium quantity falls by less. Therefore, a more price elastic demand curve is good news for objective (1) above—soda consumption falls by more—but bad news for the amount of tax revenue the government collects. When the demand for soda is price inelastic, the government collects tax revenue of $0.75 per bottle multiplied by 80,000 bottles, or $60,000 per day. When the demand for soda is price elastic, the government collects tax revenue of $0.75 per bottle multiplied by 70,000 bottles, or only $52,500 per day.

One further point: We would expect the amount of revenue the government earns from the tax to decline over time, holding constant other variables that might affect the market for the taxed good, . This conclusion follows from the fact that demand typically becomes more price elastic over time. In other words, when a tax is first imposed (or an existing tax is increased), consumers are likely to reduce purchases of the taxed good less in the short run than in the long run. This result can a problem for governments that make a commitment to use the tax revenues for a particular purpose.
A recent article in the Los Angeles Times highlighted this last point. In 1999, California voters passed Proposition 10, which increased the tax on cigarettes by $0.50 per pack, with similar tax increases on other tobacco products. The tax revenues were dedicated to funding “First 5” state government agencies, which are focused on providing services to children 5 years old and younger. The article notes, as the above analysis would lead us to expect, that the additional revenue the state received from the tax increase was largest in the first year and has gradually declined since as the quantity of cigarettes and other tobacco products sold has fallen. (Note that over such a long period of time, other factors in addition to the effects of the tax have contributed to the decline in smoking in California.) As a result, the state and county governments have had to scramble to find additional sources of funds for the First 5 agencies. The article quotes Deborah Daro, a researcher at the University of Chicago, as noting: “It seemed like a brilliant solution—tax the sinners who are smoking to help newborns and their parents …. But then people stopped smoking, which from a public health perspective is great, but from a funding perspective for First 5—they don’t have another funding stream.”

I’ve still got one more day, right?

The Magic Kingdom in Walt Disney World in Florida. Photo by the AP via the Wall Street Journal.
Elasticity is near the top of the list of topics that students struggle with in the principles course. Some students struggle with the arithmetic of calculating elasticities, while others have difficulty understanding the basic concept. The importance and difficulty of elasticity led us to devote an entire chapter to it: Chapter 6 in both Microeconomics and Economics. (We include a briefer discussion in Chapter 7, Sections 7.5 and 7.6 in Essentials of Economics.)
When the Walt Disney Company released its 2023 second quarter earnings report on May 10, it turned out that Disney CEO Bob Iger is also a little shaky on the concept of price elasticity. During Iger’s previous time as Disney CEO he had started the Disney+ subscription streaming service. Like some other streaming services during the past year, Disney+ has struggled to earn a profit. Disney’s announcement in November 2022 that Disney+ had lost $1.47 billion during the previous quarter contributed to Bob Chapek, Iger’s predecessor as CEO, being fired by Disney’s board of directors.
For this quarter, Iger was able to announce that losses at Disney+ had been reduced to $659 million, although skepticism among investors about whether the service would turn a profit by next year as Iger indicated contributed to a sharp decline in Disney’s stock price. The smaller loss at Disney+ was largely the result of Disney having raised the price of the service in December 2022 from $7.99 per month to $10.99 per month. According to an article in the Wall Street Journal, Iger noted that the price increase had caused only a very small decline in subscribers. Iger was quoted as concluding: “That leads us to believe that we, in fact, have pricing elasticity” with respect to Disney+.
Taken literally, Iger has the concept of elasticity backwards. If “having pricing elasticity” means having price elastic demand, then Disney would have experienced a large loss of Disney+ subscribers after the price increase, not a small loss. To use the concept correctly, Iger should have said something like “we have price inelastic demand.” If we give Iger the benefit of the doubt and assume that he knows the definitions of price elastic and price inelastic, then we can interpret what he said as meaning “we have favorable price elasticity.” Favorable in this case would mean demand is price inelastic.
In any case, this episode is a good example of why many students–and CEOs!–can struggle with the concept of price elasticity.


In this chapter, we have studied several types of elasticities, starting with the price elasticity of demand. Elasticity is a general concept that economists use to measure the effect of a change in one variable on another variable. An example of a more general use of elasticity, beyond the uses we discussed in this chapter, appears in a new academic paper written by Anne Sofie Tegner Anker of the University of Copenhagen, Jennifer L. Doleac of Texas A&M University, and Rasmus LandersØ of Aarshus University.
The authors are interested in studying the effects of crime deterrence. They note that rational offenders will be deterred by government policies that increase the probability that an offender will be arrested. Even offenders who don’t respond rationally to an increase in the probability of being arrested will still commit fewer crimes because they are more likely to be arrested. Governments have different policies available to reduce crime. Given that government resources are scarce, efficient allocation of resources requires policymakers to choose policies that provide the most deterrence per dollar of cost.
The authors note “we currently know very little about precisely how much deterrence we achieve for any given increase in the likelihood that an offender is apprehended.” They attempt to increase knowledge on this point by analyzing the effects of a policy change in Denmark in 2005 that made it much more likely that an offender would have his or her DNA entered into a DNA database: “The goal of DNA registration is to deter offenders and increase the likelihood of detection of future crimes by enabling matches of known offenders with DNA from crime scene evidence.”
The authors find that the expansion of Denmark’s DNA database had a substantial effect on recidivism—an offender committing additional crimes—and on the probability that an offender who did commit additional crimes would be caught. They estimate that “a 1 percent higher detection probability reduces crime by more than 2 percent.” In other words, the elasticity of crime with respect to the detection probability is −2.
Just as the price elasticity of demand gives a business manager a useful way to summarize the responsiveness of the quantity demanded of the firm’s product to a change in its price, the elasticity the authors estimated gives a policymaker a useful way to summarize the responsiveness of crime to a policy that increases the probability of catching offenders.
Source: Anne Sofie Tegner Anker, Jennifer L. Doleac, and Rasmus LandersØ, “The Effects of DNA Databases on the Deterrence and Detection of Offenders,” American Economic Journal: Applied Economics, Vol. 13, No. 4, October 2021, pp. 194-225.
