Counterfeit 1899 Peruvian dinero. (Image from Luis Ortega-San-Martín and Fabiola Bravo-Hualpa article.)
What counts as money is an interesting topic. For instance, in Macroeconomics, Chapter 14, Section 14.2 (Economics, Chapter 24, Section 24.2, and Essentials of Economics, Chapter 16, Section 16.2), we discuss whether bitcoin is money (spoiler alert: it isn’t).
Of the four functions of money that we discuss in Chapter 14, the most important is that money serves as a medium of exchange. Anything can be used as money if most people are willing to accept it in exchange for goods and services. In that chapter, we mention that at one time in West Africa cowrie shells were used as money. In the early years of the United States, animal skins were sometimes used as money. For instance, the first governor of Tennessee received an annual salary of 1,000 deerskins.
In a famous article in the academic journal Economica, economist Richard A. Radford who had been captured in 1942 by German troops while fighting with the British Army in North Africa described his experiences in a prisoner-of-war camp. The British prisoners in the camp developed an economy in which cigarettes were used as money:
“Everyone, including nonsmokers, was willing to sell for cigarettes, using them to buy at another time and place. Cigarettes became the normal currency .… Laundrymen advertised at two cigarettes a garment …. There was a coffee stall owner who sold tea, coffee or cocoa at two cigarettes a cup, buying his raw materials at market prices and hiring labour ….”
In Chapter 24, in end of chapter problem 1.8, we note that according to historian Peter Heather, during the time of the Roman Empire, German tribes east of the Rhine river used Roman coins as money even though Rome didn’t govern that area. Roman coins were apparently also used as money in parts of India during those years even though the nearest territory the Romans controlled was hundreds of miles to the west. Again we have an example of something—roman coins in this case—being used as money because people were willing to aceept it in exchange for goods and services even though the government that issued the coins didn’t control that area.
Even more striking case is the case of Iraqi paper currency issued by the government of Saddam Hussein. This currency continued to circulate even after Saddam’s government had collapsed following the invasion of Iraq by U.S. and British troops. U.S. officials in Iraq had expected that as soon as the war was over and Saddam had been forced from power, the currency with his picture on it would lose all its value. This result had seemed inevitable once the United States had begun paying Iraqi officials in U.S. dollars. However, for some time many Iraqis continued to use the old currency because they were familiar with it. According to an article in the Wall Street Journal, the Iraqi manager of a currency exchange put it this way: “People trust the dinar more than the dollar. It’s Iraqi.” In fact, for some weeks after the invasion, increasing demand for the dinar caused its value to rise against the dollar. Eventually, a new Iraqi government was formed, and the government ordered that dinars with Saddam’s picture be replaced by a new dinar. Again we see that anything can be used as money as long as people are willing to accept it in exchange for goods and services, even paper currency issued by a government that no longer exists.
Finally, there is the case of the coin shown at the beginning of this post. The coin looks like the dineros—small denomination silver coins—issued by the Peruvian government. But the coin is dated 1899, a year in which the Peruvian government did not issue any dineros. An analysis of one of these coins by Luis Ortega-San-Martín, Fabiola Bravo-Hualpa, and their students at the Pontifical Catholic University of Peru showed that it was made of copper, nickel, and zinc, in contrast to deniros from other years, which where made primarily of silver with a small amount of copper. They concluded that the coin was a counterfeit made around 1900:
“It is our belief that this counterfeit coin was not made as a numismatic rarity to deceive modern collectors … but rather to be used as current money (its worn state indicates ample use) …. [C]ounterfeiters usually make common coins that do not draw attention expecting them to pass unnoticed.”
In other words, as long as people are willing to accept counterfeit coins—which they likely will do if they do not recognize them as being counterfeit—they can serve as money. In fact, even if coins are easily recognizable as being counterfeit, they might still be used as money—particularly in a time and place where there is a shortage of government issued coins. In the British North American colonies, there was frequently a shortage of coins. Some people would clip small amounts off gold and silver coins, either selling the metal or having it minted into coins. The clipped coins, while not actually counterfeit, contained less precious metal than did unclipped coins, yet they continued to be used in buying and selling because of the general shortage of coins.
In March 2023, First Citizens Bank agreed to buy SVB after SVB had been taken over by the FDIC. (Photo courtesy of Lena Buonanno.)
On Wednesday, March 8, 2023, Silicon Valley Bank (SVB), headquartered in Santa Clara in the heart of California’s Silicon Valley surprised its depositors and Wall Street investors by announcing that in order to raise funds it had sold $21 billion in securities at a loss of $1.8 billion. The announcement raised concerns about the bank’s solvency—that is, there were questions as to whether the value of the bank’s assets, including bonds and other securities, was greater than the value of the bank’s liabilities, primarily deposits. The result was a run on the bank as depositors withdrew most of their funds. On Friday, March 10, 2023, the Federal Deposit Insurance Corporation (FDIC) took control of SVB before the bank could open for business that day.
Mandatory Credit: Photo by GEORGE NIKITIN/EPA-EFE/Shutterstock (13817875h)
The run on SVB in 2023 resembled …
bank runs during the 1930s.
In this blog post, we discuss the economics of bank runs and go into detail on what happened to SVB. In response to the failure of SVB, the FDIC declared that selling the bank’s assets and forcing depositors above the $250,000 deposit limit to suffer losses would pose a systemic risk to the financial system. As a result, with concurrence of the FDIC’s Board of Directors, two-thirds of the Fed’s Board of Governors, and Treasury Secretary Janet Yellen, the FDIC announced that all deposits in SVB—including deposits above the normal $250,000 dollar limit—would be insured. The waiving of the deposit insurance limit was also applied to Signature Bank, which failed a few days later. The run on SVB had been set off by the loses the bank had experienced on its long-term Treasury bonds. To reassure depositors in other banks that also held long-term debt, the Fed announced that it was establishing the Bank Term Funding Program (BTFP). Banks and other depository institutions, such as savings and loans and credit unions, can use the BTFP to borrow against their holdings of Treasury and mortgage-backed securities.
Maturity Mismatch and Moral Hazard
The failure of SVB highlighted two problems in commercial banking.
Maturity mismatch. Banks use short-term deposits to fund long-term investments, such as mortgage loans and purchases of Treasury bonds. In other words, banks fund investments in long maturity assets using short maturity liabilities. The resulting maturity mismatch causes two problems: 1) If, as happened at SVB, the bank experiences a run and needs to pay off depositors, it may only be able to do so by selling assets at a loss, which may push the bank to insolvency; and 2) bonds with long maturities are subject to greater interest rate risk than are bonds with shorter maturities: If market interest rates rise, the prices of long-term bonds fall by more than do the prices of short-term bonds. To compensate investors for this greater interest rate risk, long-term bonds typically have higher interest rates than do short-term bonds. (We explain these points in Money, Banking, and the Financial System, Chapter 5, Section 5.2.) The higher interest rates can lead a bank’s managers to invest deposits in long-term bonds in order to earn higher interest rates and boost the bank’s profits, even though they are taking on greater risk by doing so. The decision of SVB’s managers to hold a large number of long-term bonds greatly contributed to the failure of the bank.
Moral hazard. Why might bank managers take on more risk by buying long-term bonds and potentially making other risking investments, such as making commercial real estate loans? For instance, recently, New York Community Bancorp suffered losses on loans made to buyers of office buildings and apartments. A key to the explanation is the extent of moral hazard in banking. In the financial system—including banking—moral hazard is the problem investors experience in verifying that borrowers are using their funds as intended. Although we don’t usually think of bank depositors as being investors who lend their money to banks, in effect, that is the relationship depositors and banks are in. Banks borrow depositors money and use these funds to make a profit. Bank managers are typically rewarded on the basis of how profitable the bank is. As a result, bank managers may make riskier investments than depositors would make if depositors were deciding which investments to make.
In principle, depositors could monitor which investments a bank’s managers are making and withdraw their deposits if the investments are too risky. In practice, depositors rarely monitor bank managers for two key reasons: 1) Depositors often lack the information to accurately gauge the risk of an investment; and 2) Depositors are insured by the FDIC for up to $250,000 per deposit per bank. When a bank fails, the FDIC typically makes insured depositors funds available with no delay, often by establishing a “bridge bank” to continue the failed banks operations, including keeping ATMs open and stocked with cash. Deposit insurance increases the extent of moral hazard in the banking system. If depositors come to believe that in practice even deposits above the $250,000 are insured because of the actions bank regulators took the following the failures of SVB and Signature Bank, moral hazard is further increased. Still, reason 1. above gives reason to believe that, even in the absence of deposit insurance, depositors are unlikely to closely monitor bank managers. If depositors suddenly receive new information on a bank’s health—as happened when SVB suffered a loss on its sale of Treasury bonds—the likely result is a run. Runs potentially can lead other bank managers to become more cautious in their investments, but it will be too late to change the behavior of the managers of a bank that closes because of a run.
Bank Leverage
Because banks are highly leveraged, they are less able to withstand declines in the prices of their assets without becoming insolvent. A business is insolvent if the value of its assets is less than the value of its liabilities. Ordinarily, the FDIC will close an insolvent bank. A bank’s leverage is the ratio of the value of a bank’s assets to the value of its capital. A bank’s capital equals the funds contributed by the bank’s shareholders through their purchases of the bank’s stock plus the bank’s accumulated earnings. Put another way, a bank’s capital represents the value of the bank’s shareholders’ investment in the bank.
Shareholders focus on the return on their investment (ROI). Because banks are highly leveraged, a relatively small return on the banks assets—such as loans and mortgages—can result in a large return on the shareholders’ investment. This relationship holds because the shareholders’ investment (the bank’s capital) is much smaller than the bank’s assets. But just as high leverage increases a bank’s profits if the bank earns a positive return on its assets, it also increases a bank’s losses if the bank suffers a negative return on its assets. Banks would have a greater ability to absorb losses on their investments without becoming insolvent if the banks had more capital. But the more capital banks hold relative to the value of their assets—in other words, the less leveraged a bank is—the smaller the profit banks earn for a given return on their assets. Just as moral hazard can lead bank managers to make riskier investments than their depositors would prefer, it can also lead bank managers to become more leveraged than their depositors would prefer.
Regulatory Responses to the Failure of SVB
As we’ve noted, the problems that led to the failure of SVB were rooted in the problems that all commercial banks are subject to. (The reasons why SVB turned out to be particularly vulnerable to a bank run are discussed in this earlier blog post.) Although there have been extensive discussions among federal regulators, including the Federal Reserve and the FDIC, about steps to increase the stability of the U.S. banking sector, as of now no significant regulatory changes have occurred. However, there have been a number of proposals that regulators have been considering.
Increased capital. As we noted, banks hold relatively little capital relative to their assets. On average, U.S. commercial banks hold capital equal to about 9.5 percent of the value of their assets. Holding more capital would reduce bank leverage, making banks less vulnerable to declines in the value of their assets. More capital would also mean that banks have more funds available to pay out to depositors making withdrawals during a run. In regulating bank capital, the United States has largely followed the Basel accord, which was established by the Bank for International Settlements (BIS). We discuss the Basil accord in Money, Banking, and the Financial System, Chapter 12, Section 12.4. Here we can note that the most recent proposed capital regulations are Basel III, sometimes called the “Basel III Endgame.”
Basel III would require large banks to hold more capital. The proposal has been heavily criticized by the banking industry. Some economists strongly support banks holding more capital to increase the stability of the banking system, but other economists are more skeptical. These economists argue that even if banks held twice as much capital as they currently do, it would likely prove insufficient to meet depositor withdrawals in bank run similar to the one SVB experienced. Holding more capital is also likely to reduce the volume of loans that banks will be able to make. Finally, the problems in the banking system in recent years have typically involved mid-sized regional banks rather than the large banks—those holding more than $100 billion in assets—that are the focus of Basel III. In any event, in testimony before Congress earlier this month, Fed Chair Jerome Powell stated that: “I do expect that there will be broad and material changes to the proposal.” His statement makes it likely that the United States won’t fully adopt the proposed Basel III regulations in their current form.
2. Revising deposit insurance. The establishment of the FDIC in 1934 stopped the bank runs that had seriously damaged the U.S. economy during the early 1930s. Because of deposit insurance, people knew that they didn’t have to quickly withdraw their funds from a bank experiencing losses because even if the bank failed, deposits were insured. But, as we noted earlier, deposit insurance also increases moral hazard in banking by reducing the incentive of depositors to monitor the investments bank managers make. One proposed reform would increase deposit insurance for accounts held by households and small and mid-sized firms because these deposits are less likely to be quickly withdrawn if a banks experiences difficulties and because these depositors are less likely to be able to monitor bank managers. Large firms, investors, and financial firms would not be eligible for the increased deposit insurance. (Under Basel III, banks might be required to hold additional liquid assets so that they would be able to have funds available to meet sudden withdrawals by large firms, investors, and financial firms. It was withdrawals by those types of depositors that led to SVB’s failure.)
3. Increased use of the Fed’s discount window. Congress established the Federal Reserve in 1914 partly in response to the bank panics that plagued the U.S. financial system during the 19th and early 20th centuries. The Federal Reserve Act was intended to allow the Fed to serve as a lender of last resort by making discount loans to banks having temporary liquidity problems as a result of deposit withdrawals. In practice, however, banks were often reluctant to borrow at the Fed’s discount window because they were afraid that discount borrowing came with a stigma indicating that the bank was in trouble. As a result, discount lending has not played a significant role in stopping bank runs. For instance, SVB had not prepared to request discount loans and so weren’t able to use discount loans to provide the funds needed to meet deposit withdrawals. Some economists and policymakers have proposed requiring banks to provide the Fed with enough collateral, primarily in the form of business and consumer loans, to meet their liquidity needs in the event of a run. By identifying sufficien collateral ahead of time, banks would be able to immediately receive discount loans in an emergency. If SVB had provided collateral equal to the value of its uninsured deposits, it might have been able to withstand the run that occurred.
4. Require more securities to be marked to market. Banking regulations allow banks to keep bonds and other securities on their balance sheets at face value even if the market value of the securities has declined, provided the securities are identified as being held to maturity. When a bank experiences liquidity problems it may be forced to sell securities that it previously designated as being held to maturity, which is the situation SVB found itself in. Some economists and policymakers have proposed that more—possibly all—of a bank’s holdings of securities be “marked to market,” which means that the securities’ current market values rather than their face values would be used on the bank’s balance sheet. Economists and policymakers are divided in their opinions on this proposals. Marking more securities to market may give depositors and investors a clearer idea of the true financial health of a bank. But doing so might also be misleading because banks will not take losses on those securities that they actually hold until maturity.
5. Bank examiners become more focused on emerging threats. Some economists and policymakers argue that in practice bank examiners from the FDIC, the Fed, and the Office of the Comptroller of the Currency (which regulates larger banks) are in the best position to determine whether bank managers are taking on too much risk, particularly as economic conditions change. For example, as the Federal Reserve began to increase its target for the federal funds rate in the spring of 2022, other interest rates also rose, causing the prices of long-term bonds to fall. In retrospect, bank examiners overseeing SVB and other banks were slow to question the managers of these banks about the degree of risk involved in their investments in long-term bonds. Similarly, bank examiners were slow to realize the risk that banks like SVB were taking in relying on deposits above the $250,000 insurance limit. These depositors are likely to be the first to withdraw funds in the event of a bank encountering a problem. In principle, if bank examiners were more alert to the effect changing economic condidtions have on the riskiness of bank investments, the examiners might be able to prod bank managers to reduce their risky investments before a crisis occurs.
6. Further consolidation of the banking system. As we discuss in Money, Banking, and the Financial System, Chapter 10, Section 10.4, for many years restrictions on banks operating in more than one state resulted in the United States having many more banks than is true of other high-income countries. In the mid-1990s, after Congress authorized interstate banking, a wave of consolidation in the banking industry resulted in some banks operating nationwide. However, the United States still has many small and mid-size, or regional, banks. The largest banks have typically not encountered liquity problems or experienced runs. Some economists and policymakers have argued that further consolidation could lead to a banking system in which nearly all banks had the financial resources to withstand bank runs. Other economists and policymakers argue, however, that small businesses often rely for credit on smaller community banks. These banks engage in relationship banking, which means that they have long-term relationships with borrowers. These relationships enable the banks to accurately assess the creditworthiness of borrowers because the banks possess private information on the borrowers. Larger banks are more likely to use standard algorithms to assess the creditworthiness of borrowers. In doing so a larger bank may refuse to make loans that a community bank would have made. As a result, further signficant consolidation in the banking system might make it more difficult for small businesses to access the credit they need to operate and to expand.
Finally, as we note in Chapter 12 of Money, Banking, and the Financial System, government regulation of banking has followed a familiar pattern dating back decades. When banks or another part of the financial system, experience a crisis, Congress, the president, and the regulatory agencies respond with new regulations. The regulations, though, can lead financial firms to innovate in ways that undermine the effects of the regulation. If these financial innovations result in a crisis, the government reponds with additional regulations, which lead to new financial innovations. And so on. The nature of banking and the many other channels through which funds flow from savers and investors to borrowers are sufficiently varied and evolve so quickly that it’s unlikely that any particular regulations will be capable of permanently stabilizing the financial system.
Federal Reserve Chair Jerome Powell (Photo from the New York Times)
As always, economists and investors had been awaiting the outcome of today’s meeting of the Federal Reserve’s policy-making Federal Open Market Committee (FOMC) to get further insight into future monetary policy. The expectation has been that the FOMC would begin reducing its target for the federal funds rate, mostly likely beginning with its meeting on June 11-12. Financial markets were expecting that the FOMC would make three 0.25 percentage point cuts by the end of the year, reducing its target range from the current 5.25 to 5.50 percent to 4.50 to 4.75 percent.
There appears to be nothing in the committees statement (found here) or in Powell’s press conference following the meeting to warrant a change in expectations of future Fed policy. The committee’s statement noted that: “The Committee does not expect it will be appropriate to reduce the target range until it has gained greater confidence that inflation is moving sustainably toward 2 percent.” As Powell stated in his press conference, although the committee found the general trend in inflation data to be encouraging, they would have to see additional months of data that were consistent with their 2 percent inflation target before reducing their target for the federal funds rate.
As we’ve noted in earlier blog posts (here, here, and here), inflation during January and February has been somewhat higher than expected. Some economists and investors had wondered if, as a result, the committee might delay its first cut in the federal funds target range or implement only two cuts rather than three. In his press conference, Powell seemed unconcerned about the January and February data and expected that falling inflation rates of the second half of 2023 to resume.
Typically, at the FOMC’s December, March, June, and September meetings, the committee releases a “Summary of Economic Projections” (SEP), which presents median values of the committee members’ forecasts of key economic variables.
The table shows that the committee members made relatively small changes to their projections since their December meeting. Most notable was an increase in the median projection of growth in real GDP for 2024 from 1.4 percent at the December meeting to 2.1 percent at this meeting. Correspondingly, the median projection of unemployment during 2024 dropped from 4.1 percent to 4.0 percent. The key projection of the value of the federal funds rate at the end of 2024 was left unchanged at 4.6 percent. As noted earlier, that rate is consistent with three 0.25 percent cuts in the target range during the remainder of the year.
The SEP also includes a “dot plot.” Each dot in the plot represents the projection of an individual committee member. (The committee doesn’t disclose which member is associated with which dot.) Note that there are 19 dots, representing the 7 members of the Fed’s Board of Governors and the 12 presidents of the Fed’s district banks. Although only the president of the New York Fed and the presidents of 4 of the 11 district banks are voting members of the committee, all the district bank presidents attend the committee meetings and provide economic projections.
The plots on the far left of the figure represent the projections of each of the 19 members of the value of the federal funds rate at the end of 2024. These dots are bunched fairly closely around the median projection of 4.6 percent. The dots representing the projections for 2025 and 2026 are more dispersed, representing greater uncertainty among committee members about conditions in the future. The dots on the far right represent the members’ projections of the value of the federal funds rate in the long run. As Table 1 shows, the median projected value is 2.6 percent (up slightly from 2.5 percent in December), although the plot indicates that all but one member expects that the long-run rate will be 2.5 percent or higher. In other words, few members expect a return to the very low federal funds rates of the period from 2008 to 2016.
A bookstore in New York City closed during Covid. (Photo from the New York Times)
Four years ago, in mid-March 2020, Covid–19 began to significantly affect the U.S. economy, with hospitalizations rising and many state and local governments closing schools and some businesses. In this blog post we review what’s happened to key macro variables during the past four years. Each monthly series starts in February 2020 and the quarterly series start in the fourth quarter of 2019.
Production
Real GDP declined by 5.8 percent from the fourth quarter of 2019 to the first quarter of 2020 and by an additional 28.0 percent from the first quarter of 2020 to the second quarter. This decline was by far the largest in such a short period in the history of the United States. From the second quarter to the third quarter of 2020, as businesses began to reopen, real GDP increased by 34.8 percent, which was by far the largest increase in a single quarter in U.S. history.
Industrial production followed a similar—although less dramatic—path to real GDP, declining by 16.8 percent from February 2020 to April 2020 before increasing by 12.3 percent from April 2020 to June 2020. Industrial production did not regain its February 2020 level until March 2022. The swings in industrial production were smaller than the swings in GDP because industrial production doesn’t include the output of the service sector, which includes firms like restaurants, movie theaters, and gyms that were largely shutdown in some areas. (Industrial production measures the real output of the U.S. manufacturing, mining, and electric and gas utilities industries. The data are issued by the Federal Reserve and discussed here.)
Employment
Nonfarm payroll employment, collected by the Bureau of Labor Statistics (BLS) in its establishment survey, followed a path very similar to the path of production. Between February and April 2020, employment declined by an astouding 22 million workers, or by 14.4 percent. This decline was by far the largest in U.S. history over such a short period. Employment increased rapidly beginning in April but didn’t regain its February 2020 level until June 2022.
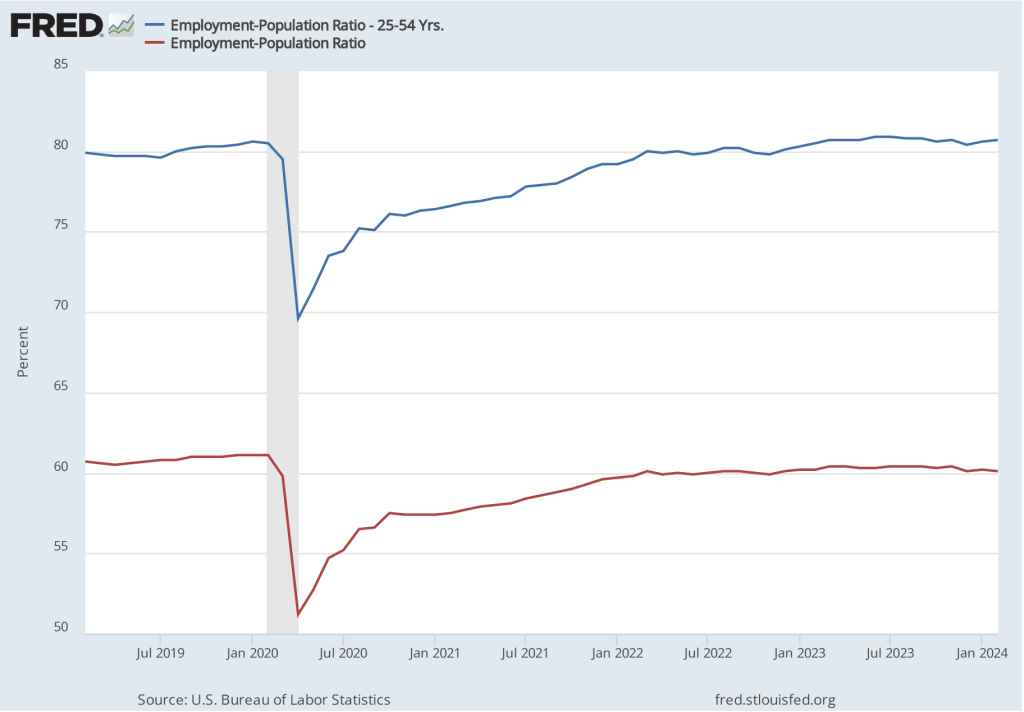
The employment-population ratio measures the percentage of the working-age population that is employed. It provides a more comprehensive measure of an economy’s utilization of available labor than does the total number of people employed. In the following figure, the blue line shows the employment-population ratio for the whole working-age population and the red line shows the employment-population ratio for “prime age workers,” those aged 25 to 54.
For both groups, the employment-population ratio plunged as a result of Covid and then slowly recovered as the production began increasing after April 2020. The employment-population ratio for prime age workers didn’t regain its February 2020 value until February 2023, an indication of how long it took the labor market to fully overcome the effects of the pandemic. As of February 2024, the employment-population ratio for all people of working age hasn’t returned to its February 2020 value, largely because of the aging of the U.S. population.
Average weekly hours worked followed an unusual pattern, declining during March 2020 but then increasing to beyond its February 2020 level to a peak in April 2021. This increase reflects firms attempting to deal with a shortage of workers by increasing the hours of those people they were able to hire. By April 2023, average weekly hours worked had returned to its February 2020 level.
Income
Real average hourly earnings surged by more than six percent between February and April 2020—a very large increase over a two-month period. But some of the increase represented a composition effect—as workers with lower incomes in services industries such as restaurants were more likely to be out of work during this period—rather than an actual increase in the real wages received by people employed during both months. (Real average hourly earnings are calculated by dividing nominal average hourly earnings by the consumer price index (CPI) and multiplying by 100.)
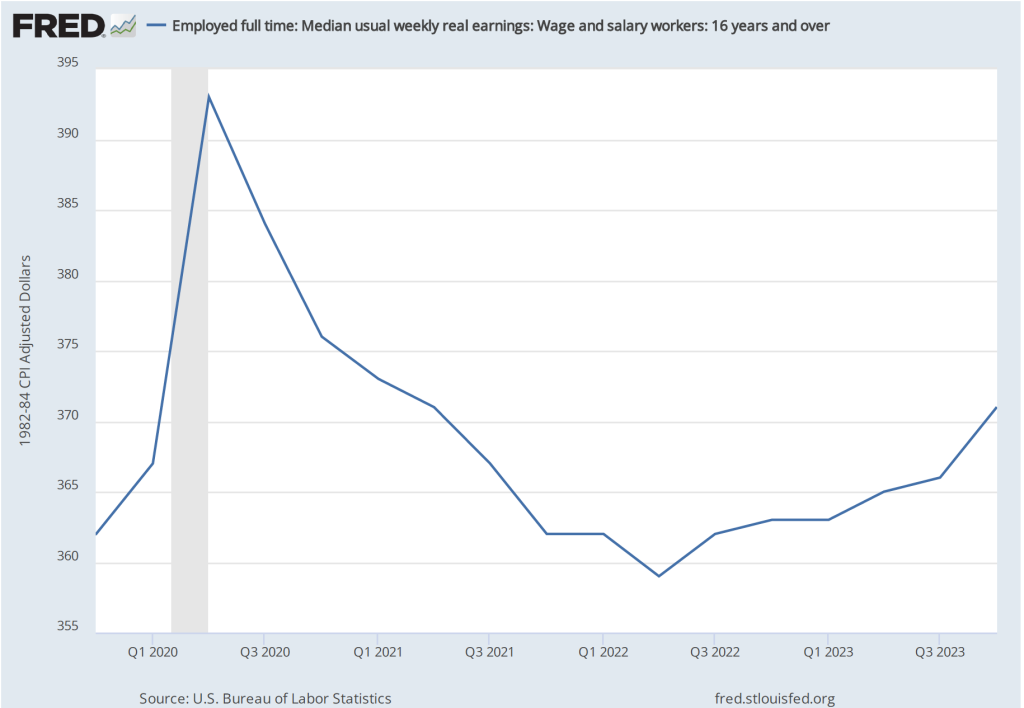
Median weekly real earnings, because it is calculated as a median rather than as an average (or mean), is less subject to composition effects than is real average hourly earnings. Median weekly real earnings increased sharply between February and April of 2020 before declining through June 2022. Earnings then gradually increased. In February 2024 they were 2.5 percent higher than in February 2020.
Inflation
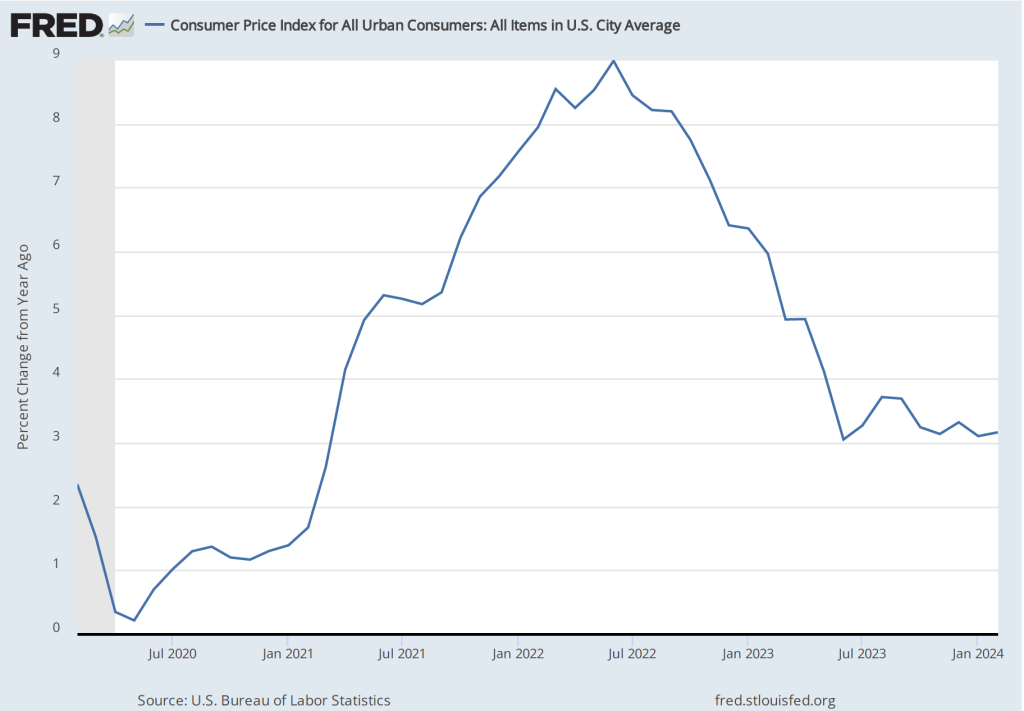
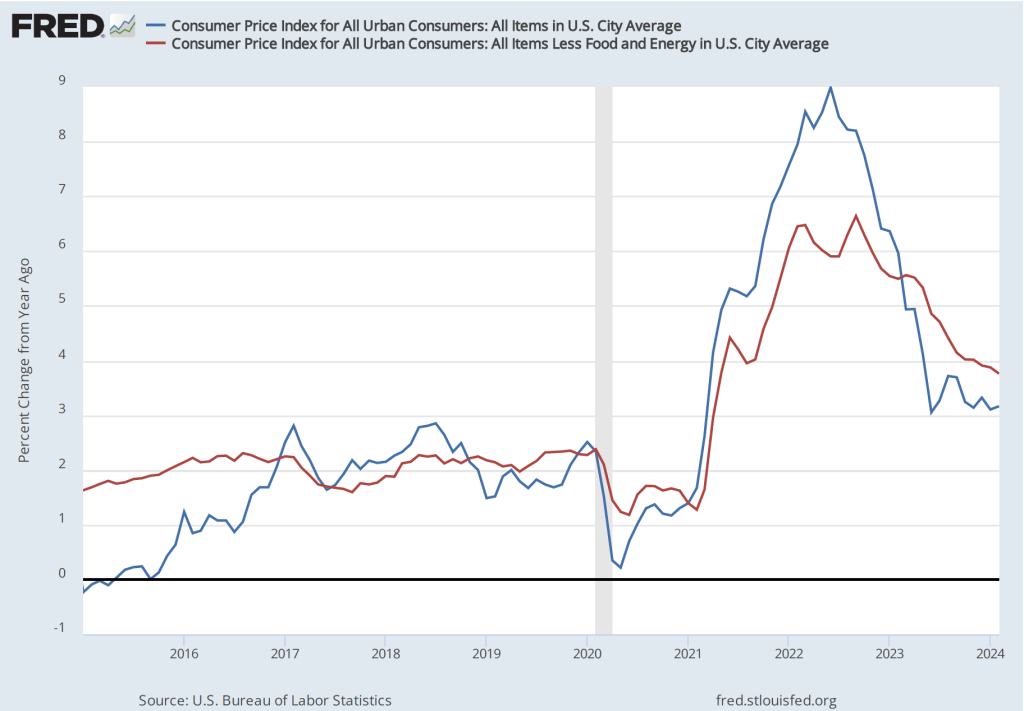
The inflation rate most commonly mentioned in media reports is the percentage change in the CPI from the same month in the previous year. The following figure shows that inflation declined from February to May 2020. Inflation then began to rise slowly before rising rapidly beginning in the spring of 2021, reaching a peak in June 2022 at 9.0 percent. That inflation rate was the highest since November 1981. Inflation then declined steadily through June 2023. Since that time it has fluctuated while remaining above 3 percent.
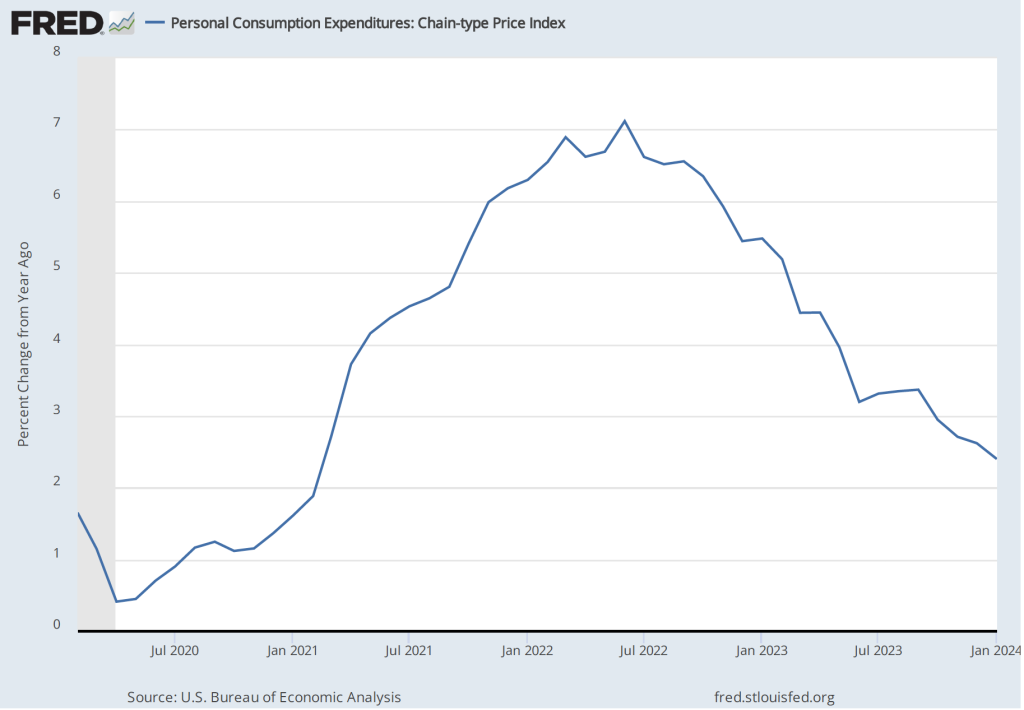
As we discuss in Macroeconomics, Chapter 15, Section 15.5 (Economics, Chapter 25, Section 25.5), the Federal Reserve gauges its success in meeting its goal of an inflation rate of 2 percent using the personal consumption expenditures (PCE) price index. The following figure shows that PCE inflation followed roughly the same path as CPI inflation, although it reached a lower peak and had declined below 3 percent by November 2023. (A more detailed discussion of recent inflation data can be found in this post and in this post.)
Monetary Policy
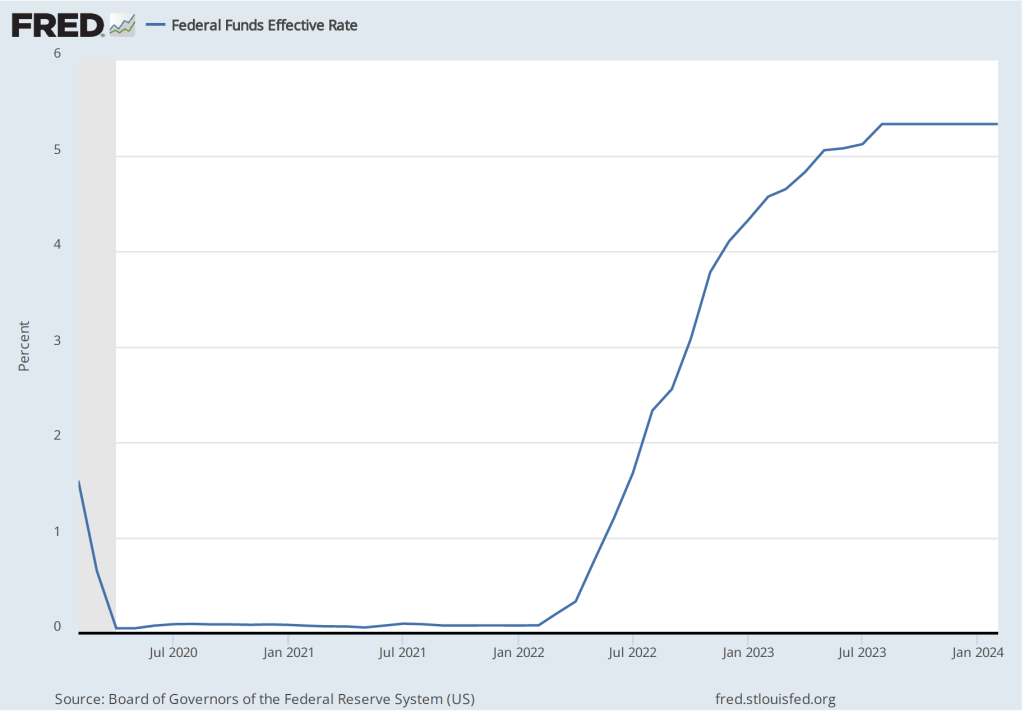
The following figure shows the effective federal funds rate, which is the rate—nearly always within the upper and lower bounds of the Fed’s target range—that prevails during a particular period in the federal funds market. In March 2020, the Fed cut its target range to 0 to 0.25 percent in response to the economic disruptions caused by the pandemic. It kept the target unchanged until March 2022 despite the sharp increase in inflation that had begun a year earlier. The members of the Federal Reserve’s Federal Open Market Committee (FOMC) had initially hoped that the surge in inflation was largely caused by disuptions to supply chains and would be transitory, falling as supply chains returned to normal. Beginning in March 2022, the FOMC rapidly increased its target range in response to continuing high rates of inflation. The targer range reached 5.25 to 5.50 percent in July 2023 where it has remained through March 2024.
Although the money supply is no longer the focus of monetary policy, some economists have noted that the rate of growth in the M2 measure of the money supply increased very rapidly just before the inflation rate began to accelerate in the spring of 2021 and then declined—eventually becoming negative—during the period in which the inflation rate declined.
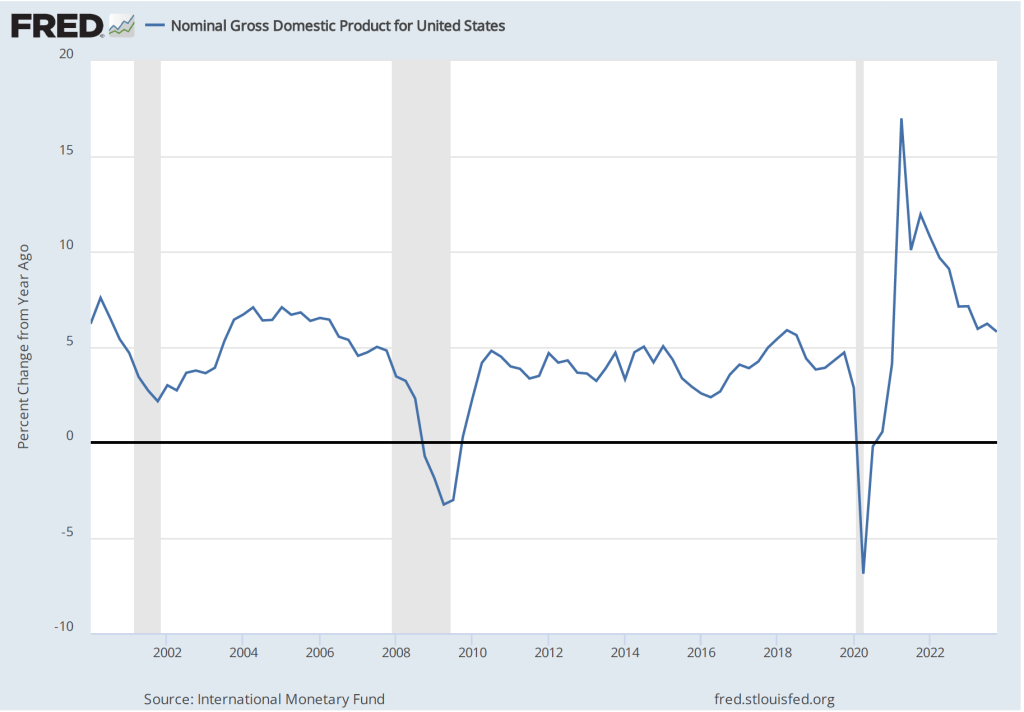
As we discuss in the new 9th edition of Macroeconomics, Chapter 15, Section 15.5 (Economics, Chapter 25, Section 25.5), some economists believe that the FOMC should engage in nominal GDP targeting. They argue that this approach has the best chance of stabilizing the growth rate of real GDP while keeping the inflation rate close to the Fed’s 2 percent target. The following figure shows the economy experienced very high rates of inflation during the period when nominal GDP was increasing at an annual rate of greater than 10 percent and that inflation declined as the rate of nominal GDP growth declined toward 5 percent, which is closer to the growth rates seen during the 2000s. (This figure begins in the first quarter of 2000 to put the high growth rates in nominal GDP of 2021 and 2022 in context.)
Fiscal Policy
As we discuss in the new 9th edition of Macroeconomics, Chapter 15 (Economics, Chapter 25), in response to the Covid pandemic Congress and Presidents Trump and Biden implemented the largest discretionary fiscal policy actions in U.S. history. The resulting increases in spending are reflected in the two spikes in federal government expenditures shown in the following figure.
The initial fiscal policy actions resulted in an extraordinary increase in federal expenditures of $3.69 trillion, or 81.3 percent, from the first quarter to the second quarter of 2020. This was followed by an increase in federal expenditures of $2.31 trillion, or 39.4 percent, from the fourth quarter of 2020 to the first quarter of 2021. As we recount in the text, there was a lively debate among economists about whether these increases in spending were necessary to offest the negative economic effects of the pandemic or whether they were greater than what was needed and contributed substantially to the sharp increase in inflation that began in the spring of 2021.
Saving
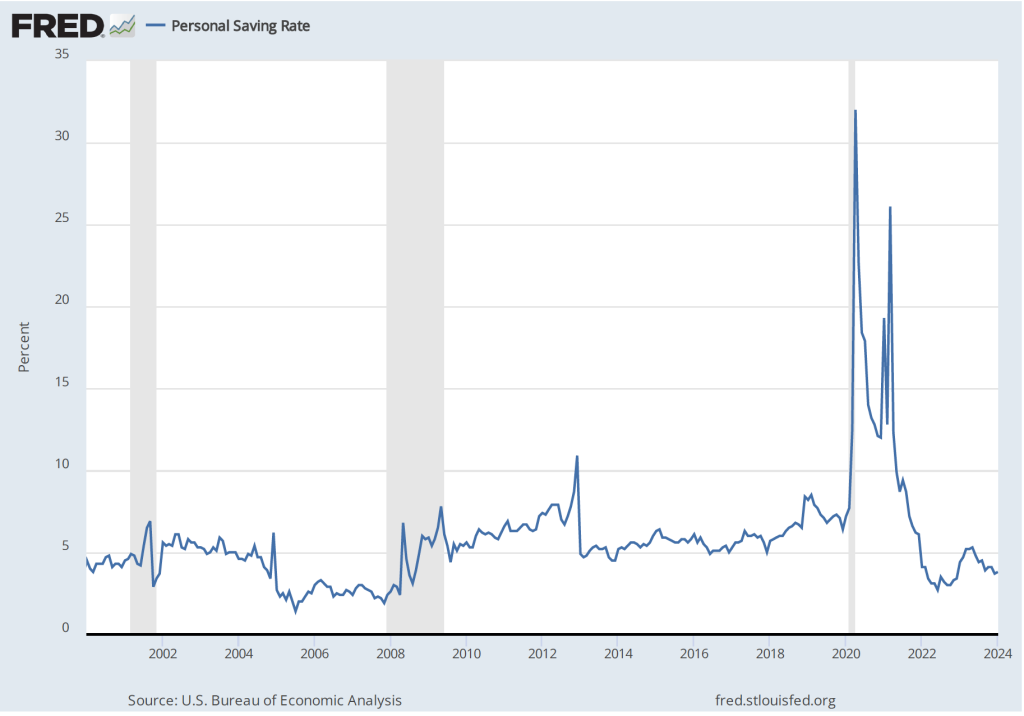
As a result of the fiscal policy actions of 2020 and 2021, many households received checks from the federal government. In total, the federal government distributed about $80o billion directly to households. As the figure shows, one result was to markedly increase the personal saving rate—measured as personal saving as a percentage of disposable personal income—from 6.4 percent in December 2019 to 22.0 in April 2020. (The figure begins in January 2020 to put the size of the spike in the saving rate in perspective.)
The rise in the saving rate helped households maintain high levels of consumption spending, particularly on consumer durables such as automobiles. The first of the following figure shows real personal consumption expenditures and the second figure shows real personal consumption expenditures on durable goods.
Taken together, these data provide an overview of the momentous macroeconomic events of the past four years.
An Automated Teller Machine (ATM) located in Egypt that dispenses gold bars rather than currency. (Photo from ahrm.org.)
A recent article in the New York Times (available here, but a subscription may be required) discusses how consumers in Egypt are dealing with inflation. According to statistics from the International Monetary Fund, consumer prices in Egypt rose 23.5 percent in 2023 and are projected to increase by 32.2 percent in 2024, although in early 2024 inflation may have been running at an annual rate of 50 percent. In response to the inflation, many Egyptian businesses have begun quoting prices in U.S. dollars rather than in Egyptian pounds. The value of the Egyptian pound has declined from about 18 pounds to the U.S. dollar in early 2022 to about 48 pounds to the dollar today. In practice, many Egyptian consumers can have difficulty obtaining dollars except on the black market, where the exchange rate is generally worse than the rate quoted by the Egyptian central bank.
According to the article, many Egyptians, losing faith in value of the pound and unable to easily obtain U.S. dollars, have turned to gold as a potentially “safe financial harbor.” The article notes that: “The market [for gold] grew so fevered that the government announced in November that it was partnering with a financial technology company to install A.T.M.s [Automated Teller Machines] that would dispense gold bars instead of cash.” That ATM is shown in the photo above.
This episode raises two questions:
Is gold a good hedge (a “safe harbor”) against inflation?
Are ATMs that dispense gold rather than currency a good idea?
As we discuss in Chapter 14, Section 14.3 of Money, Banking, and the Financial System, gold has not been a good hedge against inflation for U.S. investors. Although many people believe that the price of gold can be relied on to increase if the general price level increases, in fact, the data show that the price of gold can’t be counted on to keep up with increases in the general price level. In the following figure, the blue line shows the market price of gold during each month since January 1976. The red line shows the real price of gold, which is calculated by dividing the nominal price of gold by the consumer price index (CPI). (For convenience, we set the value of the CPI equal to 100 in January 1976.) The price of gold is measured in dollars per ounce.
The figure shows that the market price of gold can fall even as the price level rises. For example, the price of gold rose from $132 per ounce in January 1976 to $670 per ounce in September 1980. As a result, during that period the real price of gold more than tripled, and holding gold during this period was a good hedge against inflation. Unfortunately, the market price of gold then went into a long decline and didn’t again reach its September 1980 value until April 2007, a period during which the CPI more than doubled. In other words, over this more than 25-year period gold provided no hedge at all against the effects of inflation. Consumers in India today shouldn’t count on buying gold as way to protect the real value of their savings from being reduced by inflation.
The New York Times article refers to only a single ATM in Egypt that dispenses gold bars rather than Egyptian pounds. Would we expect that the number of these ATMs will increase in Egypt and other countries experiencing very high inflation rates? Does the existence of these ATMs indicate that people in Egypt are now—or will likely begin—using gold bars rather than currency for routine buying and selling?
The answer to both questions is likely “no.” Although the article refers to an “ATM,” it might be better to think of this facility as instead being a vending machine. Similar ATMs/vending machines that dispense gold bars are available in the United States (as indicated here, here, and here), and, most likely, in other countries as well.
We usually think of vending machines as selling soda and water or snacks. But there are many vending machines that sell other products as well. For instance, most large airports have vending machines that sell small electronic products, such as cell phone batteris or earphones. The term ATM is usually reserved for machines that enable people who have deposits at a bank or other financial firms to withdraw currency. So, the article seems to be describing something that is more a vending machine than an ATM. The article discusses the many small businesses in Egypt that buy and sell gold, which makes it likely that most consumers will continue to rely on those businesses rather than on a machine when they want to buy and sell gold.
It seems unlikely that people in Egypt will beging using gold bars for routine buying and selling—that is, using gold as a medium of exchange. Most goods in Egypt have their prices denominated in either Egyptian pounds or in U.S. dollars or in both. Anyone attempting to buy goods with gold bars would need first to determine the market price of gold at that time before making the purchase and would have to locate a seller who was willing to accept gold in exchange for their goods. In effect, sellers would be engaging in two transactions at the same time: buying gold from the buyer and selling goods to the buyer. Although in a time of high inflation a seller takes on the risk that currency he accepts for a purchase may decline in value while the seller is holding it, a seller accepting gold also takes on the risk that the market price of gold may fall while the seller is holding it.
It’s interesting that the Egyptian government reacted to consumers buying gold as a hedge against inflation by partnering with a financial firm to make available an “ATM” that dispenses gold bars. But it probably doesn’t represent a significant development in the Egyptian financial system.
Federal Reserve Chair Jerome Powell (Photo from Bloomberg News via the Wall Street Journal.)
Economists, policymakers, and Wall Street analysts have been waiting for macroeconomic data to confirm that the Federal Reserve has brought the U.S. economy in for a soft landing, with inflation arrving back at the Fed’s target of 2 percent without the economy slipping into a recession. Fed officials have been cautious about declaring that they have yet seen sufficient data to be sure that a soft landing has actually been achieved. Accordingly, they are not yet willing to begin cutting their target for the federal funds rate.
For instance, on March 6, in testifying before the Commitee on Financial Services of the U.S. House of Representatives, Fed Chair Jerome Powell stated that the Fed’s Federal Open Market Committee (FOMC) “does not expect that it will be appropriate to reduce the target range until it has gained greater confidence that inflation is moving sustainably toward 2 percent.” (Powell’s statement before his testimony can be found here.)
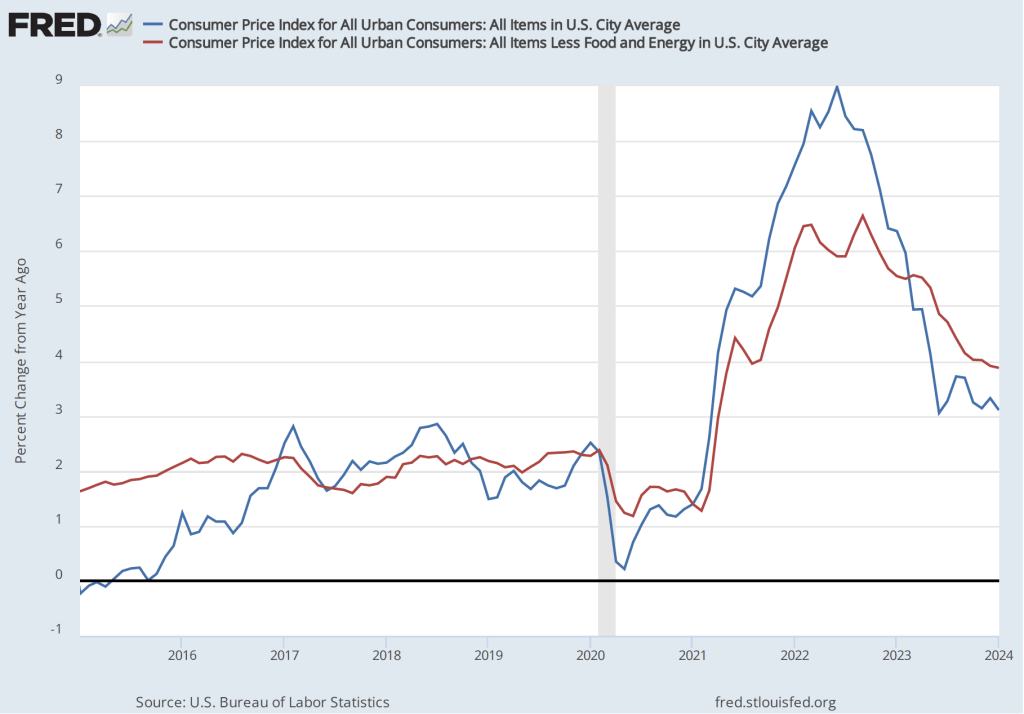
The BLS’s release today (March 12) of its report on the consumer price index (CPI) (found here) for February indicated that inflation was still running higher than the Fed’s target, reinforcing the cautious approach that Powell and other members of the FOMC have been taking. The increase in the CPI that includes the prices of all goods and services in the market basket—often called headline inflation—was 3.2 percent from the same month in 2023, up slightly from 3.1 In January. (We discuss how the BLS constructs the CPI in Macroeconomics, Chapter 9, Section 19.4, Economics, Chapter 19, Section 19.4, and Essentials of Economics, Chapter 3, Section 13.4.) As the following figure shows, core inflation—which excludes the prices of food and energy—was 3.8 percent, down slightly from 3.9 percent in January.
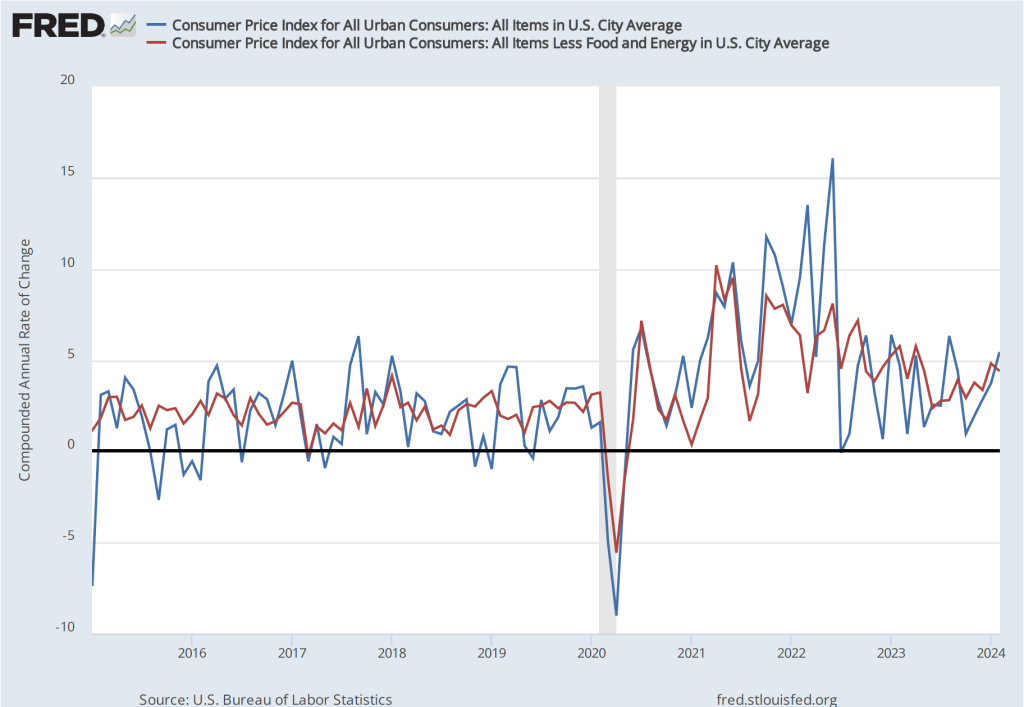
If we look at the 1-month inflation rate for headline and core inflation—that is the annual inflation rate calculated by compounding the current month’s rate over an entire year—the values are more concerning, as indicated in the following figure. Headline CPI inflation is 5.4 percent (up from 3.7 percent in January) and core CPI inflation is 4.4 percent (although that is down from 4.8 percent in January). The Fed’s inflation target is measured using the personal consumption expenditures (PCE) price index, not the CPI. But CPI inflation at these levels is not consistent with PCE inflation of only 2 percent.
Even more concerning is the path of inflation in the prices of services. As we’ve noted in earlier posts, Chair Powell has emphasized that as supply chain problems have gradually been resolved, inflation in the prices of goods has been rapidly declining. But inflaion in services hasn’t declined nearly as much. Last summer he stated the point this way:
“Part of the reason for the modest decline of nonhousing services inflation so far is that many of these services were less affected by global supply chain bottlenecks and are generally thought to be less interest sensitive than other sectors such as housing or durable goods. Production of these services is also relatively labor intensive, and the labor market remains tight. Given the size of this sector, some further progress here will be essential to restoring price stability.”
The following figure shows the 1-month inflation rate in services prices and in services prices not included including housing rent. Some economists believe that the rent component of the CPI isn’t well measured and can be volatile, so it’s worthwhile to look at inflation in service prices not including rent. The figure shows that inflation in all service prices has been above 4 percent in every month since July 2023. Although inflation in service prices declined from January, it was still a very high 5.8 percent in February. Inflation in service prices not including housing rent was even higher at 7.5 percent. Such large increases in the prices of services, if they were to continue, wouldn’t be consistent with the Fed meeting its 2 percent inflation target.
Finally, some economists and policymakers look at median inflation to gain insight into the underlying trend in the inflation rate. If we listed the inflation rate in each individual good or service in the CPI, median inflation is the inflation rate of the good or service that is in the middle of the list—that is, the inflation rate in the price of the good or service that has an equal number of higher and lower inflation rates. As the following figure shows, although median inflation declined in February, it was still high at 4.6 percent and, although median inflation is volatile, the trend has been generally upward since July 2023.
The data in this month’s BLS report on the CPI reinforces the view that the FOMC will not move to cut its target for the federal funds rate in the meeting next week and makes it somewhat less likely that the committee will cut its target at the following meeting on April 30-May 1.
On the first Friday of each month, the Bureau of Labor Statistics (BLS) releases its “Employment Sitution” report for the previous month. The data for February in today’s report at first glance seem contradictory: The BLS reported that the net increase in employment in February was 275,000, which was above the increase of 200,000 that economists participating in media surveys had expected (see here and here). But the unemployment rate, which had been expected to remain constant at 3.7 percent, rose to 3.9 percent.
The apparent paradox of employment and the unemployment rate both increasing in the same month is (partly) attributable to the two numbers being from different surveys. The employment number most commonly reported in media accounts is from the establishment survey (sometimes referred to as the payroll survey), whereas the unemployment rate is taken from the household survey. The results of both surveys are included in the BLS’s monthly “Employment Situation” report. As we discuss in Macroeconomics, Chapter 9, Section 9.1 (Economics, Chapter 19, Section 19.1), many economists and policymakers at the Federal Reserve believe that employment data from the establishment survey provides a more accurate indicator of the state of the labor market than do either the employment data or the unemployment data from the household survey. Accordingly, most media accounts interpreted the data released today as indicating continuing strength in the labor market.
However, it can be worth looking more closely at the differences between the measures of employment in the two series because it’s possible that the household survey data is signalling that the labor market is weaker than it appears from the establishment survey data. The following table shows the data on employment from the two surveys for January and February.
Establishment Survey
Household Survey
January
157,533,000
161,152,000
February
157,808,000
160,968,000
Change
+275,000
-184,000
Note that in addition to the fact that employment as measured by the household survey is falling, while employment as measured by the establishment survey is increasing, household survey employment is significantly higher in both months. Household survey employment is always higher than establishment survey employment because the household survey includes employment of three groups that are not included in the establishment survey:
Self-employed workers
Unpaid family workers
Agricultural workers
(A more complete discuss of the differences in employment in the two surveys can be found here.) The BLS also publishes a useful data series in which it attempts to adjust the household survey data to more closely mirror the establishment survey data by, among other adjustments, removing from the household survey categories of workers who aren’t included in the payroll survey. The following figure shows three series—the establishment series (gray line), the reported household series (orange line), and the adjusted household series (blue line)—for the months since 2021. For ease of comparison the three series have been converted to index numbers with January 2021 set equal to 100.
Note that for most of this period, the adjusted household survey series tracks the establishment survey series fairly closely. But in November 2023, both household survey measures of employment begin to fall, while the establishment survey measure of employment continues to increase. Falling employment in the household survey may be signalling weakness in the labor market that employment in the establishment survey may be missing, but it might also be attributed to the greater noisiness in the household survey’s employment data.
There are three other things to note in this month’s employment report. First, the BLS revised the initially reported increase in December establishement survey employment downward by 35,000 jobs and the January increase downward by 124,000 jobs. The January adjustment was large—amounting to more than 35 percent of the initially reported increase of 353,000. It’s normal for the BLS to revise its initial estimates of employment from the establishment survey but a series of negative revisions is typical of periods just before or at the beginning of a recession. It’s important to note, though, that several months of negative revisions to establishment employment are far from an infallible predictor of recessions.
Second, as shown in the following figure, the increase in average hourly earnings slowed from the high rate of 6.8 percent in January to 1.7 percent in February—the smallest increase since early 2022.. (These increases are measured at a compounded annual rate, which is the rate wages would increase if they increased at that month’s rate for an entire year.) A slowing in wage growth may be another sign that the labor market is weakening, although the data are noisy on a month-to-month basis.
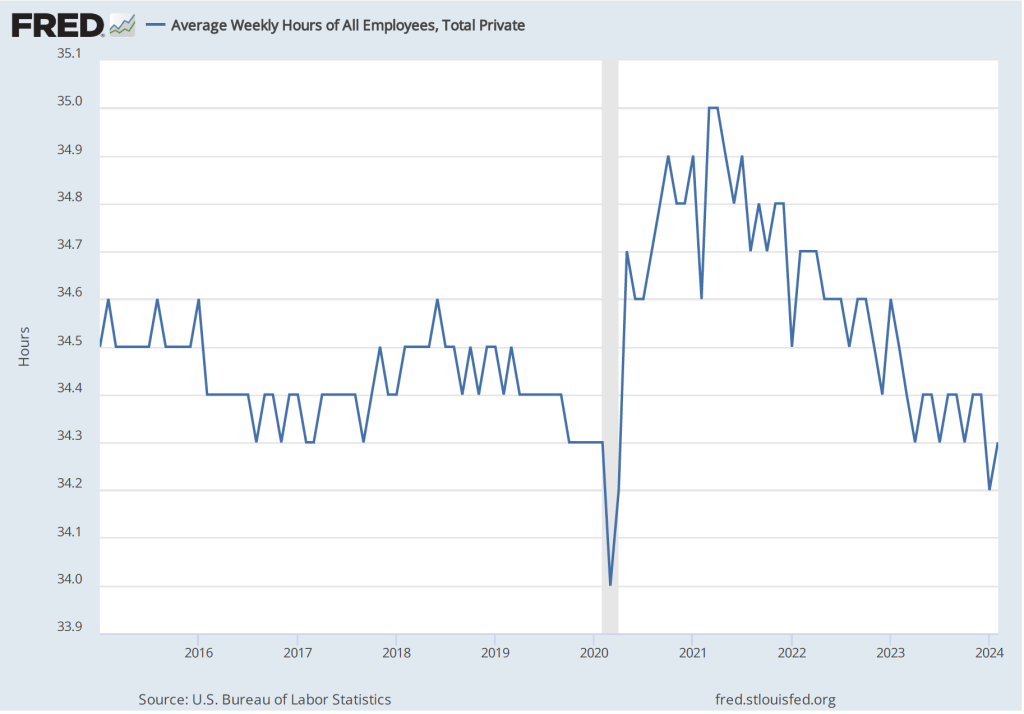
Finally, one positive indicator of the state of the labor market is that average weekly hours worked increased. As shown in the following figure, average hours worked had been slowly, if irregularly, trending downward since early 2021. In February, average hours worked increased slightly to 34.3 hours per week from 34.2 hours per week in January. But, again, it’s difficult to draw strong conclusions from one month’s data.
In testifying before Congress earlier this week, Fed Chair Jerome Powell noted that:
“We believe that our policy rate [the federal funds rate] is likely at its peak for this tightening cycle. If the economy evolves broadly as expected, it will likely be appropriate to begin dialing back policy restraint at some point this year. But the economic outlook is uncertain, and ongoing progress toward our 2 percent inflation objective is not assured.”
It seems unlikely that today’s employment report will change how Powell and the other memebers of the Fed’s Federal Open Market Committee evaluate the current economic situation.
Wall Street Journal columnist Justin Lahart notes that when the Bureau of Labor Statistics (BLS) releases its monthly report on the consumer price index (CPI), the report “generates headlines, features in politicians’ speeches and moves markets.” When the Bureau of Economic Analysis (BEA) releases its monthly report “Personal Income and Outlays,” which includes data on the personal consumption expenditures (PCE) price index, there is much less notice in the business press or, often, less effect on financial markets. (You can see the difference in press coverage by comparing the front page of today’s online edition of the Wall Street Journal after the BEA released the latest PCE data with the paper’s front page on February 13 when the BLS released the latest CPI data.)
This difference in the weight given to the two inflation reports seems curious because the Federal Reserve uses the PCE, not the CPI, to determine whether it is achieving its 2 percent annual inflation target. When a new monthly measure of inflation is released much of the discussion in the media is about the effect the new data will have on the Federal Open Market Committee’s (FOMC) decision on whether to change its target for the federal funds rate. You might think the result would be greater media coverage of the PCE than the CPI. (The PCE includes the prices of all the goods and services included in the consumption component of GDP. Because the PCE includes the prices of more goods and services than does the CPI, it’s a broader measure of inflation, which is the key reason that the Fed prefers it.)
That CPI inflation data receive more media discussion than PCE inflation data is likely due to three factors:
The CPI is more familiar to most people than the PCE. It is also the measure that politicians and political commentators tend to focus on. The media are more likely to highlight a measure of inflation that the average reader easily understands rather than a less familiar measure that would require an explanation.
The monthly report on the CPI is typically released about two weeks before the monthly report on the PCE. Therefore, if the CPI measure of inflation turns out to be higher or lower than expected, the stock and bond markets will react to this new information on the value of inflation in the previous month. If the PCE measure is roughly consistent with the CPI measure, then the release of new data on the PCE measure contains less new information and, therefore, has a smaller effect on stock and bond prices.
Over longer periods, the two measures of inflation often move fairly closely together as the following figure shows, although CPI inflation tends to be somewhat higher than PCE inflation. The values of both series are the percentage change in the index from the same month in the previous year.
Turning to the PCE data for January released in the BEA’s latest “Personal Income and Outlays” report, the PCE inflation data were broadly consistent with the CPI data: Inflation in January increased somewhat from December. The first of the following figures shows PCE inflation and core PCE inflation—which excludes energy and food prices—for the period since January 2015 with inflation measured as the change in PCE from the same month in the previous year. The second figure shows PCE inflation and core PCE inflation measured as the inflation rate calculated by compounding the current month’s rate over an entire year. (The first figure shows what is sometimes called 12-month inflation and the second figure shows 1-month inflation.)
The two inflation measures are telling markedly different stories: 12-month inflation shows a continuation in the decline in inflation that began in 2022. Twelve-month PCE inflation fell from 2.6 percent in December to 2.4 percent in January. Twelve-month core PCE inflation fell from 2.9 percent in December to 2.8 percent in December. So, by this measure, inflation continues to approach the Fed’s 2 percent inflation target.
One-month PCE and core PCE inflation both show sharp increases from December to January: From 1.4 percent in December to 4.2 percent for 1-month PCE inflation and from 1.8 percent in December to 5.1 percent in January for 1-month core PCE inflation.
The one-month inflation data are bad news in that they may indicate that inflation accelerated in January and that the Fed is, therefore, further away than it seemed in December from hitting its 2 percent inflation target. But it’s important not to overinterpret a single month’s data. Although 1-month inflation is more volatile than 12-month inflation, the broad trend in 1-month inflation had been downwards from mid-2022 through December 2023. It will take at least a more months of data to assess whether this trend has been broken.
Fed officials didn’t appear to be particularly concerned by the news. For instance, according to an article on bloomberg.com, Federal Reserve Bank of Atlanta President Raphael Bostic noted that: “The last few inflation readings—one came out today—have shown that this is not going to be an inexorable march that gets you immediately to 2%, but that rather there are going to be some bumps along the way.” Investors appear to continue to expect that the Fed will cut its target for the federal funds rate at its meeting on June 11-12.
Action Comics No. 1, published in June 1938, is often consider the first superhero comic book. (Image from comics.org.)
In a political advertisement that ran before the broadcast of the Super Bowl, President Joe Biden discussed shrinkflation, which refers to firms reducing the quantity of a product in container while keeping the price unchanged. In this post from the summer of 2022, we discussed examples of shrinkflation—including Chobani reducing the quantity of yogurt in the package shown here from 5.3 ounces to 4.5 ounces—and noted that shrinkflation complicates the job of the Bureau of Labor Statistics when compiling the consumer price index.
This yogurt remained the same price although the quantity of yogurt in the container shrank from 5.3 ounces to 4.5 ounces.
Shrinkflation isn’t new; firms have used the strategy for decades. Firms are particularly likely to use shrinkflation during periods of high inflation or during periods when the federal government implements price controls. Firms also sometimes resort to shrinkflation when the the price of a product has remained constant for long enough that the firms fear that consumers will react strongly to the firms increasing the price.
Comic books provide an interesting historical example of shrinkflation. David Palmer, a professor of management at South Dakota State University published an article in 2010 in which he presented data on the price and number of pages in copies of Action Comics from 1938 to 2010. When DC Comics introduced Superman in the first issue of Action Comics in June 1938, it started the superhero genre of comic books. Action Comics No. 1 had a price of $0.10 and was 64 pages.
After the United States entered World War II in December 1941, the federal government imposed price controls to try to limit the inflation caused by the surge in spending to fight the war. Rising costs of producing comic books, combined with the difficulty in raising prices because of the controls, led comic book publishers to engage in shrinkflation. In 1943, the publishers reduced the number of pages in their comics from 64 to 56. In 1944, the publishers engaged in further shrinkflation, reducing the number of pages from 56 to 48.
In 1951, during the Korean War, the federal government again imposed price controls. Comic book publishers responded with further shrinkflation, keeping the price at $0.10, while reducing the number of pages from 48 to 40. In 1954, they shrank the number of pages to 36, which remains the most common number of pages in a comic book today. At that time, the publishers also slightly reduced the width of comics from 7 3/4 inches to 7 1/8 inches. (Today the typical comic book has a width of 6 7/8 inches.)
By the late 1950s, comic book publishers became convinced that they would be better off raising the prices of comic books rather than further shrinking the number of pages. But they were reluctant to raise their prices because they had been a constant $0.10 for more than 20 years, so children and their parents might react very negatively to a price increase, and because no firm wanted to be the first to raise its price for fear of losing sales to its competitors. They were caught in a prisoner’s dilemma: Comic book publishers would all have been better off if they had raised their prices but the antitrust laws kept them from colluding to raise prices and no individual firm had an incentive to raise prices alone. (We discuss collusion, prisoner’s dilemmas, and other aspects of oligopolistic firm behaviour in Chapter 14 of Microeconomics and Economics.)
The most successful publisher in the 1950s was Dell, which sold very popular comic books featuring Donald Duck, Uncle Scrooge, and other characters that particularly appealed to younger children. Because the prices of Dell’s comic books, like those of other publishers, been unchanged at $0.10 since the late 1930s, the firm didn’t have a clear idea of the price elasticity of demand for its comics. In 1957, the firm’s managers decided to use a market experiment to gather data on the price elasticity of demand. In most cities, Dell kept the price of its comics at $0.10, but in some cities it sold the identical comics at a price of $0.15.
The experiment lasted from March 1957 to August 1958 when the company discontinued it by reverting to selling all of its comics for $0.10. Although we lack the data necessary to compare the sales of Dell comics with a $0.15 price to the sales of Dell comics with a $0.10 price, the fact that no other publisher raised its prices during that period and that Dell abandoned the experiment indicates that the demand curve for Dell’s comics was price elastic—the percentage decline in the quantity sold was greater than the 50 percent increase in price—so Dell’s revenue from sales in the cities selling comics with a price of $0.15 likely declined. Dell’s strategy can be seen as a failed example of price leadership. (We discuss the relationship between the price elasticity of demand for a good and the total revenue a firm earns from selling the good in Chapter 6, Section 6.3 of Microeconomics and Economics. We discuss price leadership in Microeconomic and Economics, Chapter 14, Section 14.2.)
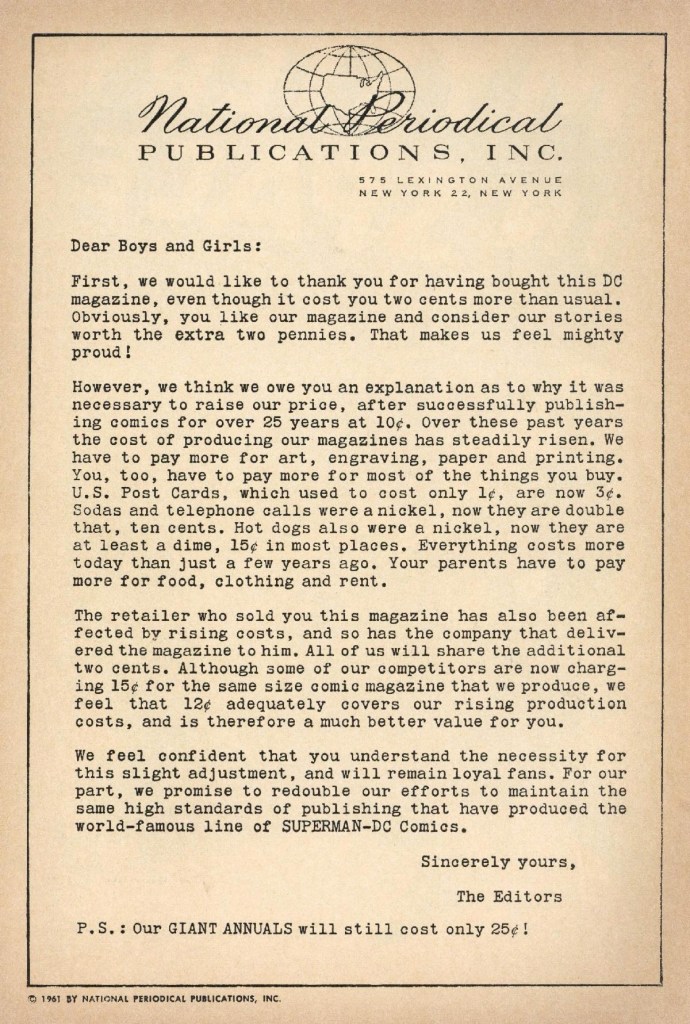
In March 1961, Dell increased the price of all of its comics from $0.10 to $0.15. At first, Dell’s competitors kept the prices of their comics at $0.10. As a result, in September 1961, Dell cut the price of its comics from $0.15 to $0.12. By early 1962, Dell’s competitors, including DC Comics, Marvel Comics—publishers of Spider-Man and the Fantastic Four—along with several smaller publishers, had increased the prices of their comics from $0.10 to $0.12. The managers at DC decided that raising the price of comics after having kept it constant for so long required an explantion. Accordingly, they printed the following letter in each of their comics.
H/T to Buddy Saunders for the image.
Comic book publishers have raised their prices many times since the early 1960s, with most comics currently having a price of $4.99. During the recent period of high inflation, comic publishers did not use a strategy of shrinkflation perhaps because they believe that 36 pages is the minimum number that buyers will accept.
The first 25 years of the comic book industry represents an interesting historical example of shrinkflation.
As we’ve discussed in several blog posts (for instance, here and here), recent macro data have been consistent with the Federal Reserve being close to achieving a soft landing. The Fed’s increases in its target for the federal funds rate have slowed the growth of aggregate demand sufficiently to bring inflation closer to the Fed’s 2 percent target, but haven’t, to this point, slowed the growth of aggregate demand so much that the U.S. economy has been pushed into a recession.
By January 2024, many investors in financial markets and some economists were expecting that at its meeting on March 19-20, the Fed’s Federal Open Market Committee would be cutting its target for the federal funds. However, members of the committee—notably, Chair Jerome Powell—have been cautious about assuming prematurely that inflation had, in fact, been brought under control. In fact, in his press conference on January 31, following the committee’s most recent meeting, Powell made clear that the committee was unlikely to reduce its target for the federal funds rate at its March meeting. Powell noted that “inflation is still too high, ongoing progress in bringing it down is not assured, and the path forward is uncertain.”
Powell’s caution seemed justified when, on February 2, the Bureau of Labor Statistics (BLS) released its most recent “Employment Situation Report” (discussed in this post). The report’s data on growth in employment and growth in wages, as measured by the change in average hourly earnings, might be indicating that aggregate demand is growing too rapidly for inflation to continue to decline.
The BLS’s release today (February 13) of its report on the consumer price index (CPI) (found here) for January provided additional evidence that the Fed may not yet have put inflation on a firm path back to its 2 percent target. The average forecast of economists surveyed before the release of the report was that the increase in the version of the CPI that includes the prices of all goods and services in the market basket—often called headline inflation—would be 2.9 percent. (We discuss how the BLS constructs the CPI in Macroeconomics, Chapter 9, Section 19.4, Economics, Chapter 19, Section 19.4, and Essentials of Economics, Chapter 3, Section 13.4.) As the following figure shows, headline inflation for January was higher than expected at 3.1 percent (measured by the percentage change from the same month in the previous year), while core inflation—which excludes the prices of food and energy—was 3.9 percent. Headline inflation was lower than in December 2023, while core inflation was almost unchanged.
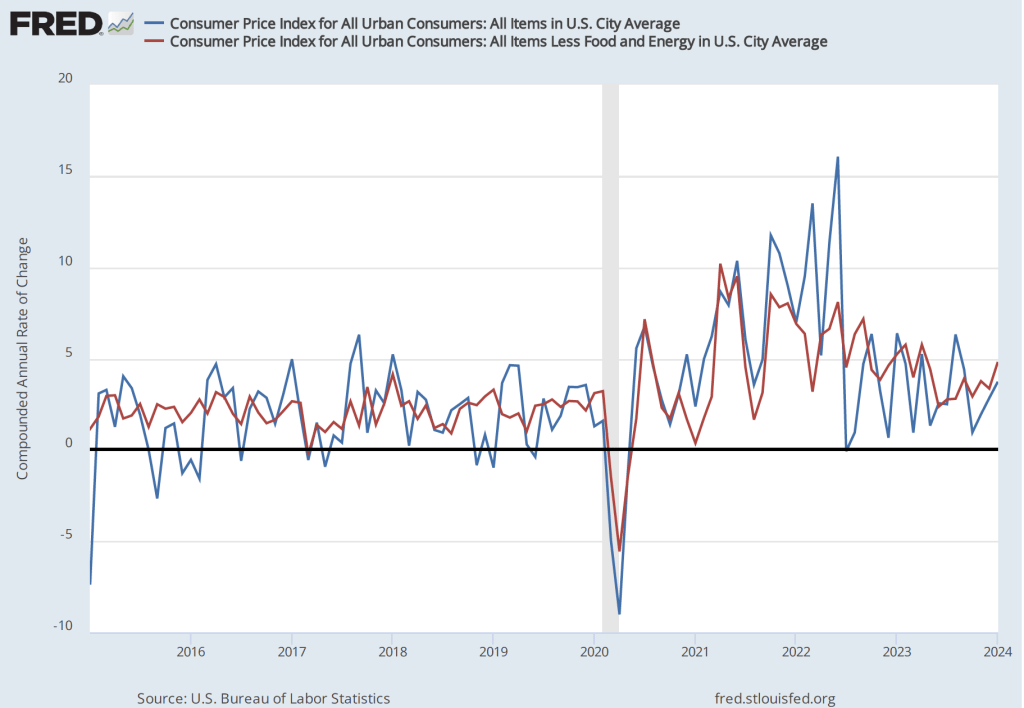
Although the values for January might seem consistent with a gradual decline in inflation, that conclusion may be misleading. Headline inflation in January 2023 had been surprisingly high at 6.4 percent. Hence, the comparision between the value of the CPI in January 2024 with the value in January 2023 may be making the annual CPI inflation rate seem artificially low. If we look at the 1-month inflation rate for headline and core inflation—that is the annual inflation rate calculated by compounding the current month’s rate over an entire year—the values are more concerning, as indicated in the following figure. Headline CPI inflation is 3.7 percent and core CPI inflation is 4.8 percent.
Even more concerning is the path of inflation in the prices of services. Chair Powell has emphasized that as supply chain problems have gradually been resolved, inflation in the prices of goods has been rapidly declining. But inflaion in services hasn’t declined nearly as much. Last summer he stated the point this way:
“Part of the reason for the modest decline of nonhousing services inflation so far is that many of these services were less affected by global supply chain bottlenecks and are generally thought to be less interest sensitive than other sectors such as housing or durable goods. Production of these services is also relatively labor intensive, and the labor market remains tight. Given the size of this sector, some further progress here will be essential to restoring price stability.”
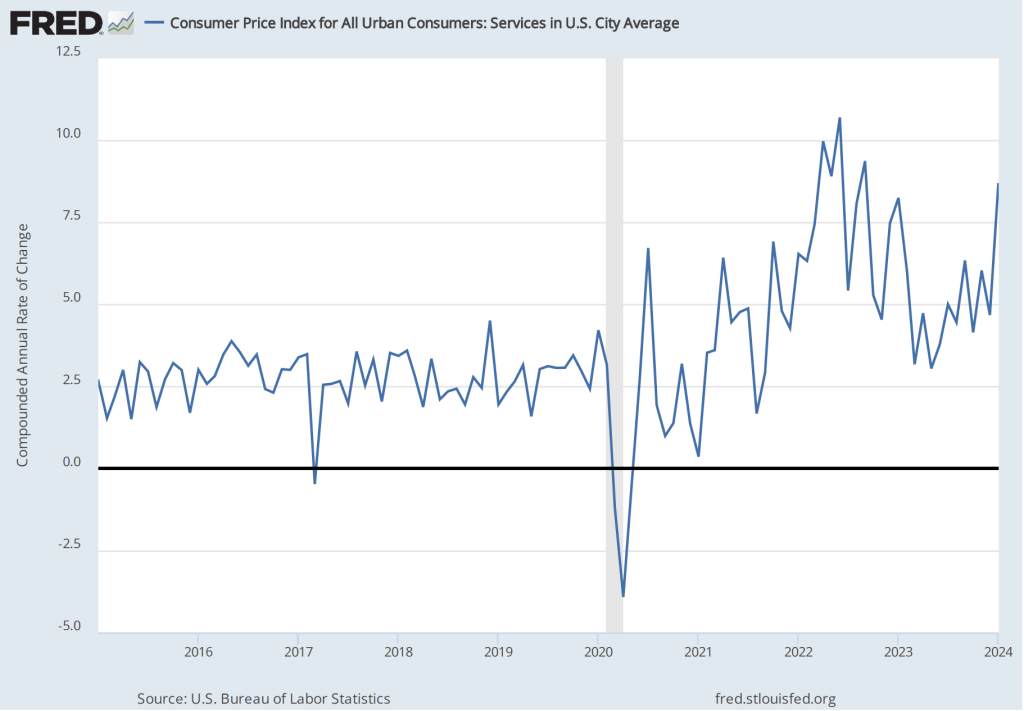
The following figure shows the 1-month inflation rate in services prices. The figure shows that inflation in services has been above 4 percent in every month since July 2023. Inflation in services was a very high 8.7 percent in January. Clearly such large increases in the prices of services aren’t consistent with the Fed meeting its 2 percent inflation target.
How should we interpret the latest CPI report? First, it’s worth bearing in mind that a single month’s report shouldn’t be relied on too heavily. There can be a lot of volatility in the data month-to-month. For instance, inflation in the prices of services jumped from 4.7 percent in December to 8.7 percent in January. It seems unlikely that inflation in the prices of services will continue to be over 8 percent.
Second, housing prices are a large component of service prices and housing prices can be difficult to measure accurately. Notably, the BLS includes in its measure the implicit rental price that someone who owns his or her own home pays. The BLS calculates that implict rental price by asking consumers who own their own homes the following question: “If someone were to rent your home today, how much do you think it would rent for monthly, unfurnished and without utilities?” (The BLS discusses how it measures the price of housing services here.) In practice, it may be difficult for consumers to accurately answer the question if very few houses similar to theirs are currently for rent in their neighborhood.
Third, the Fed uses the personal consumption expenditures (PCE) price index, not the CPI, to gauge whether it is achieving its 2 percent inflation target. The Bureau of Economic Analysis (BEA) includes the prices of more goods and services in the PCE than the BLS includes in the CPI and measures housing services using a different approach than that used by the BLS. Although inflation as measured by changes in the CPI and as measured by changes in the PCE move roughly together over long periods, the two measures can differ significantly over a period of a few months. The difference between the two inflation measures is another reason not to rely too heavily on a single month’s CPI data.
Despite these points, investors on Wall Street clearly interpreted the CPI report as bad news. Investors have been expecting that the Fed will soon cut its target for the federal funds rate, which should lead to declines in other key interest rates. If inflation continues to run well above the Fed’s 2 percent target, it seems likely that the Fed will keep its federal funds target at its current level for longer, thereby slowing the growth of aggregate demand and raising the risk of a recession later this year. Accordingly, the Dow Jones Industrial Average declined by more than 500 points today (February 13) and the interest rate on the 10-year Treasury note rose above 4.3 percent.
The FOMC has more than a month before its next meeting to consider the implications of the latest CPI report and the additional macro data that will be released in the meantime.