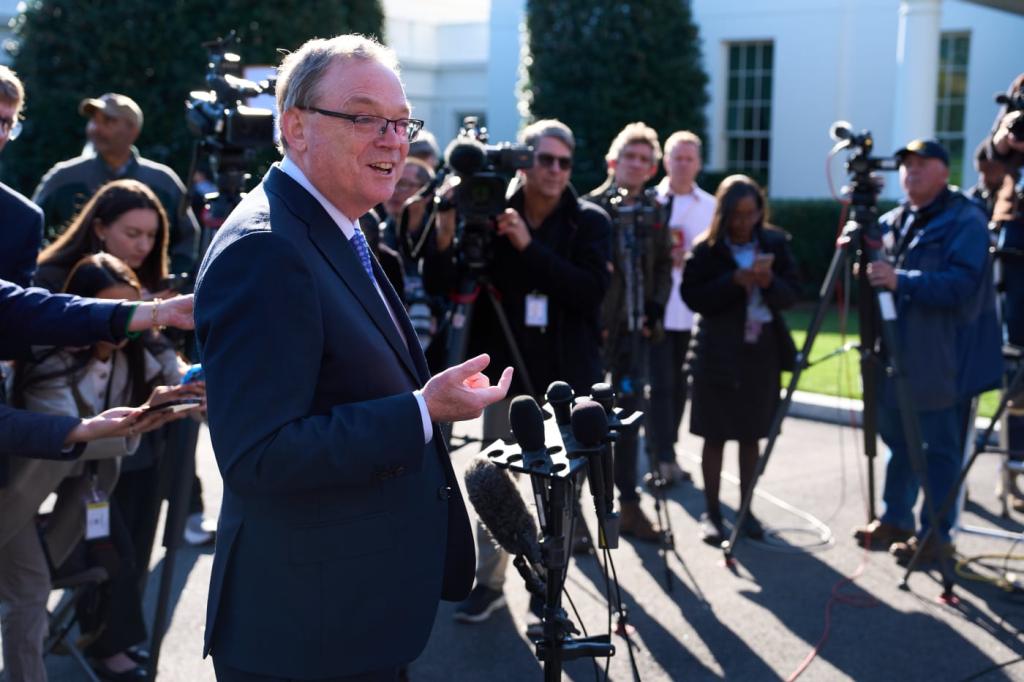
Kevin Hassett, director of the National Economic Council (photo from the AP via the Wall Street Journal)
Jerome Powell’s second term as chair of the Federal Reserve’s Board of Governor ends on May 15,2026. (Although his term as a member of the Board of Governors doesn’t end until January 31, 2028, Fed chairs have typically resigned their seats on the Board at the time that their term as chair ends.) President Trump has been clear that he won’t renominate Powell to a third term. Who will he nominate?
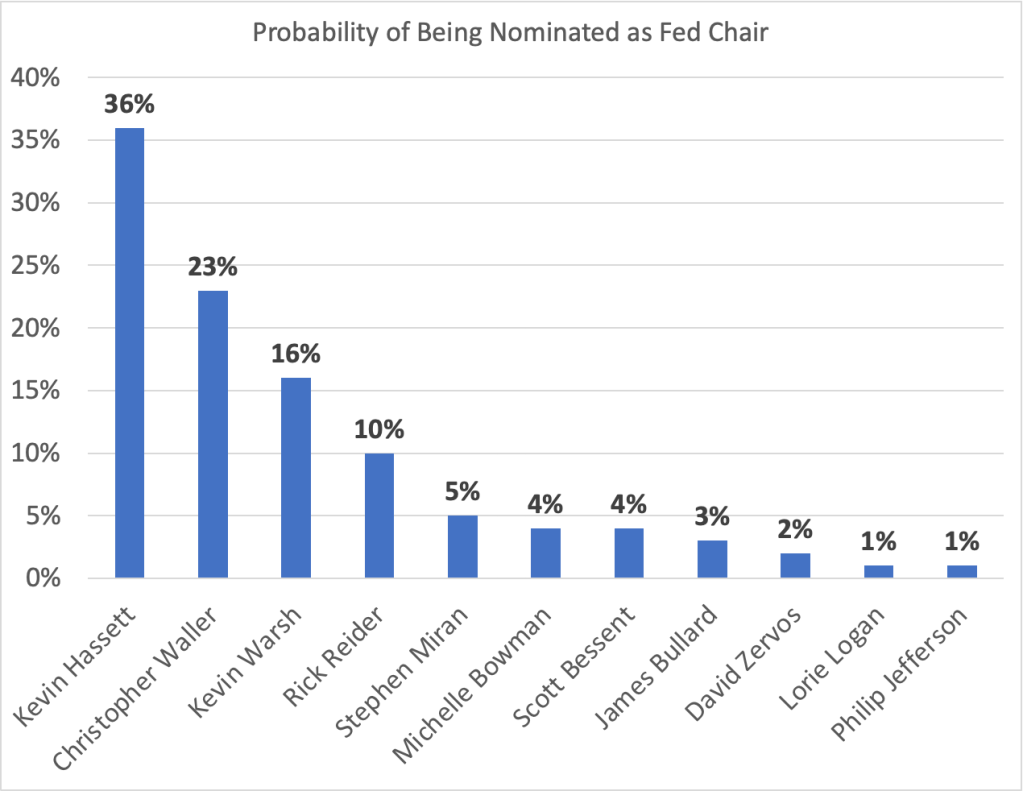
Polymarket is a site on which people can bet on political outcomes, including who President Trump will choose to nominate as Fed chair. The different amounts wagered on each candidate determine the probabilities bettors assign to that candidate being nominated. The following table shows each candidate with a probability of least 1 percent of being nominated as of 5 pm eastern time on October 27.
Kevin Hassett, who is currently the director of the National Economic Council, has the highest probability at 36 percent. Fed Governor Christopher Waller, who was nominated to the Board by President Trump in 2020, is second with a 23 percent probability. Kevin Warsh, who served on the Board from 2006 to 2011, and was important in formulating monetary policy during the financial crisis of 2007–2009, is third with a probability of 16 percent. Rick Reider, an executive at the investment company Black Rock, is unusual among the candidates in not having served in government. Bettors on Polymarket assign him a 10 percent probability of being nominated. Stephen Miran and Michelle Bowman are current members of the Board who were nominated by President Trump.
Scott Bessent is the current Treasury secretary and has indicated that he doesn’t wish to be nominated. James Bullard served as president of the Federal Reserve Bank of St. Louis from 2008 to 2023. David Zervos is an executive at the Jeffries investment bank and in 2009 served as an adviser to the Board of Governors. Lorie Logan is president of the Federal Reserve Bank of Dallas and Philip Jefferson is currently vice chair of the Board of Governors.
Today, Treasury Secretary Scott Bessent indicated that the list of candidates had been reduced to five—although bettors on Polymarket indicate that they believe these five are likely to be the first five candidates listed in the chart above, it appears that Bowman, rather than Miran, is the fifth candidate on Bessent’s lists. Bessent indicated that President Trump will likely make a decision on who he will nominate by the end of the year.
As we’ve noted in recent blog posts (here and here), the shutdown of the federal government has interrupted the release of government data, including the “Employment Situation” report prepared monthly by the Bureau of Labor Statistics (BLS). The federal government made an exception for the BLS report on the consumer price index (CPI) because annual cost-of-living increases in Social Security payments are determined by the average inflation rate in the CPI during July, August, and September.
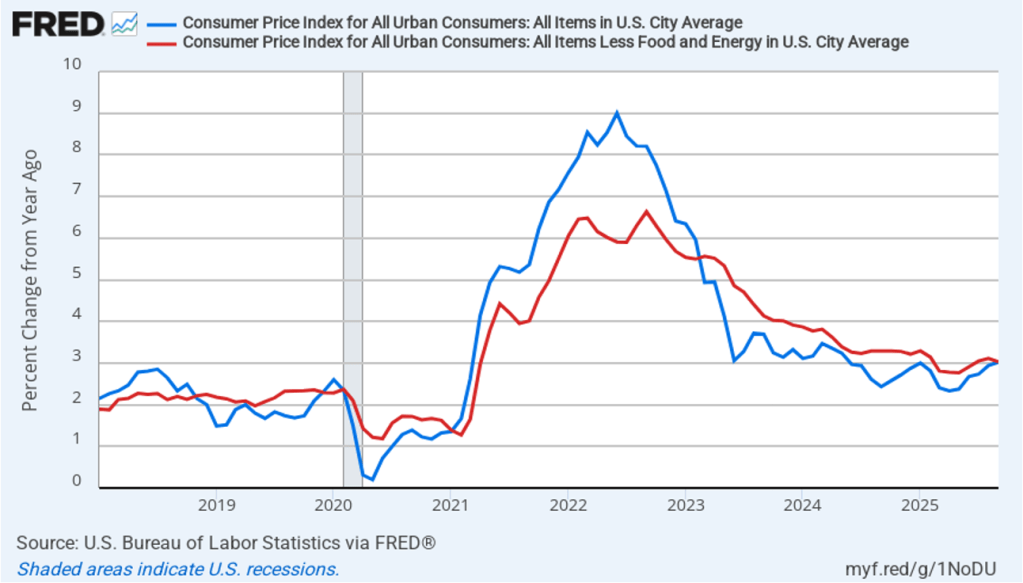
Accordingly, today (October 24), the Bureau of Labor Statistics (BLS) released its report on the consumer price index (CPI) for September. The following figure compares headline CPI inflation (the blue line) and core CPI inflation (the red line).
The headline inflation rate, which is measured by the percentage change in the CPI from the same month in the previous year, was 3.0 percent in September, up from 2.9 percent in August.
The core inflation rate,which excludes the prices of food and energy, was also 3.0 percent in September, down slightly from 3.1 percent in August.
Headline inflation and core inflation were both slightly lower than the 3.1 rate for both measures that economists had expected.
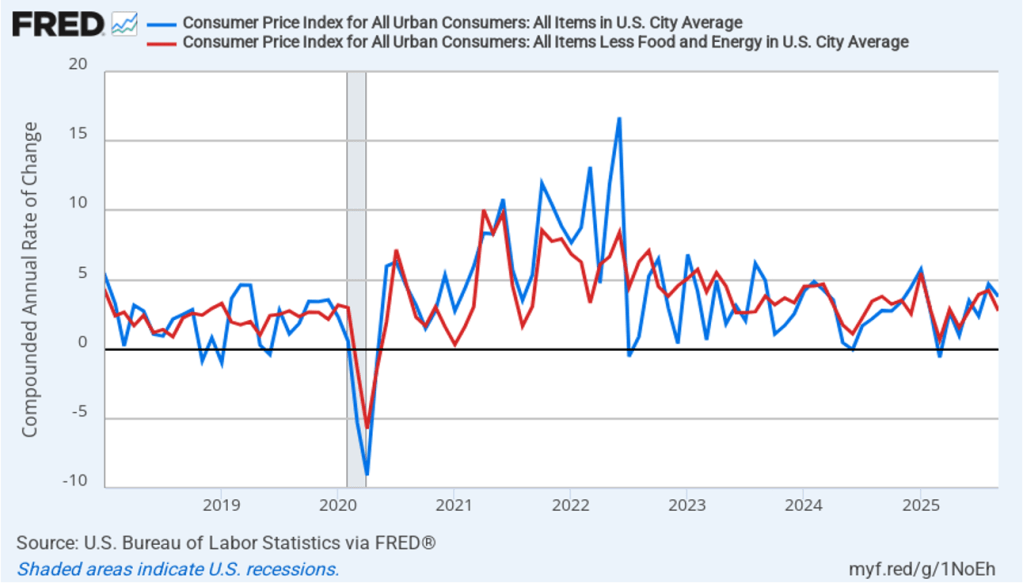
In the following figure, we look at the 1-month inflation rates for headline and core inflation—that is the annual inflation rate calculated by compounding the current month’s rate over an entire year. Calculated as the 1-month inflation rate, headline inflation (the blue line) declined from the very high rate of 4.7 percent in August to the still high rate of 3.8 percent in September. Core inflation (the red line) declined from 4.2 percent in August to 2.8 percent in September.
The 1-month and 12-month inflation rates are both indicating that inflation remains well above the Fed’s 2 percent annual inflation target in September. Core inflation—which is often a good indicator of future inflation—in particular has been running well above target during the last three months.
Of course, it’s important not to overinterpret the data from a single month. The figure shows that the 1-month inflation rate is particularly volatile. Also note that the Fed uses the personal consumption expenditures (PCE) price index, rather than the CPI, to evaluate whether it is hitting its 2 percent annual inflation target.
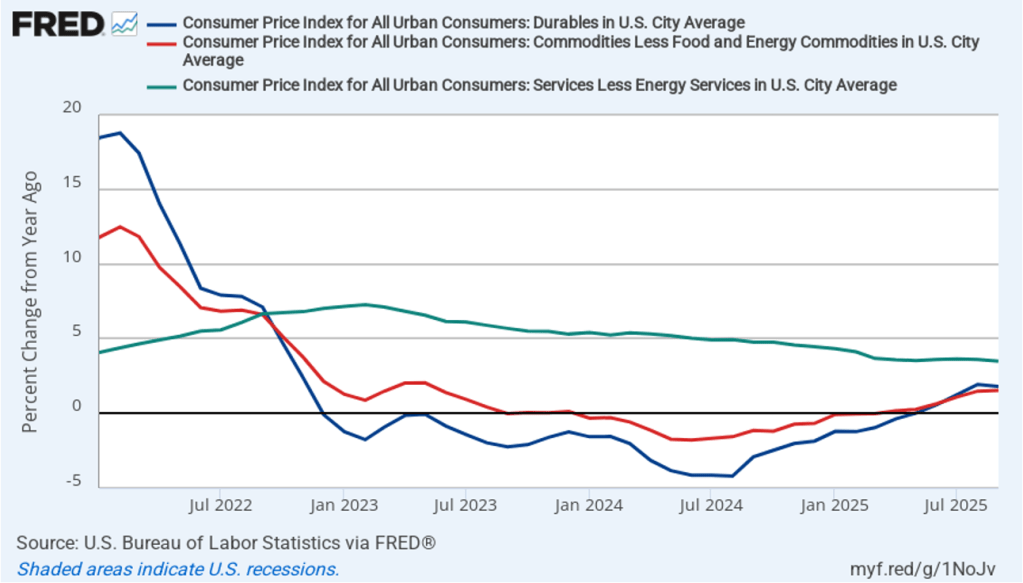
Does the increase in inflation represent the effects of the increases in tariffs that the Trump administration announced on April 2? (Note that many of the tariff increases announced on April 2 have since been reduced.) The following figure shows 12-month inflation in durable goods—such as furniture, appliances, and cars—which are likely to be affected directly by tariffs, all core goods, and core services. Services are less likely to be affected by tariffs.. To make recent changes clearer, we look only at the months since January 2022. In August, inflation in durable goods declined slightly to 1.8 percent in September from 1.9 percent in August. Inflation in core goods was unchanged in September at 1.5 percent. Inflation in core services fell slightly in September to 3.5 percent from 3.6 percent in August.
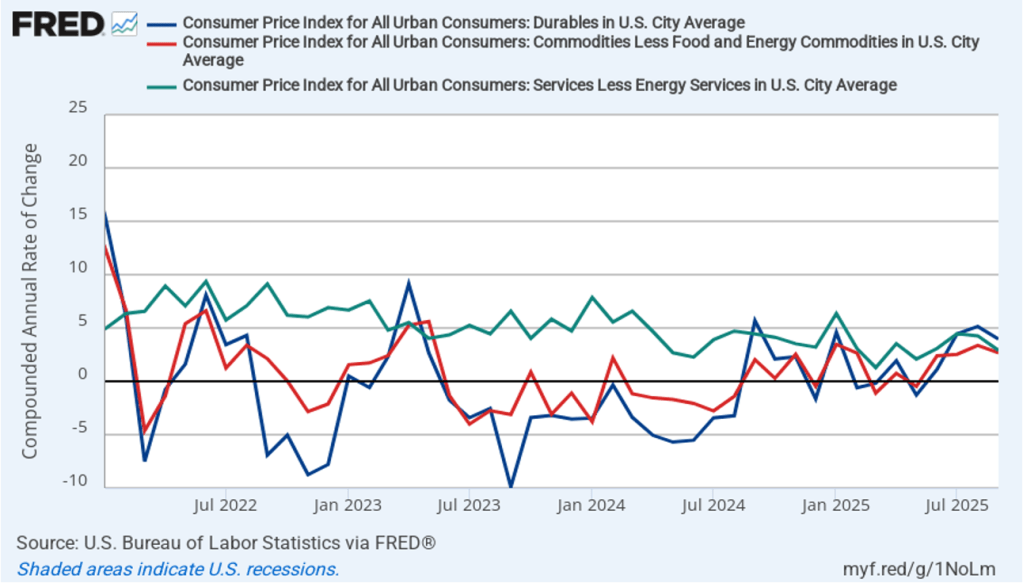
The following figure shows 1-month inflation in the prices of these products, which may makes clearer the effects of the tariff increases. In September, durable goods inflation was a high 4.0 percent, although down from 5.1 percent in August. Core goods inflation in September was 2.7 percent, down from 3.4 percent in August. Core service inflation was 2.9 percent in August, down from 4.3 percent in August.
To better estimate the underlying trend in inflation, some economists look at median inflation and trimmed mean inflation.
Median inflation is calculated by economists at the Federal Reserve Bank of Cleveland and Ohio State University. If we listed the inflation rate in each individual good or service in the CPI, median inflation is the inflation rate of the good or service that is in the middle of the list—that is, the inflation rate in the price of the good or service that has an equal number of higher and lower inflation rates.
Trimmed-mean inflation drops the 8 percent of goods and services with the highest inflation rates and the 8 percent of goods and services with the lowest inflation rates.
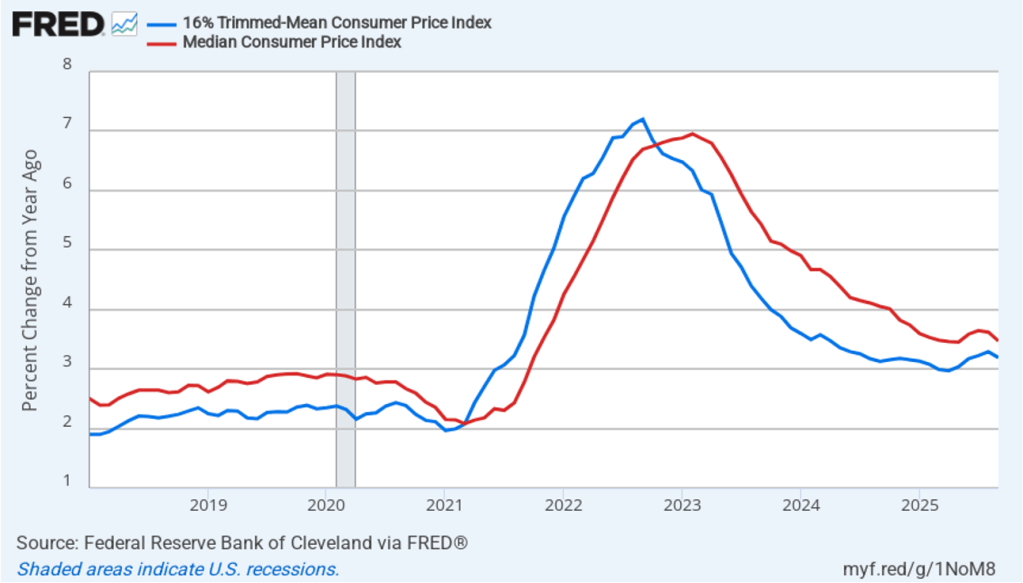
The following figure shows that 12-month trimmed-mean inflation (the blue line) was 3.2 percent in September, down slightly from 3.3 August. Twelve-month median inflation (the red line) 3.5 percent in September, down slightly from 3.6 in August.
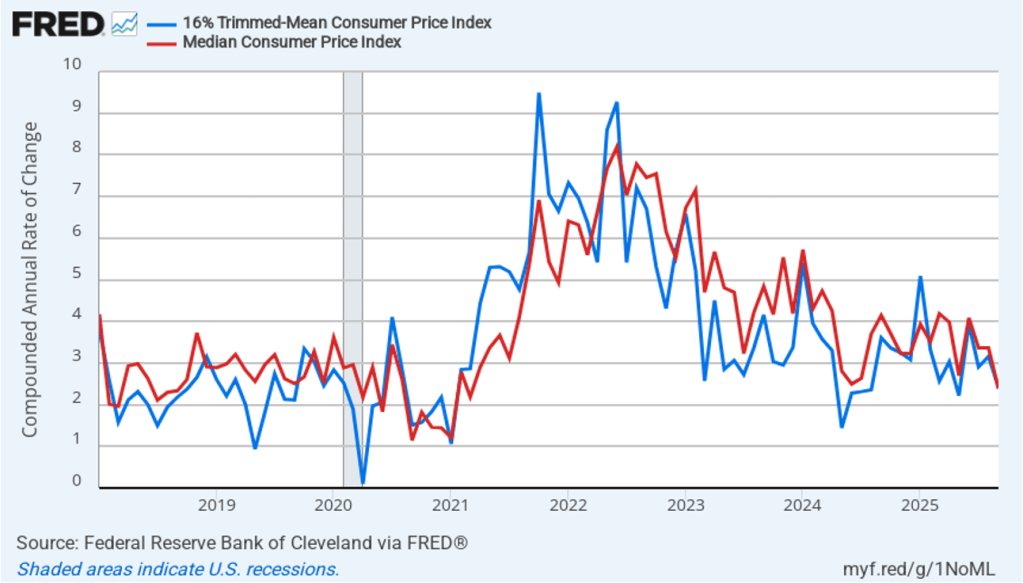
The following figure shows 1-month trimmed-mean and median inflation. One-month trimmed-mean inflation declined from 3.2 percent in August to 2.4 percent in September. One-month median inflation declined from 3.4 percent in August to 2.4 percent in September. These data are consistent with the view that inflation is still running above the Fed’s 2 percent target.
With inflation running above the Fed’s 2 percent annual target, we wouldn’t typically expect that the Fed’s policymaking Federal Open Market Committee (FOMC) would cut its target for the federal funds rate at its October 28–29 meeting. At this point, though, it seems likely that the FOMC will “look through” the higher inflation rates of the last few months because the higher rates may be largely attributable to one-time price increases caused by tariffs. Committee members have signaled that they are likely to cut their target for the federal funds rate by 0.25 percentage point (25 basis points) at the conclusion of next week’s meeting.
This morning, investors who buy and sell federal funds futures contracts assign a probability of 96.7 percent to the FOMC cutting its target for the federal funds rate at that meeting by 25 basis points from its current target range of 4.00 percent to 4.25 percent. Investors assign a 95.9 percent probability of the committee cutting its target by an additional 25 basis points to 3.50 percent to 3.75 percent at its December 9–10 meeting. If persistently high inflation rates reflect more than just the temporary effects of tariffs, these rate cuts will make it unlikely that the Fed will reach its 2 percent inflation target anytime soon.
Fed Governor Christopher Wallace on October 21, 2025 at the Fed’s Payment Innovation Conference (photo from federalreserve.gov)
The current partial shutdown of the federal government has delayed the release by the Bureau of Labor Statistics (BLS) of its “Employment Situation” report (often called the “jobs report”). The report had originally been scheduled to be released on October 3. In a recent blog post we discussed how well the employment data collected by the private payroll processing firm Automatic Data Processing (ADP) serves as an alternative measure of the state of the labor market. In that post we showed that ADP data on total private payroll employment tracks fairly well the BLS data on total private employment from its establishment survey (often called the payroll survey) .
An article in today’s Wall Street Journal reports that ADP has stopped providing the Fed with early access to its data. Apparently, as a public service ADP had been providing its data to the Fed a week before the data was publicly released. The article notes that ADP stopped providing the data soon after this speech delievered by Fed Governor Christopher Wallace in late August. In a footnote to the speech Wallace refers to “data that Federal Reserve staff maintains in collaboration with the employment services firm ADP.” The article points out, though, that Waller’s speech was only one of several times since 2019 that a Fed official has publicly mentioned receiving data from ADP.
Losing early access to the ADP data comes at a difficult time for the Fed, given that the BLS employment data are not available. In addition, the labor market has shown signs of weakening even though growth has remained strong in measures of output. If payroll employment has been falling, rather than growing slowly as it was in the August jobs report, that knowledge would affect the deliberations of the Fed’s policymaking Federal Open Market Committee (FOMC) at its next meeting on October 28–29. Serious deterioration in the labor market could lead the FOMC to cut its target for the federal funds rate by more than the expected 0.25 percentage point (25 basis points).
In a speech in 2019, Fed Chair Jerome Powell noted that the Fed staff had used ADP data to develop a new measure of payroll employment. Had that measure been available in 2008, Powell argued, the FOMC would have realized earlier than it did that employment was being severely affected by the deepening of the financial crisis:
“[I]n the first eight months of 2008, as the Great Recession was getting underway, the official monthly employment data showed total job losses of about 750,000. A later benchmark revision told a much bleaker story, with declines of about 1.5 million. Our new measure, had it been available in 2008, would have been much closer to the revised data, alerting us that the job situation might be considerably worse than the official data suggested.”
The Wall Street Journal article notes that Powell has urged ADP to resume sharing its employment data with the Fed.
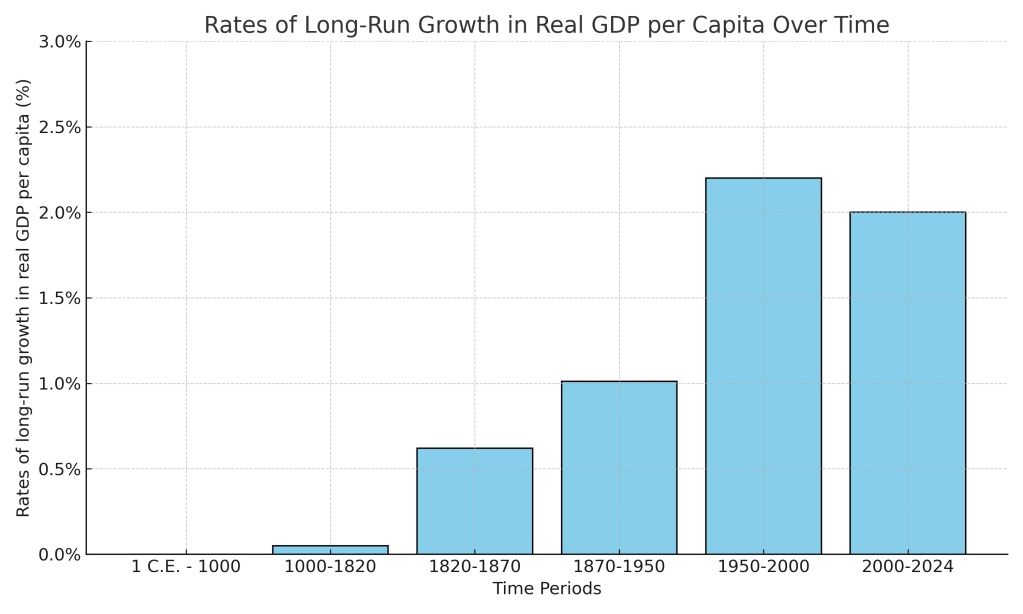
For most of human history there was little to no economic growth. Until the nineteenth century, the average person everywhere in the world lived at a subsistence level. For example, although the Roman Empire controlled most of Southern and Western Europe, the Near East, and North Africa for more than 400 years, the living standard of the average citizen of the Empire was no higher at the end of the Empire than it had been at the beginning.
Economists typically measure economic growth by the rate of increase in real GDP per capita. The following figure, updated from Chapter 11 of Macroeconomics (Chapter 21 of Economics), shows the slow pace of growth in real GDP per capita in the world economy from the year 1 to the year 1820 and the much faster rates of growth over the following periods. As discussed in Chapter 11, the figure relies on data compiled by Angus Maddison of University of Groningen in the Netherlands and—for recent years—data from the World Bank.
This year’s three Nobelists have contributed to understanding why economic growth accelerated sharply in the nineteenth century and why England was the first country to experienced sustained increases in real GDP per capita—an event labeled the Industrial Revolution. Joel Mokyr of Northwestern University has conducted decades of research into which innovations were crucial to economic growth and the institutional and economic advantages that allowed entrepreneurs in England to use those innovations to expand production much more rapidly than had happened before. Philippe Aghion of Collège de France and INSEAD and Peter Howitt of Brown University have focused on formally modeling the process of creative destruction that underlies sustained economic growth. The classic discussion of creative destruction appears in Joseph Schumpeter’s book Capitalism, Socialism, and Democracy, published in 1942.
In Macroeconomics Chapter 21, we discuss the process of creative destruction in the context of economic growth. Creative destruction occurs as technological change results in new products that drive firms producing older products out of business. Examples are automobiles driving out of business producers of horse-drawn carriages in the early twentieth century. Or Netflix and other movie streaming sites driving video rental stores out of business in more recent years.
The Nobel Committee’s announcement of the prize can be found here. A longer discussion of the Nobelists’ work can be found here. The scope of their research can be seen by reviewing their curricula vitae, which can be found here, here, and here. The amount of the prize this years is 11 million Swedish kronor (about $1.2 million). Mokyr receives half and Aghion and Howitt receive the other half.
Beginning in 1933, under the Federal Reserve’s Regulation Q, commercial banks were prohibited from paying interest on checking account deposits. As we discuss in Money, Banking, and the Financial System, Chapter 12, Section 12.4, in 1980 Congress allowed banks to pay interest on Negotiable Order of Withdrawal (NOW) accounts. Because NOW accounts effectively functioned as checking accounts, many people moved funds out of checking accounts and into NOW accounts.
Once NOW accounts were available, a bank could try to attract deposits by offering higher interest rates. But what did a bank do to attract deposits prior to 1980 when it couldn’t legally pay interest? Many banks offered rewards, such as toasters, clock radios, or other small appliances, to people who opened a new checking account or made a large deposit. Banks heavily advertised these rewards on television and radio and in newspapers. The 1960s and 1970s are sometimes called “the free-toaster era” in banking. For example, in 1973, the Marquette National Bank placed this advertisement in a local Minneapolis newspaper offering a variety of gifts to anyone depositing $250 or more in a checking account.
In 1977, a bank in Morton Grove, Illinois offered candy bowls and ashtrays to people opening new accounts.
Congress authorized NOW accounts because as interest rates rose during the 1970s—despite the offers of free gifts—banks were losing deposits to money market mutual funds and other short-term financial assets such as Treasury bills. Today, banks are afraid that they will lose deposits to cryptocurrencies, particularly stablecoins. As we discuss in this blog post, stablecoins are a type of cryptocurrency—bitcoin is the best-known cryptocurrency—that can be bought and sold for a constant number of units of a currency, usually U.S. dollars. Typically, one stablecoin can be exchanged for one dollar.
In July 2025, Congress passed and President Trump signed the Guiding and Establishing National Innovation for U.S. Stablecoins Act (Genius Act) to provide a regulatory framework for stablecoins. Firms issuing stablecoins earn income on the assets, such as Treasury bills and money market funds that invest in Treasury bills, that they are required to hold to back the stablecoins they issue. But a provision of the Act bars issues of stablecoins from paying interest to holders of stablecoins. So, stablecoin issuers can’t copy the strategy of banks by paying interest to attract deposits and funding the interest on deposits with the interest earnings on their assets.
To this point, few people are buying stablecoins unless they intend to use them in buying and selling bitcoin and other cryptocurrencies or unless they need a convenient way to transfer funds across national borders. Some of these international transfers are related to drug dealing and other illegal activities. Because few retail firms—either brick-and-mortar or online—are equipped to accept stablecoins in payment for goods and services, and because stablecoins pay no interest, most households and firms don’t see stablecoins as good substitutes for checking accounts in banks.
As we discuss in Chapter 12 of Money, Banking, and the Financial System, when the federal government adopts new financial regulations, like the Genius Act, financial firms often respond by attempting to evade the regulations. People buy and sell cryptocurrencies on exchanges, such as Coinbase. Circle issues the stablecoin USDC and has agreed to pay Coinbase some of the interest it earns on Circle’s assets. As the following screenshot from the Coinbase site shows, Coinbase offers to pay interest to anyone who holds USDC on the Coinbase site.
Screenshot
An article in the Wall Street Journal notes that: “The result is something that critics say looks a lot like a yield-bearing stablecoin. Coinbase says the reward program is separate from its revenue-sharing deal with Circle.” If other stablecoins attract funds by offering interest payments in this indirect way and if more retailers begin to accept stablecoins as payment for goods and services—which they have an incentive to do to avoid the 1 percent to 3 percent fee that credit card issuers charge retailers on purchases—banks stand to lose trillions in deposits.
Smaller banks, often called community banks, might be most at risk from deposit outflows because they are more reliant on deposits to fund their investments than are larger banks. As we discuss in Money, Banking, and the Financial System, Chapter 9, community banks practice relationship banking by using private information to assess the credit risk involved in lending to local borrowers, such as car dealers and restaurants. Many large banks believe that the transaction costs involved in evaluating risk on small business loans make such loans unprofitable. So the disappearance of many community banks may make it more difficult for small businesses to access the credit they need to operate.
The Bank Policy Institute (BPI), which lobbies on behalf of the banking industry, argues that:
“Stablecoin issuers want to engage in banking activities, like paying interest. Being a bank requires the full suite of regulatory requirements, deposit insurance and discount window access that keep banks safe. Stablecoins seeking to offer banking services must be subject to those requirements and protections, rather than using workarounds and backdoors to pay interest, take deposits and access the federal payment rails.”
BPI urges Congress to eliminate the ability of Coinbase and other crypto exhanges to help stablecoin issuers evade the prohibition on paying interest.
If the prohibition on stablecoin issuers paying interest is tightened, how else might issuers attract people to invest in stablecoins? Well, there’s always free toasters!
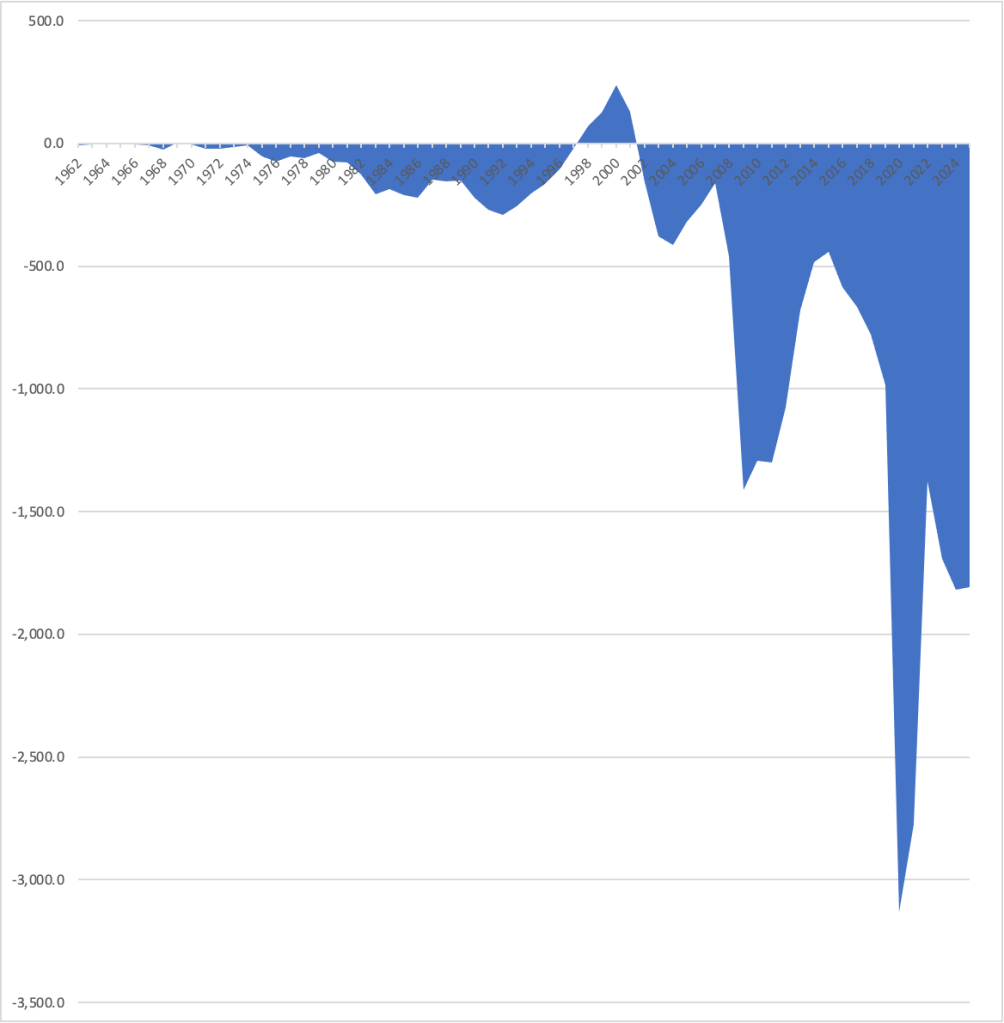
The federal government’s fiscal year runs from October 1 to September 30. Today (October 8), the Congressional Budget Office (CBO) released its estimate of the deficit for the fiscal year ending September 30, 2025. The deficit fell slightly from $1,817 billion in 2024 to $1,809 in 2025. As the following figure shows, the budget deficit in 2025 remains very large, particularly at a time when the U.S. economy is at or very close to full employment, although well below the record deficit of $3,133 billion in 2020.
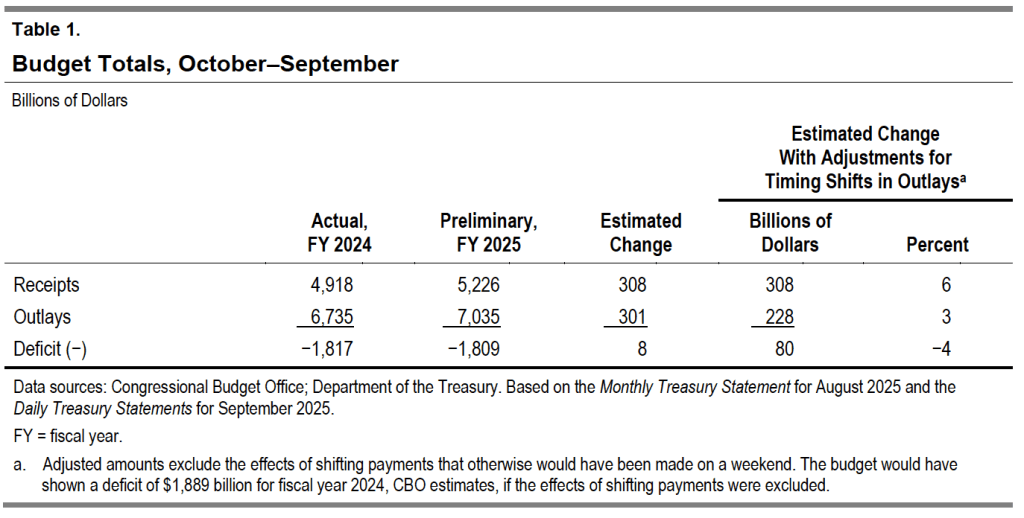
The following table from the CBO report shows that in 2025 federal receipts increased slightly more than federal outlays, leading to a slightly smaller deficit.
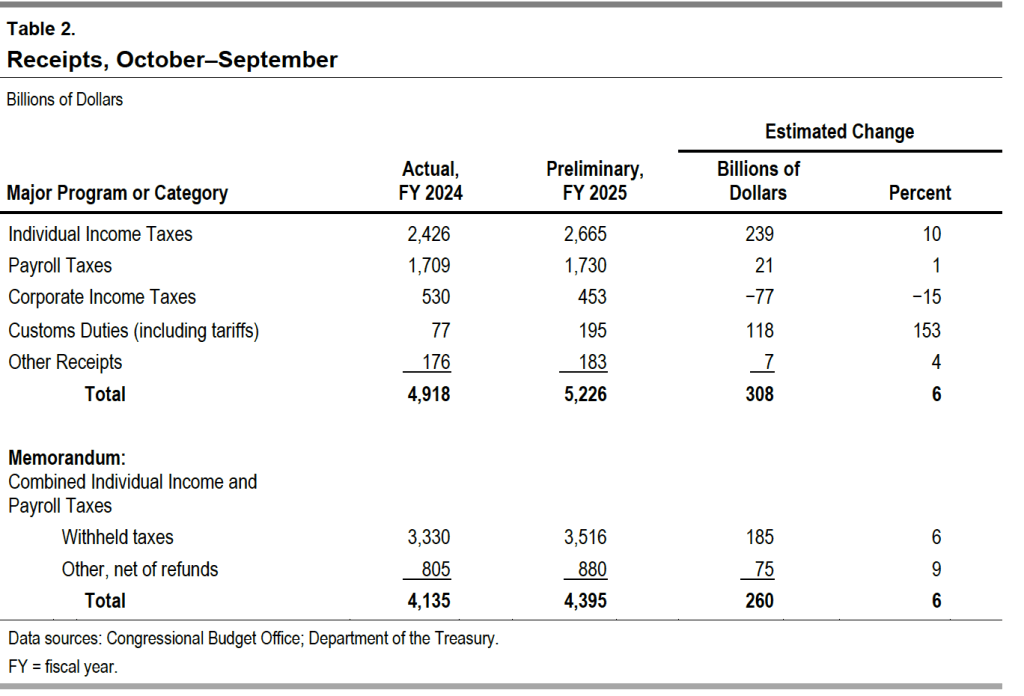
The next table shows the changes in the major categories of federal receipts. Individual income and payroll taxes—which fund the Social Security and Medicare programs, as well as the federal government’s contributions to state unemployment insurance plans—both increased, while corporate income tax receipts fell. The biggest change was in custom duties, which more than doubled following the Trump administration’s sharp increase in tariff rates beginning on April 2.
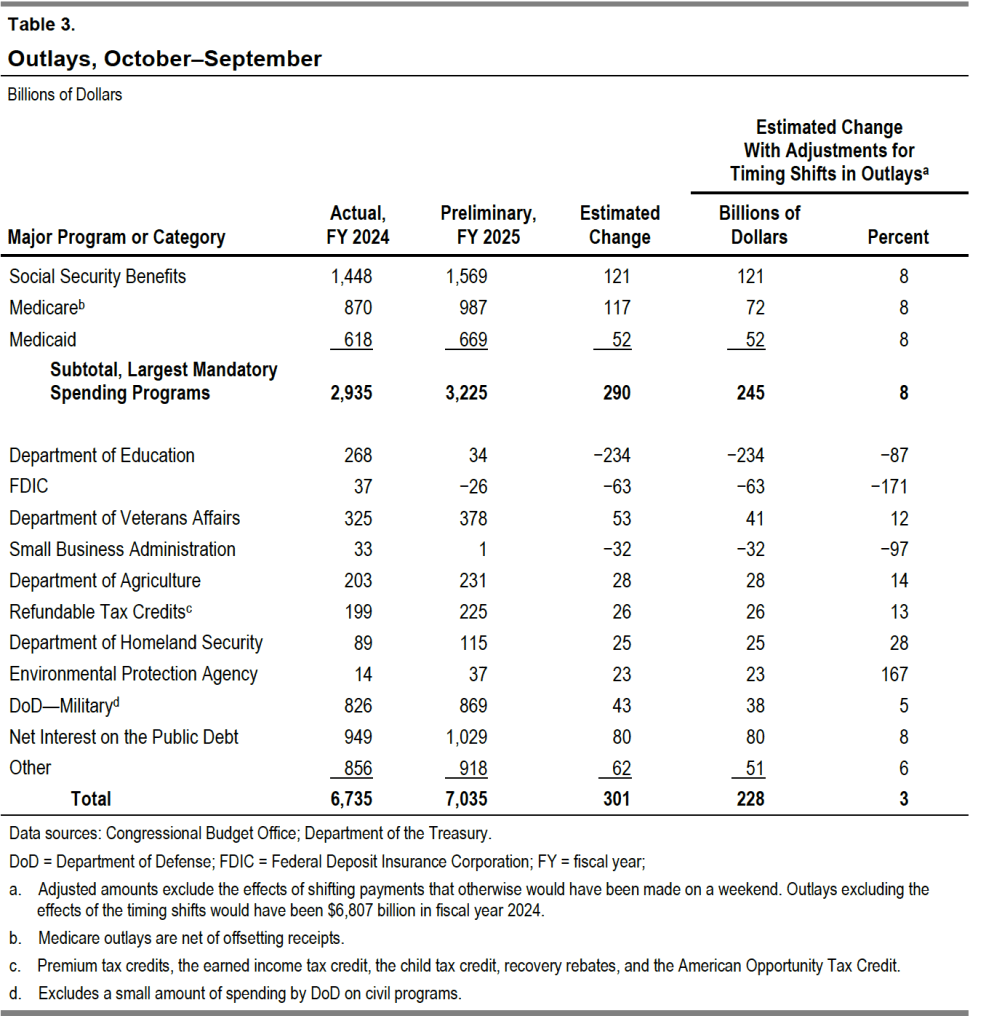
The next table shows the changes in the major categories of federal outlays. Spending on the Social Security, Medicare (health insurance for older people), and Medicaid (health insurance for lower-income people) programs continue to rapidly increase. Spending on Medicare is now more than $100 billion greater than spending on defense. Interest on the public debt continues to increase as the debt increases and interest rates remain well above their pre-2021 levels.
This morning (September 30), the federal government appears headed for a shutdown at midnight. As this handy explainer by David Wessel on the Brookings Institution website notes:
“… federal agencies cannot spend or obligate any money without an appropriation (or other approval) from Congress. When Congress fails to enact the 12 annual appropriation bills, federal agencies must cease all non-essential functions until Congress acts.
Government employees who provide what are deemed essential services, such as air traffic control and law enforcement, continue to work, but don’t get paid until Congress takes action to end the shutdown. All this applies only to the roughly 25% of federal spending subject to annual appropriation by Congress.”
A federal government shutdown can cause significant inconvenience to people who rely on nonessential government services. Federal government employees won’t receive paychecks nor will contractors supplying nonessential services, such as cleaning federal office buildings. Many federal government facilities, such as museums and national parks will be closed or will operate on reduced hours. It seems likely that the Bureau of Labor Statistics will not release on time its “Employment Situation Report” for September, which was due on Friday.
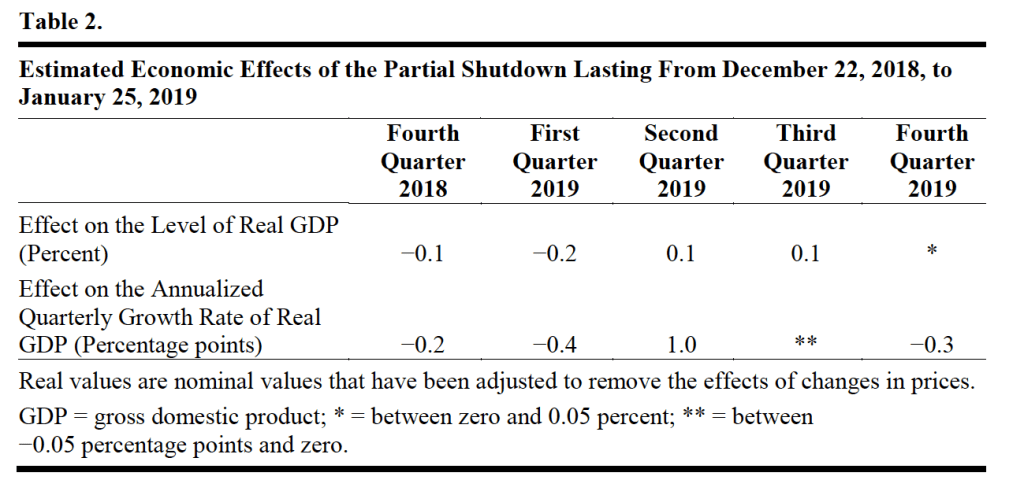
Apart from the effects just listed, how might a shutdown affect the broader economy? The most recent federal government shutdown occurred during the first Trump administration and lasted from December 22, 2018 to January 25, 2019. At the end of that shutdown, the Congressional Budget Office (CBO) prepared a report on its economic effects. The main conclusion of the report was that:
“In CBO’s estimation, the shutdown dampened economic activity mainly because of the loss of furloughed federal workers’ contribution to GDP, the delay in federal spending on goods and services, and the reduction in aggregate demand (which thereby dampened private-sector activity).”
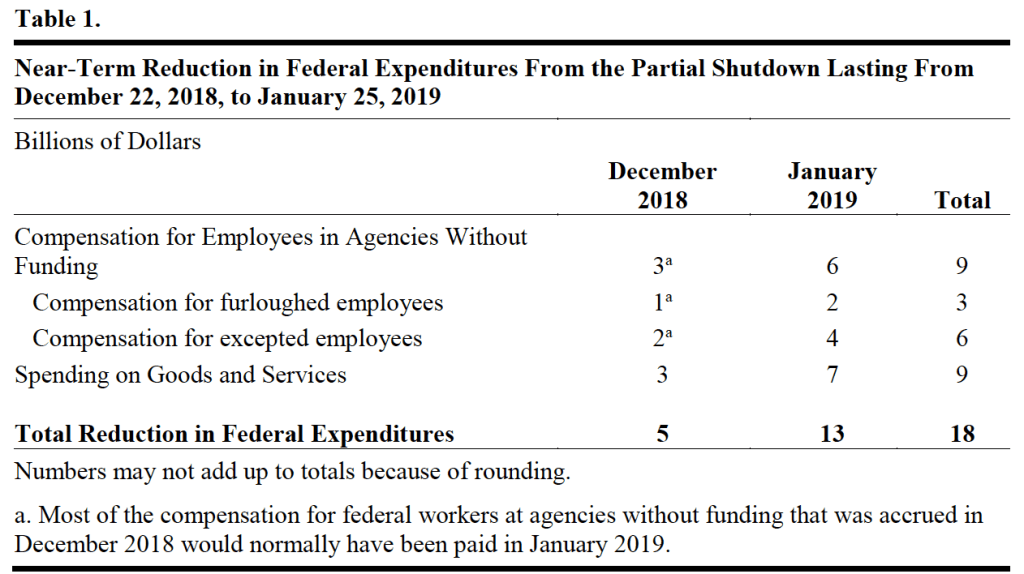
Table 1 from the CBO report shows the effect of the shutdown on federal government expenditures. (Note that the CBO refers to the shutdown as being “partial” because, as in all federal government shutdowns, essential government services continued to be provided.)
Table 2 from the report shows the effects of the shutdown on real GDP.
Most of the macroeconomic effects of a government shutdown aren’t long lasting because most federal government spending that doesn’t occur during the shutdown is postponed rather than eliminated. When federal government employees return to work after the shutdown, they typically receive backpay for the time they were furloughed. The CBO estimates that the lasting effect of the shutdown on GDP was small “about $3 billion in forgone economic activity will not be recovered. That amount equals 0.02 percent of projected annual GDP in 2019.”
Will a federal government shutdown that begins at midnight tonight and lasts for a few weeks also have only a short-lived effect on the economy? That seems likely, although the Trump administration has indicated that if a shutdown occurs, some federal government employees will be fired rather than just furloughed. A significant reduction in federal employment could lead to a larger decrease in GDP that might persist for longer. The effect on the areas of Virginia and Maryland where most federal government workers live could be significant in the short run.
Modern industrial capitalism’s bounty has been breathtaking globally and especially in the U.S. It’s tempting, then, to look at critics in the crowd in Monty Python’s “Life of Brian” as they ask, “What have the Romans ever do for us?,” only to be confronted with a large list of contributions. But, in fact, over time, American capitalism has been saved by adapting to big economic changes.
We’re at another turning point, and the pattern of American capitalism’s keeping its innovative and disruptive core by responding, if sometimes slowly, to structural shocks will play out as follows.
The magnitude, scope and speed of technological change surrounding generative artificial intelligence will bring forth a new social insurance aimed at long-term, not just cyclical, impacts of disruption. For individuals, it will include support for work, community colleges and training, and wage insurance for older workers. For places, it will include block grants to communities and areas with high structural unemployment to stimulate new business and job opportunities. Such efforts are a needed departure from a focus on cyclical protection from short-term unemployment toward a longer-term bridge of reconnecting to a changing economy.
These ideas, like America’s historical big responses in land-grant colleges and the GI Bill, combine federal funding support with local approaches (allowing variation in responses to local business and employment opportunities), another hallmark of past U.S. economic policy.
With a stronger economic safety net, the current push toward higher tariffs and protectionism will gradually fade. Protectionism is a wall against change, but it is one that insulates us from progress, too.
A growing budget deficit and strains on public finances will lead to a reliance on consumption taxes to replace the current income tax system; continuing to raise taxes on saving and investment will arrest growth prospects. For instance, a tax on business cash flow, which places a levy on a firm’s revenue minus all expenses including investment, would replace taxes on business income. Domestic production would be enhanced by adding a border adjustment to business taxes—exports would be exempt from taxation, but companies can’t claim a deduction for the cost of imports.
That reform allows a shift from helter-skelter tariffs to tax reform that boosts investment and offers U.S. and foreign firms alike an incentive to invest in the U.S.
These ideas to retain opportunity amid creative destruction will also refresh American capitalism as the nation celebrates its 250th anniversary. They also celebrate the classical liberal ideas of Adam Smith, whose treatise “The Wealth of Nations” appeared the same year. This refresh marries competition’s role in “The Wealth of Nations” and American capitalism with the ability to compete, again a feature of turning points in capitalism in the U.S.
Decades down the road, this “Project 2026” will have preserved the bounty and mass prosperity of American capitalism.
These observations first appeared in the Wall Street Journal, along with predictions from six other economists and economic historians.
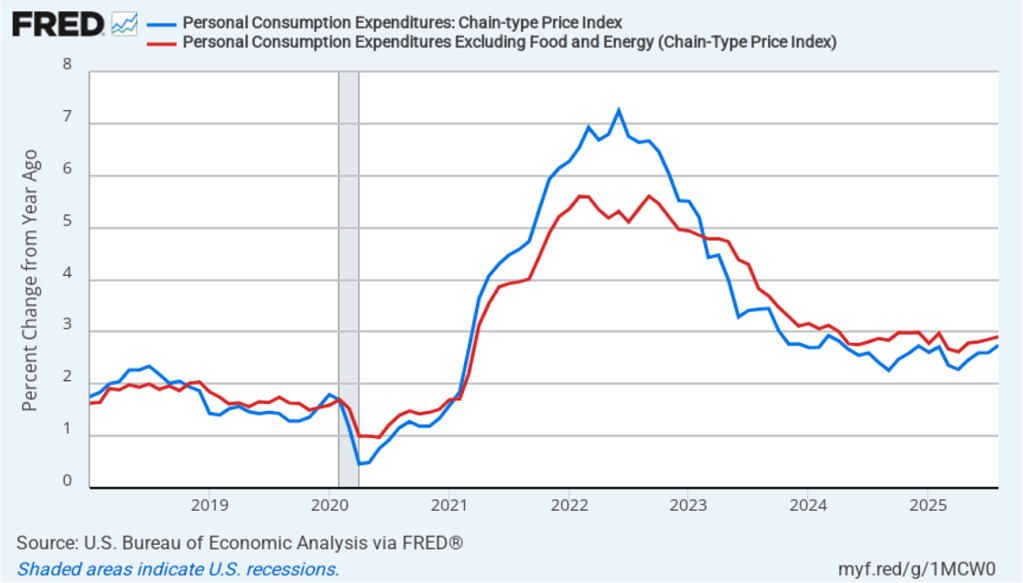
Today (September 26), the Bureau of Economic Analysis (BEA) released monthly data on the personal consumption expenditures (PCE) price index as part of its “Personal Income and Outlays” report. Yesterday, the BEA released its revised estimate of real GDP growth in the second quarter. Taken together, the two reports show that economic growth remains realtively strong and that inflation continues to run above the Fed’s 2 percent annual target.
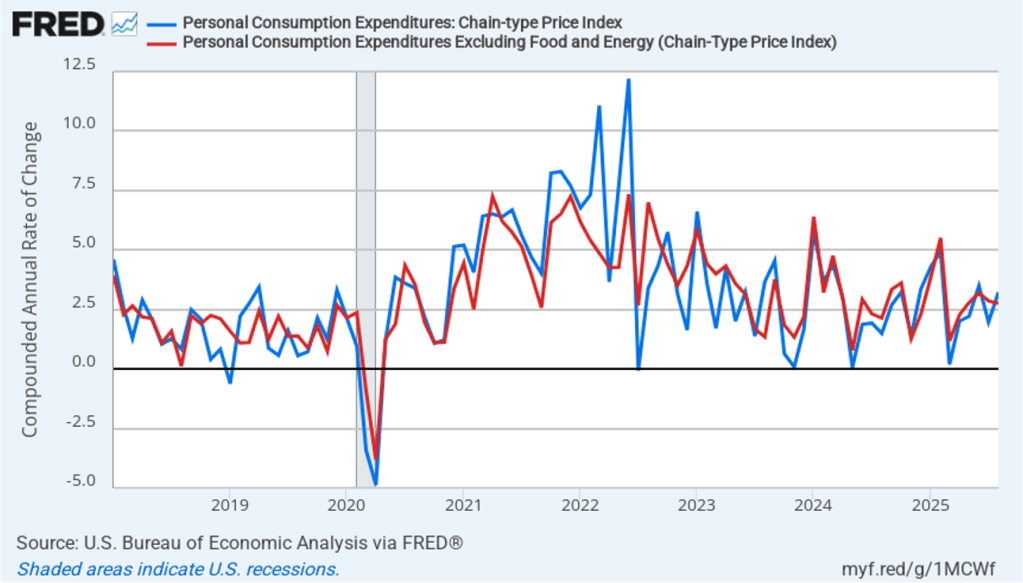
Taking the inflation report first, the following figure shows headline PCE inflation (the blue line) and core PCE inflation (the red line)—which excludes energy and food prices—for the period since January 2018, with inflation measured as the percentage change in the PCE from the same month in the previous year. In August, headline PCE inflation was 2.7 percent, up from 2.6 percent in July. Core PCE inflation in August was 2.9 percent, unchanged from July. Headline PCE inflation was equal to the forecast of economists surveyed, while core PCE inflation was slightly lower than forecast.
The following figure shows headline PCE inflation and core PCE inflation calculated by compounding the current month’s rate over an entire year. (The figure above shows what is sometimes called 12-month inflation, while this figure shows 1-month inflation.) Measured this way, headline PCE inflation increased from 2.0 percent in July to 3.2 percent in August. Core PCE inflation declined slightly from 2.9 percent in July to 2.8 percent in August. So, both 1-month and 12-month PCE inflation are telling the same story of inflation being well above the Fed’s target. The usual caution applies that 1-month inflation figures are volatile (as can be seen in the figure). In addition, these data likely reflect higher prices resulting from the tariff increases the Trump administration has implemented. Once the one-time price increases from tariffs have worked through the economy, inflation may decline. It’s not clear, however, how long that may take and President Trump indicated yesterday that he may impose new tariffs on pharmaceuticals, large trucks, and furniture.
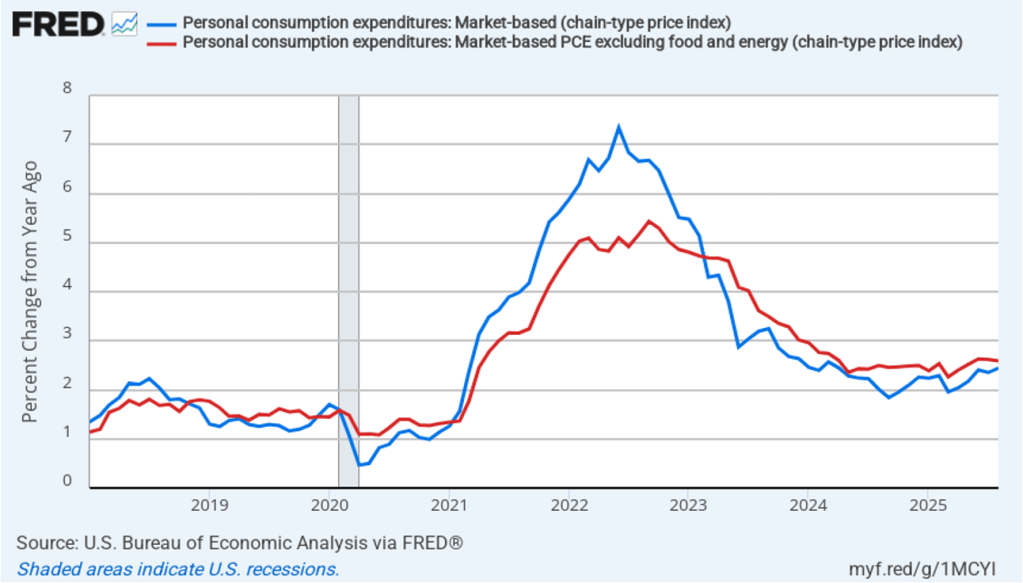
Fed Chair Jerome Powell has frequently mentioned that inflation in non-market services can skew PCE inflation. Non-market services are services whose prices the BEA imputes rather than measures directly. For instance, the BEA assumes that prices of financial services—such as brokerage fees—vary with the prices of financial assets. So that if stock prices fall, the prices of financial services included in the PCE price index also fall. Powell has argued that these imputed prices “don’t really tell us much about … tightness in the economy. They don’t really reflect that.” The following figure shows 12-month headline inflation (the blue line) and 12-month core inflation (the red line) for market-based PCE. (The BEA explains the market-based PCE measure here.)
Headline market-based PCE inflation was 2.4 percent in August, unchanged from July. Core market-based PCE inflation was 2.6 percent in August, also unchanged from July. So, both market-based measures show inflation as stable but above the Fed’s 2 percent target.
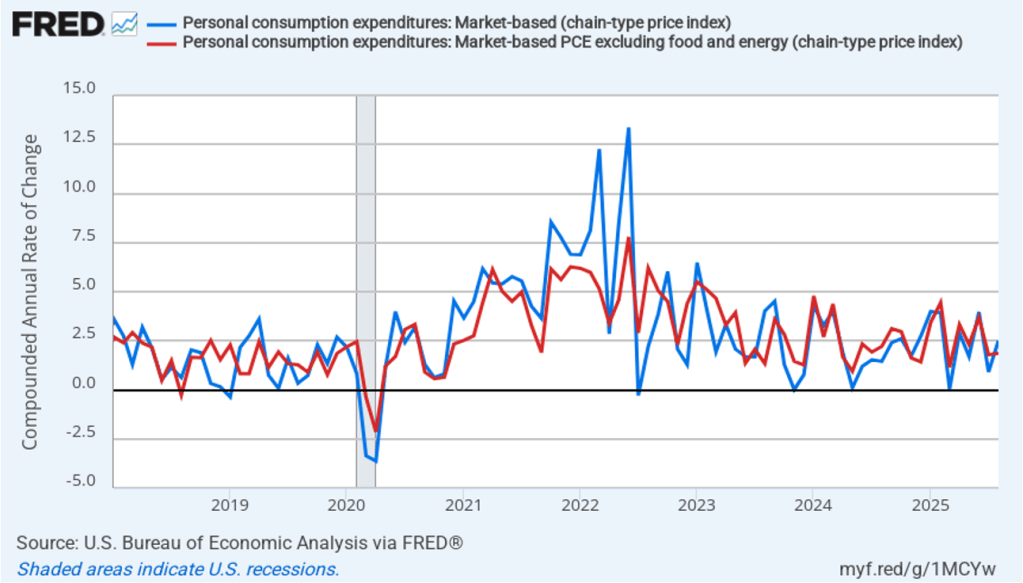
In the following figure, we look at 1-month inflation using these measures. One-month headline market-based inflation increase sharply to 2.5 percent in August from 0.9 percent in July. One-month core market-based inflation increased slightly to 1.9 percent in August from 1.8 percent in July. As the figure shows, the 1-month inflation rates are more volatile than the 12-month rates, which is why the Fed relies on the 12-month rates when gauging how close it is coming to hitting its target inflation rate.
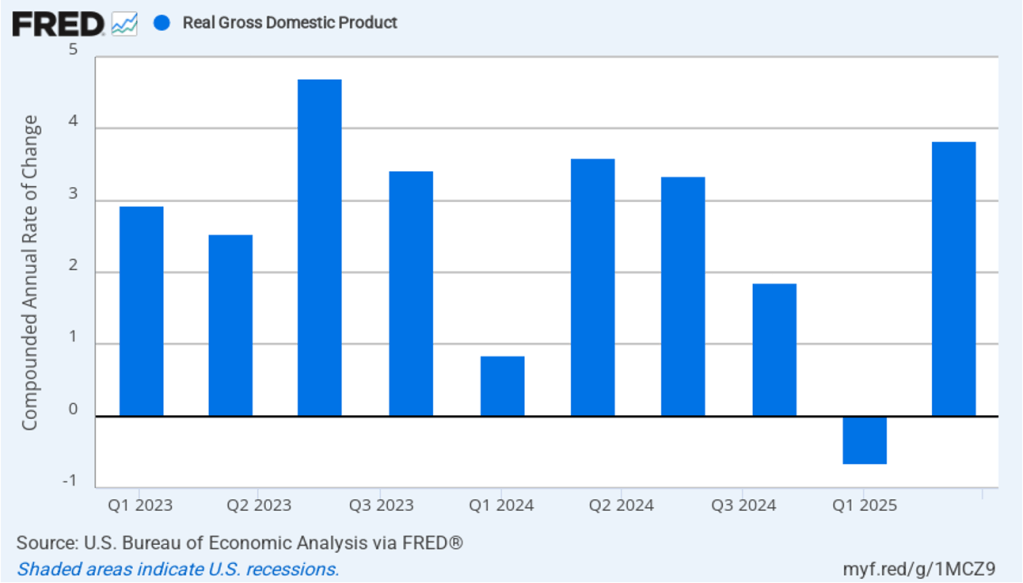
Inflation running above the Fed’s 2 percent target is consistent with relatively strong growth in real GDP. The following figure shows compound annual rates of growth of real GDP, for each quarter since the first quarter of 2023. The value for the second quarter of 2025 is the BEA’s third estimate. This revised estimate increased the growth rate of real GDP to 3.8 percent from the second estimate of 3.3 percent.
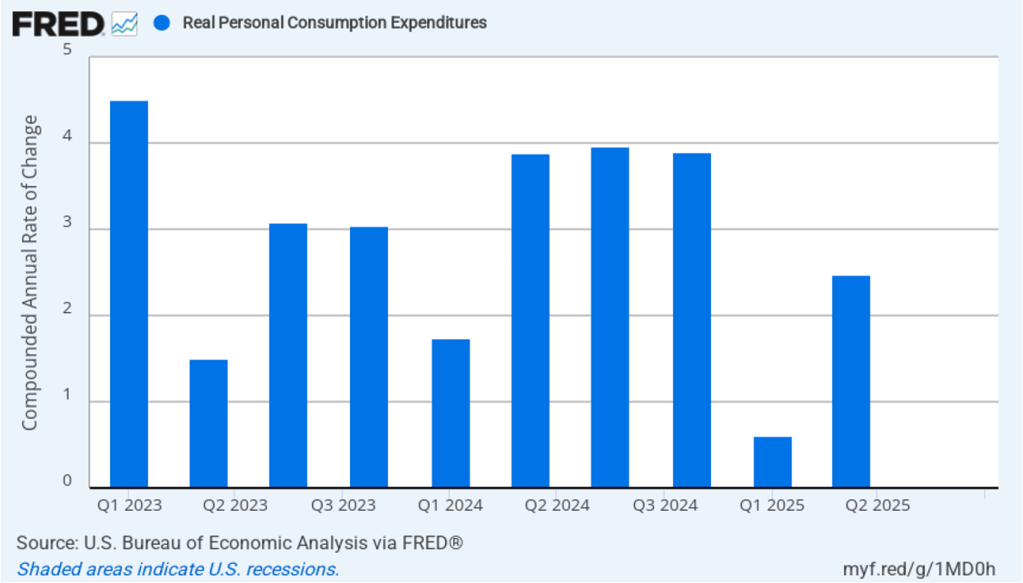
The most important contributor to real GDP growth was growth in real personal consumption expenditures, which, as shown in the following figure, increased aat compound annual rate of 2.5 percent in the second quarter, up from 0.6 percent in the first quarter.
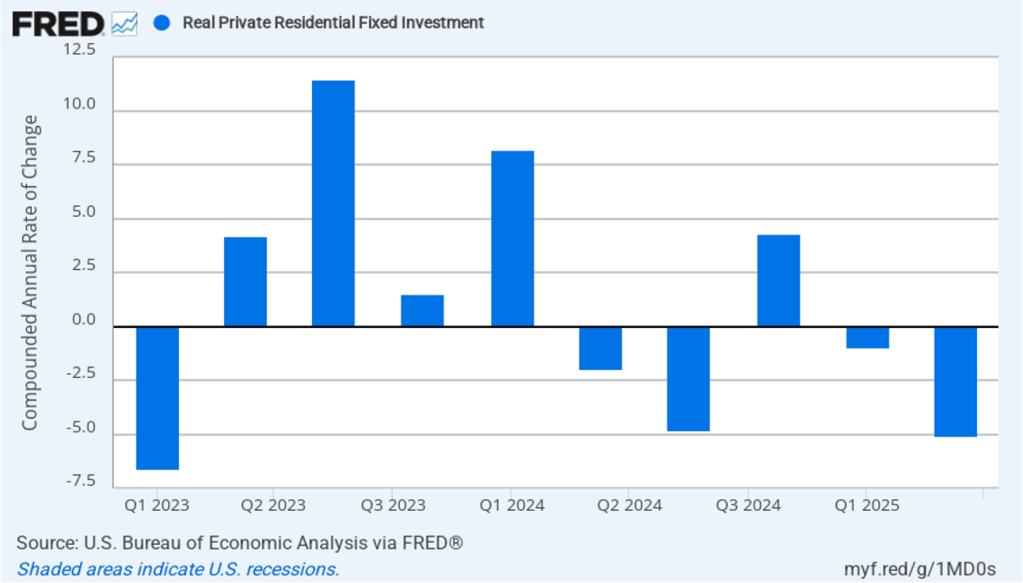
High interest rates continue to hold back residential construction, which declined by a compound annual rate of 5.1 percent in the second quarter after declining 1.0 percent in the first quarter.
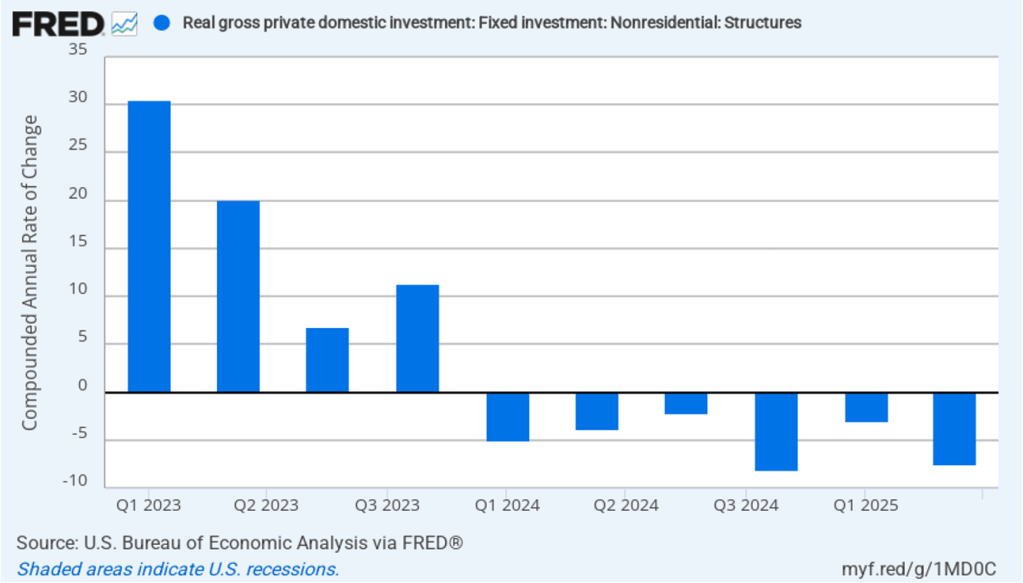
Business investment in structures, such as factories and office buildings, continued a decline that began in the first quarter of 2024.
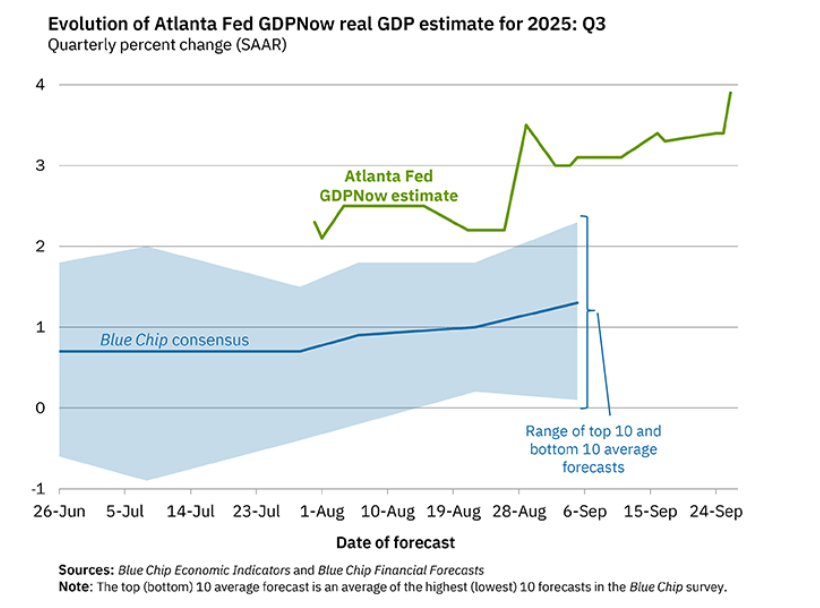
Will the relatively strong growth in real GDP in the second quarter continue in the third quarter? Economists at the Federal Reserve Bank of Atlanta prepare nowcasts of real GDP. A nowcast is a forecast that incorporates all the information available on a certain date about the components of spending that are included in GDP. The Atlanta Fed calls its nowcast GDPNow. As the following figure from the Atlanta Fed website shows, today the GDPNow forecast is for real GDP to grow at an annual rate of 3.9 percent in the third quarter.
Finally, the macroeconomic data released in the last two days has had realtively little effect on the expectations of investors trading federal funds rate futures. Investors assign an 89.8 percent probability to the Federal Open Market Committee (FOMC) cutting its target for the federal funds rate at its meeting on October 28–29 by 0.25 percentage point (25 basis points) from its current range of 4.00 percent to 4.25 percent. That probability is only slightly lower than 91.9 percent probaiblity that investors had assigned to a 25 basis point cut a week ago. However, the probability of the committee cutting its target rate by another 25 basis points at its December 9–10 fell to 67.0 percent today from 78.6 percent one week ago.
Supports:Macroeconomics, Chapter 13, Section 13.3; Economics, Chapter 23, Section 23.3; and Essentials of Economics, Chapter 15, Section 15.3
Image generated by ChatGPT
A recent article on axios.com made the following observation: “The mainstream view on the Federal Open Market Committee is based on risk management—that the possibility of a further downshift in the job market appears to be the more pressing concern than the chance that inflation will spiral higher.” The article also notes that: “Tariffs’ effects on inflation are probably a one-time bump.”
a. What is the dual mandate that Congress has given the Federal Reserve?
b. In what circumstances might the Federal Open Market Committee (FOMC) be faced with a conflict between the goals in the dual mandate?
c. What does the author mean by tariffs’ effects on inflation being a “one-time bump”?
d. What does the author mean by the FOMC engaging in “risk management”? What is a “downshift” in the labor market? If the FOMC is more concerned about a downshift in the labor market than about inflation, will the committee raise or lower its target for the federal funds rate? Briefly explain.
Solving the Problem Step 1: Review the chapter material. This problem is about the policy dilemma the Fed can face when the unemployment rate and the inflation rate are both rising, so you may want to review Macroeconomics, Chapter 13, Section 13.3, “Macroeconomic Equilibrium in the Long Run and the Short Run.”
Step 2: Answer part a. by explaining what the Fed’s dual mandate is. Congress has given the Fed a dual mandate of achieving price stability and maximum employment.
Step 3: Answer part b. by explaining when the FOMC may face a conflict with respect to its dual mandate. When the FOMC is faced with rising unemployment and falling inflation, its preferred policy response is clear: The committee will lower its target for the federal funds rate in order to increase the growth of aggregate demand, which will increase real GDP and reduce unemployment. When the FOMC is faced with falling unemployment and rising inflation, its preferred policy response is also clear: The committee will raise its target for the federal funds rate in order to slow the growth of aggregate demand, which will reduce the inflation rate.
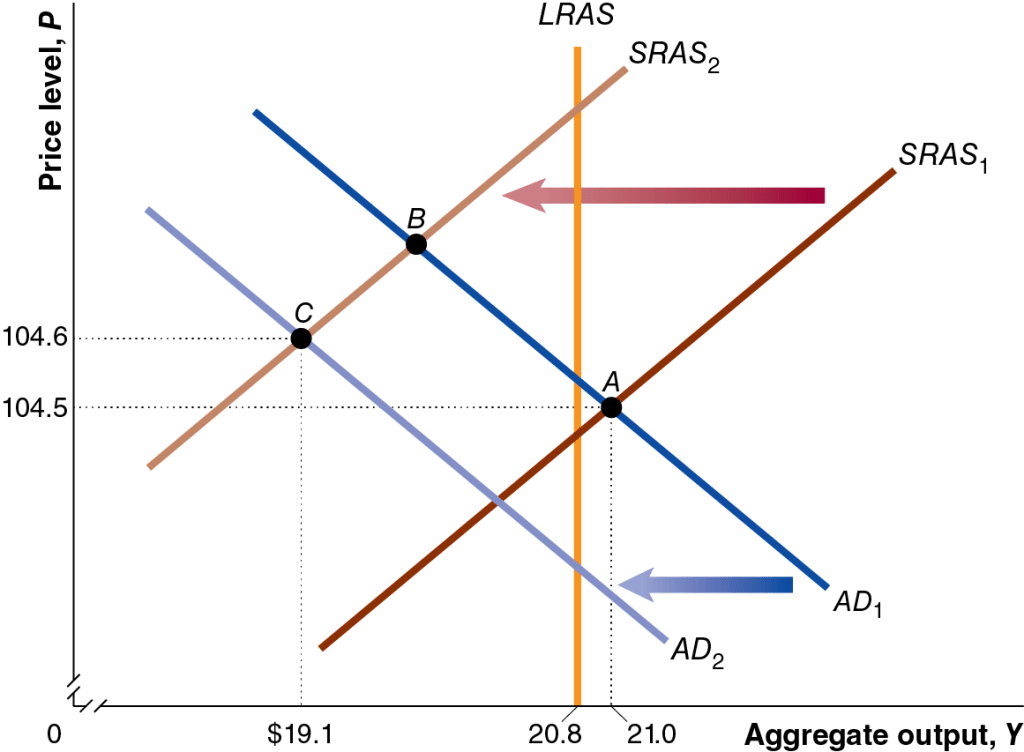
But when the Fed faces an aggregate supply shock, its preferred policy response is unclear. An aggregate supply shock, such as the U.S. economy experienced during the Covid pandemic and again with the tariff increases that the Trump administration began implementing in April, will shift the short-run aggregate supply curve (SRAS) will shift to the left, causing an increase in the price level, along with a decline in real GDP and employment. This combination of rising unemployment and inflation is called stagflation. In this situation, the FOMC faces a policy dilemma: Raising the target for the federal funds rate will help reduce inflation, but will likely increase unemployment, while lowering the target for the federal funds rate will lead to lower unemployment, but will likely increase inflation. The following figure shows the situation during the Covid pandemic when the economy experienced both an aggregate demand and aggregate supply shock. The aggregate demand curve and the aggregate supply curve both shifted to the left, resulting in falling real GDP (and employment) and a rising price level.
Step 4: Answer part c. by explaining what it means to refer to the effect of tariffs on inflation being a “one-time bump.” Tariffs cause the aggregate supply curve to shift to the left because by increasing the prices of raw materials and other inputs, they increase the production costs of some businesses. Assuming that tariffs are not continually increasing, their effect on the price level will end once the production costs of firms stop rising.
Step 5: Answer part d. by explaining what the author means by the FOMC engaing in “risk management,” explaining what a “downshift” in the labor is, and whether if the FOMC is more concerned about a downshift in the labor market than in inflation, it will raise or lower its target for the federal funds rate. The article refers to the “possibility” of a further downshift in the labor market. A downshift in the labor market means that the demand for labor may decline, raising the unemployment rate. Managing the risk of this possibility would involve concentrating on the maximum employment part of the Fed’s dual mandate by lowering its target for the federal funds rate. Note that the expectation that the effect of tariffs on the price level is a one-time bump makes it easier for the committee to focus on the maximum employment part of its mandate because the increase in inflation due to the tariff increases won’t persist.