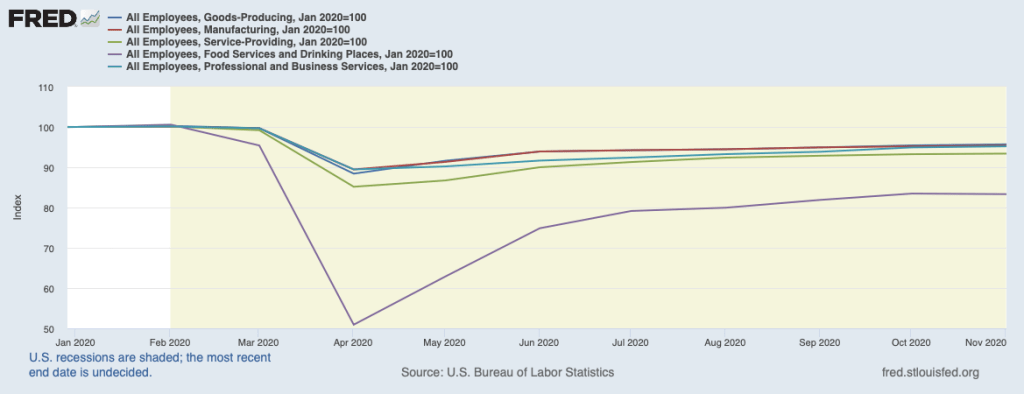
In March 2020, as the effects of the Covid-19 pandemic on the U.S. economy became clear, Congress passed and President Donald Trump signed the Coronavirus Aid, Relief, and Economic Security (Cares) Act, which authorized more than $2 trillion in new spending. This fiscal policy action helped to cushion the effects on businesses and households of the job losses and reduced spending resulting directly from the pandemic and from the actions state and local governments took to contain the spread of the coronavirus, including restrictions on the operations of many businesses.
After a long debate over whether additional government aid would be required, in December 21, 2020, as hospitalizations and deaths from Covid-19 hit new highs in the United States, Congress agreed to a second fiscal policy action, totaling about $900 billion. On December 27, President Donald Trump signed the legislation. The components of the new spending are shown in the following pie chart, which is adapted from an article in the Wall Street Journal that can be found HERE. Note that the dollar values in the pie chart are in billions.
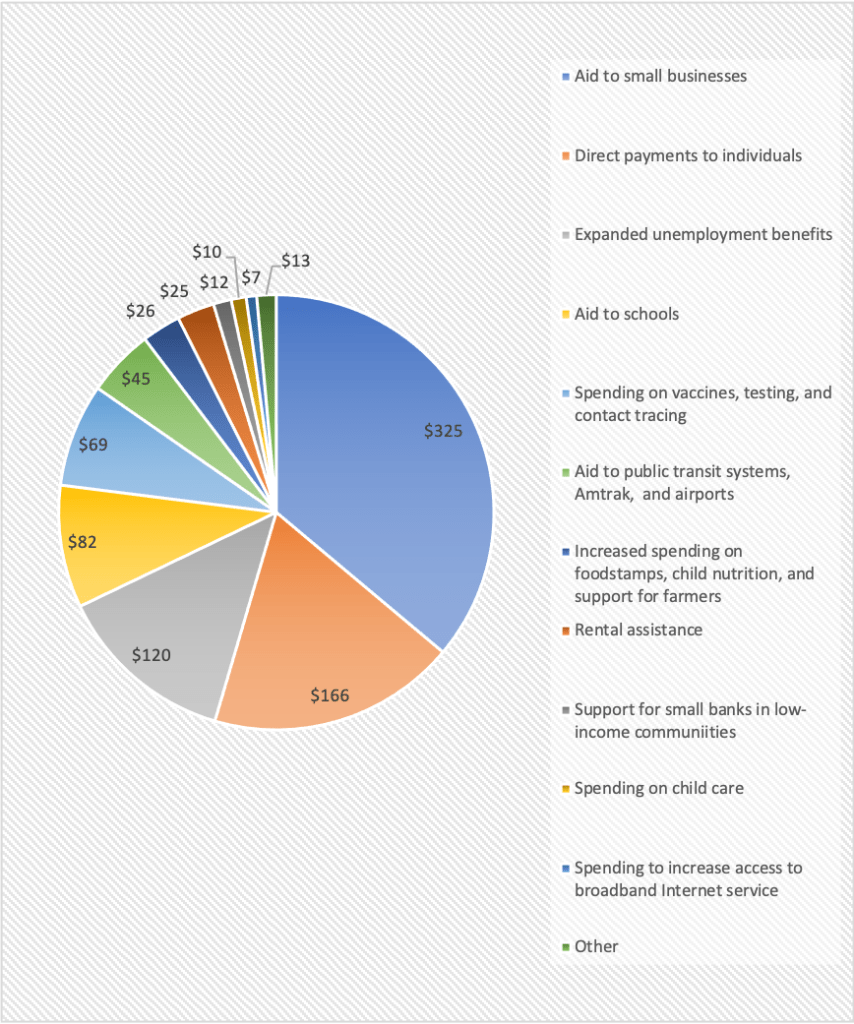
The largest component of the package is aid to small businesses, most of which takes the form of providing additional funds for the Paycheck Protection Plan. (We discuss the Paycheck Protection Plan in an earlier blog post that you can read HERE. An analysis by economists at the U.S. Department of the Treasury of the effectiveness of the original round of spending under the Paycheck Protection Plan can be found HERE.) The second largest component of the program involves direct payments of $600 per adult and $600 per child. The payments phase out for individuals with incomes over $75,000 and for couples with incomes over $150,000. The next largest component of the package is expanded unemployment benefits, followed by aid to schools, and increased spending on vaccines, testing, and contact tracing.
An article from the Associated Press describing the plan can be found HERE.