Deciphering the April Employment Report

On Friday May 7, 2021, the Bureau of Labor Statistics (BLS) released its monthly “Employment Situation Report.”  The BLS estimated that nonfarm payroll employment had increased by 266,000 from March to April. The average forecast of the Wall Street Journal’s panel of economists was for a much higher increase in employment of  1 million. The unemployment rate increased from 6.0% to 6.1%, rather than falling to 5.8% as economists had forecast.  

Keep in mind that employment data is subject to revisions. What does this employment report tell us about the state of the economy and the state of the labor market?  First, it’s always worth remembering that the BLS revises its employment estimates at least three times in subsequent months as more complete data become available. (The unemployment rate estimates are calculated in a separate survey of households and are not revised other than as seasonal adjustment factors change.)

Employment data gathered during and immediately after a recession are particularly subject to large revisions. In the principles textbook, Chapter 19, Section 19.1 includes a discussion of the substantial revisions the BLS made to its initial employment estimates during the 2007–2009 recession.  Today’s report noted that the increase in employment from February to March, which had originally been reported as 916,000 had been revised downward to 770,000.

Explaining the slow increase in employment. So, the estimated employment increase the BLS reported today may well end up being revised upward. But the revisions will almost certainly leave the increase far short of the forecast increase of 1 million.  We can discuss two types of explanations for this relatively disappointing employment increase: 1) factors affecting the demand for labor, and 2) factors affecting the supply of labor.

The demand for labor.  During the recovery from a typical recession, increases in labor demand may lag behind increases in production, limiting employment increases and causing temporary increases in the unemployment rate.  Employers may be reluctant to hire more workers if the employers are uncertain that the increase in demand for their products will be maintained. During a recession, firms also typically reduce employment by less than they reduce output because searching for workers during a recovery is costly and because they may fear that if they lay off their most productive workers, these workers may accept jobs at competing firms. As a result, during the early months of a recovery, firms are in position to increase output by more than they increase employment. That this outcome occurred during the first months of 2021 is indicated by the fact that productivity increased 5.4% during the first quarter of 2021, as firms increased output by 8.4% but hours worked by only 2.9%.

The recession caused by the pandemic was unusual in that many businesses decreased their supply of goods and services not because of a decline in consumer demand but because of government social distancing requirements. During March 2021, as more people became vaccinated against Covid-19, state and local governments in many areas of the country were relaxing or eliminating these requirements. But upsurges in infection in some areas slowed this process and may also have made consumers reluctant to shop at stores or attend movie theaters even where such activities were not restricted. Finally, partly due to the pandemic, some U.S. manufacturers were having trouble receiving deliveries of intermediate goods. In particular, automobile companies had to reduce production or close some factories because of the difficulty of obtaining computer chips. As a result, during April 2021, employment declined in the motor vehicle and parts industry despite strong consumer demand for cars and light trucks.

The supply of labor. In the weeks leading up to the release of employment report, the media published many articles focusing on firms that were having difficulty hiring workers. BLS data for February 2021 (the most recent month with available data) showed that the estimated number of job opening nationwide was actually 5% higher than in February 2020, the last month before the pandemic.

That employment grew slowly despite a large number of available jobs may be an indication that labor supply had declined relative to the situation before the pandemic. That is, fewer people were willing to work at any given wage than a year earlier. There are several related reasons that the labor supply curve may have shifted: 1) Many K-12 schools were still conducting instruction either wholly or partially online making it more difficult for parents of school-age children to accept work outside the home; 2) although vaccinations had become widely available, some people were still hesitant to be in close proximity to other people as is required in many jobs; and 3) under the American Rescue Plan Act proposed by President Biden and passed by Congress in March 2021, many unemployed workers were eligible for an additional $300-per-week federal payment on top of their normal state unemployment insurance payment. These expanded unemployment benefits were scheduled to end September 2021. In the case of some low-wage workers, their total unemployment payment during April was greater than the wage they would have earned if employed.

These three factors affecting labor supply were potentially interrelated in that the expanded unemployment insurance benefits provided the financial means that allowed some workers to remain unemployed so that they could be home with their children or so that they could avoid a work situation that they believed exposed them to the risk of contracting Covid-19.

That at least some firms were having difficulty hiring workers seemed confirmed by the fact that average weekly hours worked steadily increased from February through April, indicating that employers were asking their existing employees to work longer hours. 

Summary. It’s never a good idea to draw firm conclusions about the state of the economy from one month’s employment report. That observation is particularly true in this case because April 2021 was a period of continuing transition in the U.S. economy as vaccination rates increased, infection rates declined, and government restrictions on business operations were relaxed. All of these factors made it likely that during the following months more businesses would be able to resume normal operations, increasing the demand for labor.

In addition, by the fall, the factors affecting labor supply may have largely been resolved as most children return to full-time on-site schooling, increased vaccination rates reduce fears of infection, and the supplementary unemployment benefits end.

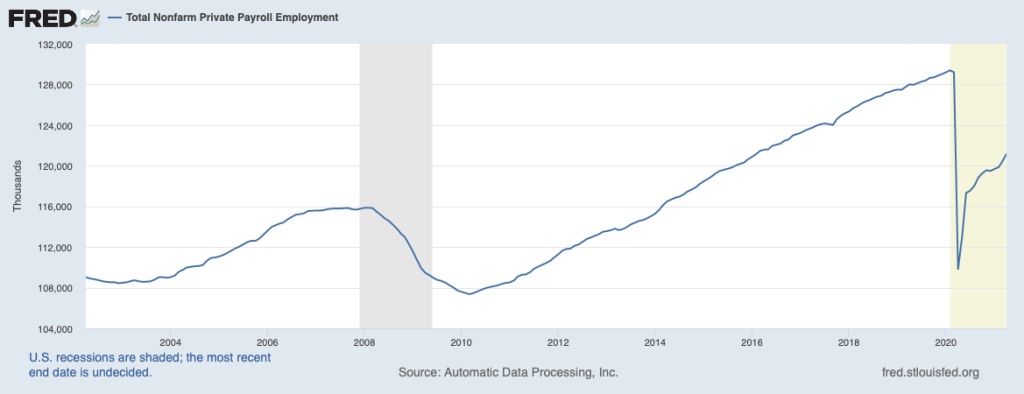
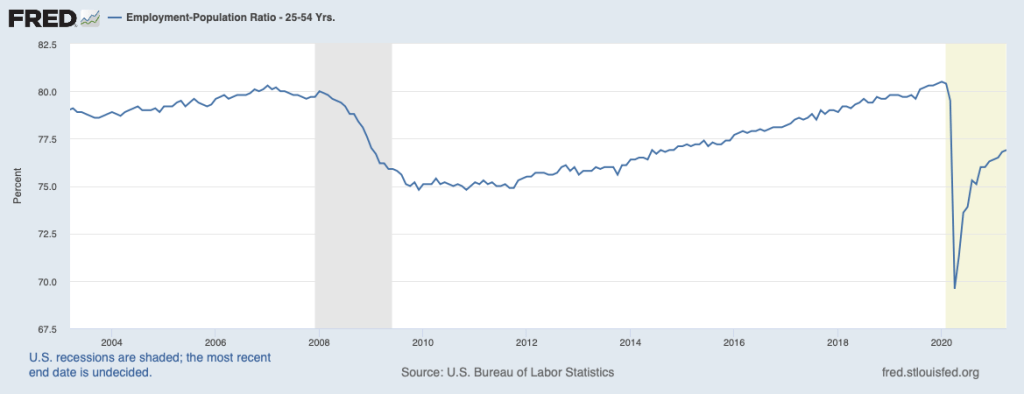
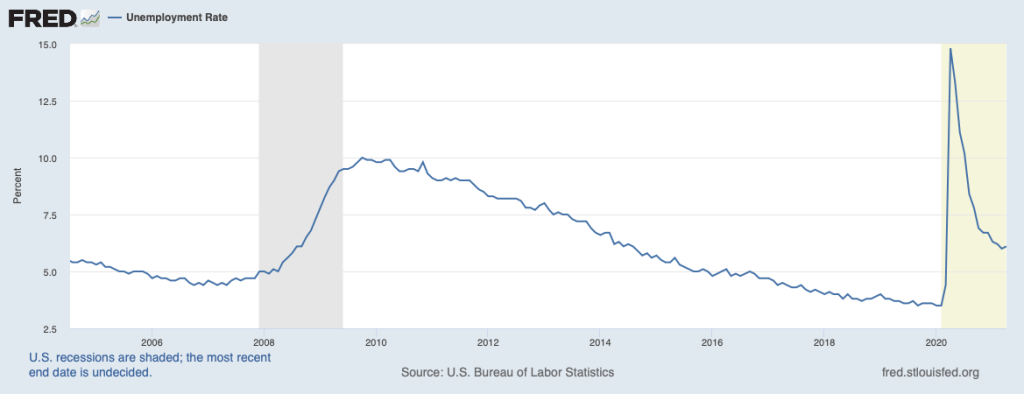
The three figures below show: 1) total nonfarm private employment; 2) the employment-population ratio for workers aged 25 to 54; and 3) the unemployment rate. Together the figures indicate that in April 2021 the recovery from the worst effects of the pandemic on the labor market was well underway, but there was still a long way to go.

NEW! – 04/16/21 Podcast – Authors Glenn Hubbard & Tony O’Brien discuss monetary policy and the tools available to the Federal Reserve.

Authors Glenn Hubbard and Tony O’Brien follow up on last week’s fiscal policy podcast by discussing monetary policy in today’s world. The Fed’s role has changed significantly since it was first introduced. They keep an eye on inflation and employment but aren’t clear on which is their priority. The tools and models used by economists even a decade ago seem outdated in a world where these concepts of a previous generation may be outdated. But, are they? LIsten to Glenn & Tony discuss these issues in some depth as we navigate our way through a difficult financial time.

Just search Hubbard O’Brien Economics on Apple iTunes or any other Podcast provider and subscribe! Today’s episode is appropriate for Principles of Economics and/or Money & Banking!

Please listen & share!

NEW! – 04/09/21 Podcast – Authors Glenn Hubbard & Tony O’Brien discuss the longer-term impact of several post-pandemic fiscal policy efforts and the new Biden administration infrastructure investment proposal.

Authors Glenn Hubbard and Tony O’Brien discuss the long-term impacts of recent fiscal policy decisions as well as the proposed infrastructure investment by the Biden administration. The most recent round of fiscal stimulus means that we’re spending almost 4.5 Trillion which is a high percentage of what we recently spent in an entire fiscal year. They deal with the question of if the infrastructure spending will increase future productivity or will just be spent on the social programs. Also, Glenn deals with the proposed corporate tax increase to 28% which has been designated to fund these programs but does have an impact on stock market values held by millions through 401K’s and IRA’s.

Just search Hubbard O’Brien Economics on Apple iTunes or any other Podcast provider and subscribe!

Please listen & share!

NEW! – 02/19/21 Podcast – Authors Glenn Hubbard & Tony O’Brien discuss early thoughts on the Biden Administration’s economic plan.

Authors Glenn Hubbard and Tony O’Brien discuss early thoughts on the Biden Administration’s economic plan. They consider criticisms of the most recent stimulus packages price tag of $1.9B that it may spur inflation in future quarters. They offer thoughts on how this may become the primary legislative initiative of Biden’s first term as it crowds out other potential policy initiatives. Questions are asked about what bounce we may see for the economy and comparisons are made to the Post World War II era. Please listen and share with students!

The following editorials are mentioned in the podcast:

Glenn Hubbard’s Washington Post Editorial with Alan Blinder

Olivier Blanchard’s comments on the Stimulus in a Peterson Institute for International Economics post

Larry Summer’s WaPo editorial about the risks of the stimulus:

Just search Hubbard O’Brien Economics on Apple iTunes or any other Podcast provider and subscribe!

Please listen & share!

NEW! – 02/12/21 Podcast – Authors Glenn Hubbard & Tony O’Brien talk with early-career Econ graduate – Sydney Levine

Authors Glenn Hubbard and Tony O’Brien catch up with recent Econ graduate – Sydney Levine. Sydney received her undergraduate degree from SUNY-Geneseo and received her master’s from Johns Hopkins University School for Advanced International Studies. She is now a Consultant with Guidehouse LLC. Hear about the tools Sydney developed as an Economics student that aid her in tackling complex business challenges each day with her management consulting team. She also offers insight into which courses helped most in developing her economic view. Glenn and Tony offer thoughts on Adam Smith and other topics during the discussion.

Just search Hubbard O’Brien Economics on Apple iTunes or any other Podcast provider and subscribe!

Please listen & share!

The Wild Ride of GameStop’s Stock Price

Supports:  Hubbard/O’Brien, Chapter 8, Firms, the Stock Market, and Corporate Governance; Macroeconomics Chapter 6; Essentials of Economics Chapter 6; Money, Banking, and the Financial System, Chapter 6.

We’ve seen that a firm’s stock price should represent the best estimates of investors as to how profitable the firm will be in the future. How, then, can we explain the following graph of the price of shares of GameStop, the retail chain that primarily sells video game cartridges and video game systems? The graph shows the price of the stock from December 1, 2020 through February 9, 2021. If the main reason the price of a stock changes is that investors have become more or less optimistic about the profitability of the firm, is it plausible that opinions on GameStop’s profitability changed so much in such a short period of time?.

  Sometimes investors do abruptly change their minds about the profitability of a firm but typically this happens when the firm’s profitability is heavily dependent on the success of a single product. For instance, the price of the stock a biotech firm might soar as investors believe that a new drug therapy the firm is developing will succeed and then the price of the stock might crash when the drug is unable to gain regulatory approval.  But it wasn’t news about its business that was driving the price of GameStop’s stock from $15 per share during December 2020 to a high of $347 per share on January 27, 2021 and then down to $49 per share on February 9.

            To understand these prices swings, first we need to take into account that not all people buying stock do so because they are making long-term investments to accumulate funds to purchase a house, pay for their children’s educations, or for their retirement. Some people who buy stock are speculators who hope to profit by buying and selling stock during a short period—perhaps as short as a few minutes or less. The availability of online stock trading apps, such as Robinhood, that don’t charge commissions for buying and selling stock, and online stock discussion groups on sites like Reddit, have made it easier for some individual investors to become day traders, frequently buying and selling stocks in the hopes of making a short-term profit.

Many day traders engage in momentum investing, which means they buy stocks that have increasing prices and sell stocks that have falling prices, ignoring other aspects of the firm’s situation, including the firm’s likely future profitability. Momentum investing is an example of what economists call noise trading, or buying and selling stocks on the basis of factors not directly related to a firm’s profitability. Noise trading can result in a bubble in a firm’s stock, which means that the price rises above the fundamental value of the stock as indicated by the firm’s profitability. Once a bubble begins, a speculator may buy a stock to resell it quickly for a profit, even if the speculator knows that the price is greater than the stock’s fundamental value. Some economists explain a bubble in the price of a stock by the greater fool theory: An investor is not a fool to buy an overvalued stock as long as there’s a greater fool willing to buy it later for a still higher price. 

Although the factors mentioned played a role in explaining the volatility in GameStop’s stock price, there was another important factor that involved hedge funds and short selling. Hedge funds are similar to mutual funds in that they use money from savers to make investments. But unlike mutual funds, by federal regulation only wealthy individuals or institutional investors such as pension funds or university endowment funds are allowed to invest in hedge funds. Hedge funds frequently engage in short selling, which means that when they identify a firm whose stock they consider to be overvalued, they borrow shares of the firm’s stock from a broker or dealer and sell them in the stock market, planning to make a profit by buying the shares back after their prices have fallen.

In early 2021, several large hedge funds were shorting GameStop’s stock believing that the market for video game cassettes would continue to decline as more gamers switched to downloading games. Some people in online forums—notably the WallStreetBets forum on Reddit—dedicated to discussing investing strategies argued that if enough day traders bought GameStop’s stock they could make money through a short squeeze. A short squeeze happens when a heavily shorted stock increases in price. The speculators who shorted the stock may then have to buy back the stock to avoid large losses or having to pay very high fees to dealers who had loaned them the shares they were shorting. As the short sellers buy stock, the price of the stock is bid up further, earning a profit for day traders who had bought the stock in anticipation of the short squeeze. One MIT graduate student made a profit of more than $200,000 on a $500 investment in GameStop stock. Some hedge funds that had been shorting GameStop lost billions of dollars.

Some of the day traders involved saw this episode as one of David defeating Goliath because the people executing the short squeeze were primarily young with moderate incomes whereas the people running the hedge funds taking substantial losses in the short squeeze were older with high incomes. The reality was more complex because as the price of GameStop stock declined from $347 on to $54 on February 4, some day traders who bought the stock after its price had already substantially risen lost money. And all the winners from the short squeeze weren’t day traders; some were hedge funds. For instance, by early February, the hedge fund Senvest Management had earned $700 million from its trading in GameStop’s stock.  

Economists had differing opinions about whether the GameStop episode had a wider significance for understanding how the stock market works or for how it was likely to work in the future. Some economists and investment professionals argued that what happened with GameStop’s stock price was not very different from previous episodes in which speculators buying and selling a stock will for a time cause increased volatility in the stock’s price. In the long run, they believe that stock prices return to their fundamental values. Other economists and investors thought that the increased number of day traders combined with the availability of no-commission stock buying and selling meant that stock prices might be entering a new period of increased volatility. They noted that similar, if less spectacular, price swings had happened at the same time in other stocks such as AMC, the movie theater chain, and Express, the clothing store chain. An article on bloomberg.com quoted one analyst as saying, “We’ve made gambling on the stock market cheaper than gambling on sports and gambling in Vegas.” 

            Federal regulators, including Treasury Secretary Janet Yellen, were evaluating what had happened and whether they needed to revise existing government regulations of financial markets.  

Sources: Misyrlena Egkolfopoulou and Sarah Ponczek, “Robinhood Crisis Reveals Hidden Costs in Zero-Fee Trading Model,” bloomberg.com, February 3, 2021; Gunjan Banerji,  Juliet Chung, and Caitlin McCabe, “GameStop Mania Reveals Power Shift on Wall Street—and the Pros Are Reeling,” Wall Street Journal, January 27, 2021; Gregory Zuckerman, “For One GameStop Trader, the Wild Ride Was Almost as Good as the Enormous Payoff,” Wall Street Journal, February 3, 2021; Juliet Chung, “Wall Street Hedge Funds Stung by Market Turmoil,” Wall Street Journal, January 28, 2021; and Juliet Chung, “This Hedge Fund Made $700 Million on GameStop,” Wall Street Journal, February 3, 2021. 


Questions 

  1. During the same week that the price of GameStop’s stock was soaring to a record high, an article in the Wall Street Journal noted the following: “Analysts expect GameStop to post its fourth consecutive annual decline in revenue in its latest fiscal year amid declines in its core operations [of selling video game cartridges and video game consoles in retail stores].” Don’t stock prices reflect the expected profitability of the firms that issue the stock? If so, why in January 2021 was the price of GameStop’s stock greatly increasing when it seemed unlikely that the firm would become more profitable in the future?

Source: Sarah E. Needleman, “GameStop and AMC’s Stocks Are on a Tear, but Their Businesses Aren’t,” Wall Street Journal, January 31, 2021

2. In early 2021, as the stock price of GameStop was soaring, a columnist in the New York Times advised that: “A better option [than buying stock in GameStop] would be salting away money in dull, well-diversified stock and bond portfolios, these days preferably in low-cost index funds.”

a. What does the columnist mean by “salting money away”?

b. are index funds and why might they be considered dull when compared to investing in an individual stock like GameStop?

c. Why would the columnist consider investing in an index mutual fund to be a better option than investing money in an individual stock like GameStop? 

Source: Jeff Sommer, “How to Keep Your Cool in the GameStop Market,” New York Times, January 29, 2021.

Instructors can access the answers to these questions by emailing Pearson at christopher.dejohn@pearson.com and stating your name, affiliation, school email address, course number.

Read Glenn Hubbard’s Recent Column, Co-Written with Alan Blinder, on the Covid-19 Relief Package.

Glenn recently co-wrote an op-ed column for the Washington Post with Alan Blinder. Blinder is a professor of economics and public affairs at Princeton University and served as vice chairman of the Federal Reserve Board from 1994 to 1996. They discuss President Biden’s proposed $1.9 trillion relief package currently before Congress. You can read the column HERE, but note that to read articles in the Washington Post you need a subscription, although you may be able to access several article per month for free.

Guest Post from Jadrian Wooten of Penn State on Using Pop Culture to Teach Economics

Jadrain Wooten is an associate teaching professor of economics at Penn State. Jadrian created the Economics Media Library. Clips to the site are included in Jadrian’s essay below.

Last September, we interviewed Jadrian on our podcast. That podcast episode can be found HERE.

What follows is an essay from Jadrian on ideas for teaching economics using examples from pop culture.

Using Pop Culture to Teach Economics

My favorite courses as an undergraduate student weren’t always economics courses. Don’t get me wrong, I loved my intermediate microeconomics so much that I immediately dropped my summer internship so I could add economics as a second major (thanks Ed!). The principles courses, however, weren’t that interesting. We drew graphs, talked about efficiency, and then left for the day. The first class I remember that heavily used media as a teaching tool was Mark Frank’s Business and Government class.

Instead of a traditional textbook, we read The Art of Strategy, When Genius Failed, and The Regulators. Instead of straight lecture, Mark ran experiments and showed a particular episode from ABC Primetime that I still show my students today, over 14 years later. It was the last semester of my undergraduate degree, but his course confirmed that I wanted to get a PhD in economics, and that I wanted to teach my courses like he had taught that course.

I had other amazing professors who used media in the classroom (thanks Darren!), and I landed in a graduate program that trusted me to teach my how I saw fit. For me, that meant a heavy dose of television and movie clips in order to avoid the Ferris Bueller treatment of economics. One of the best parts of teaching today compared to a decade ago is just how much media is available online (shameless plug for Economics Media Library). Thanks in part to cheap hosting services, economics educators have created entire websites specific to economic content found in television shows (Breaking Bad, Modern Family, Parks and Recreation, Seinfeld, Shark Tank, and Superstore), Broadway musicals, and country music.

Many of these educators have also arranged lesson plans and projects associated with various topics as specific as marginal revenue product and the Coase Theorem. Lesson plans (1, 2, 3, 4) have been prepared that take scenes from different shows and detail how they can be integrated into a lesson. Many of the show-specific websites linked earlier also have a section detailing ways to integrate their clips. Most of this focus is at the principles level, but there are also some resources designed for upper-level courses.

Pop culture isn’t just limited to television and film clips! One of the teaching methods I adopted from my undergraduate experience was assigning trade books. Student in my Principles of Microeconomics course read Think Like a Freak and The Why Axis. My Labor Economics students go through “New Geography of Jobs” and We Wanted Workers, while Economics of Crime students read Narconomics, and my Natural Resource Economics students read Endangered Economies. For almost every course out there, there is likely a trade book that presents current research in a digestible manner. Assessing students on readings can be as varied as creating random assignments for each student or using Monte Carlo Quizzes. Using trade books, in addition to the textbook, gives students another avenue for applying the concepts and theories.

Bridging the gap between books and television shows is the use of podcasts. Rebecca Moryl has put together a series of papers (1, 2, 3) as well as a website that categorizes podcasts that can be used to teach (my favorite is Planet Money). Similar to how I use trade books, my students are assigned podcasts along with readings and are assessed with a Monte Carlo Quiz or on their midterm exams. Short podcasts can be played during class to spark a discussion on upcoming topics or as a review of previous material. I love Planet Money’s “A Mall With Two Minimum Wages” for the labor markets chapter.

The number of available resources will only grow as educators continue to develop creative ways to use media in the classroom. What’s my general advice to instructors interested in using media in the classroom? Start small. Play some music before class starts, but link that song to the lesson. Play Brad Paisley’s “American Saturday Night” before you start your lesson on trade and see how your students respond. We teach our students about marginal analysis, so take the same approach to using media!

If the pre-class music video goes well, consider adding a short clip to introduce a topic. Before teaching about liquidity, show this scene from Modern Family where Luke confuses the meaning of “frozen assets.” Need an example for comparative advantage? Try this scene from King of the Hill where Hank and his neighbor debate the best products from the United States and Canada. Just play the clip and then transition straight to your lesson. Let your students know you’ll cover those concepts in class that day, then refer back to the scene when you get to the relevant section.

Ready to go a bit further and really integrate media into your lessons? Play this interview from The Colbert Report and ask students to draw the market for cashmere, including the externality. Have students calculate consumer and producer surplus after watching this scene from Just Go With It. See if students can identify the type of unemployment from this scene in Brooklyn 99. Check out Economics Media Library to see if there’s a clip that you can use in your next lesson. If all of that goes well, check out all of the great resources educators have put together to see what would work in your classroom for the next semester. Maybe one day you’ll teach an entire course on economics through film or one themed entirely on Parks and Recreation.

Guest Post from Bill Goffe of Penn State on Ways to Improve Your Teaching with Ideas Outside of Economics

Bill Goffe is a teaching professor at Penn State. Many instructors know Bill from his “Resources of Economists on the Internet,” which appears on the website of the American Economic Association and can be accessed HERE. Bill is also an associate editor of the Journal Economic Education. The journal’s website can be accessed HERE.

Last May, we interviewed Bill on our podcast. That podcast episode can be found HERE.

What follows is an essay from Bill on ideas on teaching from instructors in other disciplines that economics instructors might find useful.

Improve Your Teaching with Ideas from Outside Economics

According to “The Superiority of Economists” economists tend not to cite other social science disciplines. This is eminently sensible if the topic is monetary policy, welfare theory, or market structures. But, what about teaching? Might other disciplines have useful things to say on this topic that economists might use in their classrooms? As I think the reader will see from the following links to both websites and papers, I think that the clear answer is “yes.” Underlying this answer lie two reasons. First, some other disciplines have devoted substantially more resources to improving teaching than economists have. Second, their approaches are often based on findings from cognitive science.

Perhaps my favorite site for teaching ideas is the Carl Wieman Science Education Initiative at the University of British Columbia. One can think of Wieman as a peer of George Akerlof, Michael Spence, or Joseph Stiglitz as he too was awarded a Nobel Prize in 2001. In Wieman’s case, it was in physics. Before this prize he did some work in physics education research and after the prize all his research time has been devoted to this subject. As he describes in “Why Not Try a Scientific Approach to Science Education,” Wieman was in part puzzled why his “brilliantly clear explanations” led to very little learning by his students. To understand why, he started to read what cognitive science has to say about how humans learn, and he went on to apply these ideas to his teaching; all this is outlined in this paper.

Wieman is one of the most influential STEM education researchers; it is telling that of his ten most cited papers, two are in physics education research. He is still very active with 9 papers published in 2019 and 2020. While now at Stanford, his previous appointment was at the University of British Columbia and a website devoted to his and his group’s work is still actively maintained at the “Carl Wieman Science Education Initiative.” Under the “Resources” tab one will find guides for instructors, which range from classroom videos that illustrate “evidence-based teaching methods” to numerous easily digestible two-page guides. These range from how to write effective homeworks to motivating students to a description of how students think differently than faculty. It is the single most useful site for college teaching that I know of as its many suggestions are based on what is known about how humans learn.

Wieman’s most cited teaching paper is “Improved Learning in a Large Enrollment Physics Class.” Here, learning in two classes over one week is compared. One was taught by an experienced instructor with high student ratings and the other was taught by a novice instructor using evidence-based teaching methods. Students of the latter showed more than two standard deviations learning than students of the former. A particular form of active learning, “deliberate practice” was used by the novice instructor. The cognitive scientist Anders Ericsson coined deliberate practice when studying how novices were transformed into experts (an early collaborator of Ericsson was Herbert Simon).

Another resource from physics education researchers is PhysPort. Besides marveling at the 100+ assessments that STEM education researchers have developed for college classrooms, there are “expert recommendations” on selling active learning to students, on how one might create a community in a classroom, and on creating effective small groups.

While physics education researchers have developed an impressive body of work that economists can use in their classrooms, biology education researchers have also amassed a considerable literature. One of the leading biology education research groups is at the University of Washington. As one can see, their motto is “Ask, Don’t Tell.” That is, teach by asking carefully designed questions that students take seriously. Their “Teaching Resources” succinctly outline the classroom implications of their research. For instance, their video “Effective use of Clickers” demonstrates their use in a large class with frequent references to the relevant literature. The most recent publication of this group is “Active Learning Narrows Achievement Gaps for Underrepresented Students in Undergraduate Science, Technology, Engineering, and Math.” This metaanalysis included data from some 40,000 students.

Another favorite paper of mine by biology education researchers is “The Role of the Lecturer as Tutor: Doing What Effective Tutors Do in a Large Lecture Class.” It follows the theme of “Ask, Don’t Tell” by first reviewing the literature on how expert tutors work with students. The best tutors teach by largely asking questions and these authors extend this idea to teaching large classes. It might be worth pointing out that Wood is a leading lab biologist as he was elected to the National Academy of Sciences at the age of 34. Like Carl Wieman, he feels it is important to devote some of his research time to improving undergraduate education.

Finally, cognitive scientists have written works that economists might directly use. Most anyone who has taught has heard from a student that they studied for an exam, yet the student performed poorly and the student thought that they did better. A very thorough analysis of effective study methods is described in “Improving Students’ Learning With Effective Learning Techniques: Promising Directions From Cognitive and Educational Psychology.” It is a rather foreboding paper to read given its level of detail, but a very readable summary is “Strengthening the Student Toolbox: Study Strategies to Boost Learning.” With the study methods describe here, an economist can give evidence-based suggestions to their students on how to study better for the next exam.

Congress Agrees on a New Covid-19 Aid Package

In March 2020, as the effects of the Covid-19 pandemic on the U.S. economy became clear, Congress passed and President Donald Trump signed the Coronavirus Aid, Relief, and Economic Security (Cares) Act, which authorized more than $2 trillion in new spending. This fiscal policy action helped to cushion the effects on businesses and households of the job losses and reduced spending resulting directly from the pandemic and from the actions state and local governments took to contain the spread of the coronavirus, including restrictions on the operations of many businesses.

After a long debate over whether additional government aid would be required, in December 21, 2020, as hospitalizations and deaths from Covid-19 hit new highs in the United States, Congress agreed to a second fiscal policy action, totaling about $900 billion. On December 27, President Donald Trump signed the legislation. The components of the new spending are shown in the following pie chart, which is adapted from an article in the Wall Street Journal that can be found HERE. Note that the dollar values in the pie chart are in billions.

The largest component of the package is aid to small businesses, most of which takes the form of providing additional funds for the Paycheck Protection Plan. (We discuss the Paycheck Protection Plan in an earlier blog post that you can read HERE. An analysis by economists at the U.S. Department of the Treasury of the effectiveness of the original round of spending under the Paycheck Protection Plan can be found HERE.) The second largest component of the program involves direct payments of $600 per adult and $600 per child. The payments phase out for individuals with incomes over $75,000 and for couples with incomes over $150,000. The next largest component of the package is expanded unemployment benefits, followed by aid to schools, and increased spending on vaccines, testing, and contact tracing.

An article from the Associated Press describing the plan can be found HERE.