How Well Are Recent College Graduates Doing in the Labor Market?

Image generated by ChatGTP-40

A number of news stories have highlighted the struggles some recent college graduates have had in finding a job. A report earlier this year by economists Jaison Abel and Richard Deitz at the Federal Reserve Bank of New York noted that: “The labor market for recent college graduates deteriorated noticeably in the first quarter of 2025. The unemployment rate jumped to 5.8 percent—the highest reading since 2021—and the underemployment rate rose sharply to 41.2 percent.”  The authors define “underemployment” as “A college graduate working in a job that typically does not require a college degree is considered underemployed.”

The following figure shows data on the unemployment rate for people ages 20 to 24 years (red line) with a bachelor’s degree, the unemployment rate for people ages 25 to 34 years (blue line) with a bachelor’s degree, and the unemployment rate for the whole population (green line) whatever their age and level of education. (Note that the values for college graduates are for those people who have a bachelor’s degree but no advanced degree, such as a Ph.D. or an M.D.)

The figure shows that unemployment rates are more volatile for both categories of college graduates than the unemployment rate for the population as a whole. The same is true for the unemployment rates for nearly any sub-category of the unemployed lagely because the number of people included the sub-categories in the Bureau of Labor Statistics (BLS) household survey is much smaller than for the population as a whole. The figure shows that, over time, the unemployment rates for the youngest college graduates is nearly always above the unemployment rate for the population as a whole, while the unemployment rate for college graduates 25 to 34 years old is nearly always below the unemployment rate for the population as a whole. In June of this year, the unemployment rate for the population as a whole was 4.1 percent, while the unemployment for the youngest college graduates was 7.3 percent.

Why is the unemployment rate for the youngest college graduates so high? An article in the Wall Street Journal offers one explanation: “The culprit, economists say, is a general slowdown in hiring. That hasn’t really hurt people who already have jobs, because layoffs, too, have remained low, but it has made it much harder for people who don’t have work to find employment.” The following figure shows that the hiring rate—defined as the number of hires during a month divided by total employment in that month—has been falling. The hiring rate in June was 3.4 per cent, which—apart from two months at the beginning of the Covid pandemic—is the lowest rate since February 2014.

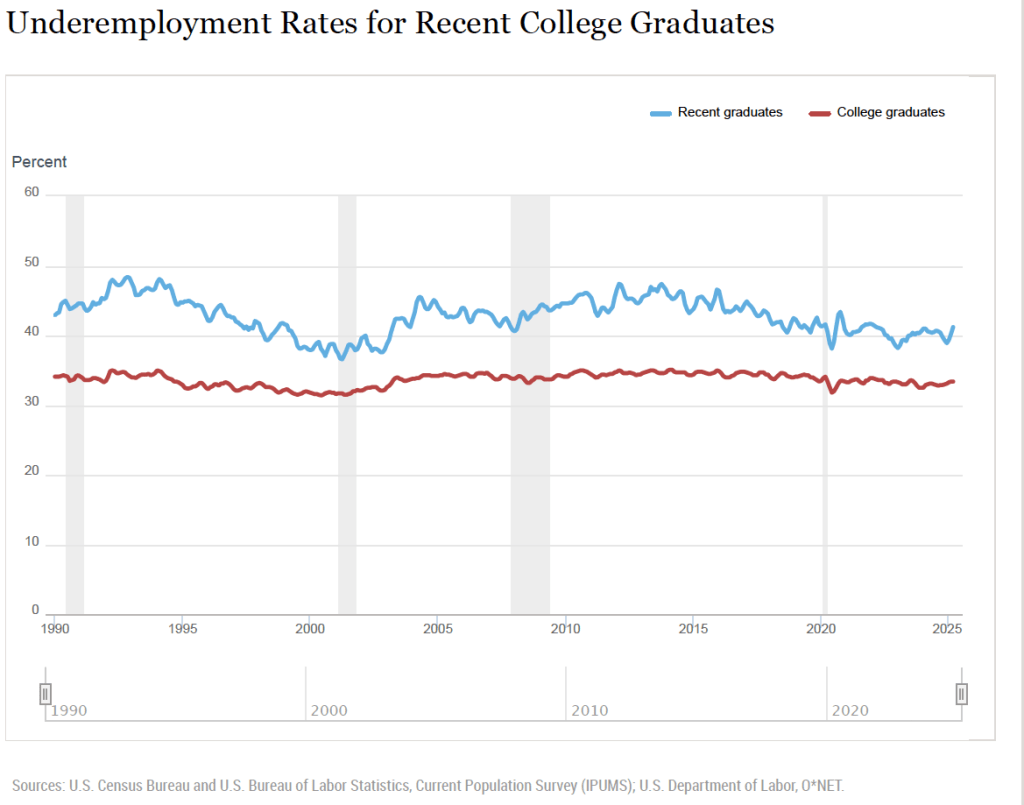
Abel and Deitz, of the New York Fed, have calculated the underemployment for new college graduates and for all college graduates. These data are shown in the following figure from the New York Fed site. The definitions used are somewhat different from the ones in the earlier figures. The definition of college graduates includes people who have advanced degrees and the definition of young college graduates includes people aged 22 years to 27 years. The data are three-month moving averages.

The data show that the underemployment rate for both recent graduates and all graduates are relatively high for the whole period shown. Typically, more than 30 percent of all college graduates and more than 40 percent of recent college graduates work in jobs in which more than 50 percent of employees don’t have college degrees. The latest underemployment rate for recent graduates is the highest since March 2022. It’s lower, though, than the rate for most of the period between the Great Recession of 2007–2009 and the Covid recession of 2020.

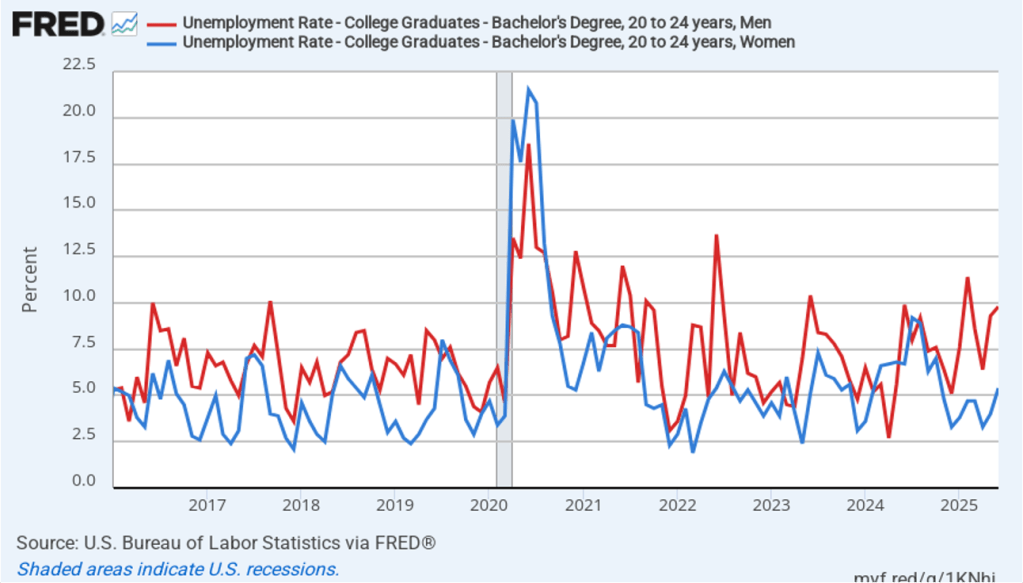
In a recent article, John Burn-Murdoch, a data journalist for the Financial Times, has made the point that the high unemployment rates of recent college graduates are concentrated among males. As the following figure shows, in recent months, unemployment rates among male college graduates 20 to 24 years old have been significantly higher than the unemployment rates among female college graduates. In June 2025, the unemployment rate for male recent college graduates was 9.8 percent, well above the 5.4 percent unemployment for female recent college graduates.

What explains the rise in male unemployment relative to female unemployment? Burn-Murdoch notes that, contrary to some media reports, the answer doesn’t seem to be that AI has resulted in a contraction in entry-level software coding jobs that have traditionally been held disproportionately by males. He presents data showing that “early-career coding employment is now tracking ahead of the [U.S.] economy.”

Instead he believes that the key is the continuing strong growth in healthcare jobs, which have traditionally been held disproportionately by females. The availability of these jobs has allowed women to fare better than men in an economy in which hiring rates have been relatively low.

Like most short-run trends, it’s possible that the relatively high unemployment rates experienced by recent college graduates may not continue in the long run.

Data on the Economics Major

Image generated by ChatGTP-4o.

How does the number of people who majored in economics in college compare with the number of people who pursued other majors? How do the earnings of economics majors compare with the earnings of other majors? Recent data released by the Census Bureau provides some interesting answers to these and other questions about the economics major.

Each year the Census Bureau conducts the American Community Survey (ACS) by mailing a questionnaire to about 3.5 million households. The questionnaire contains 100 questions that ask about, among other things, the race, sex, age, educational attainment, employment, earnings, and health status of each person in the household.  Responses are collected online, by mail, by telephone, or by a personal visit from a census employee.

Although the Census Bureau releases some data about 1 year after the data is collected, it typically takes longer to publish detailed studies of specific topics. The ACS report on Field of Bachelor’s Degree in the United States: 2022 was released this month, although it’s based on data collected during 2022. Anyone interested in the subject will find the whole report to be worthwhile reading, but we can summarize a few of the results.

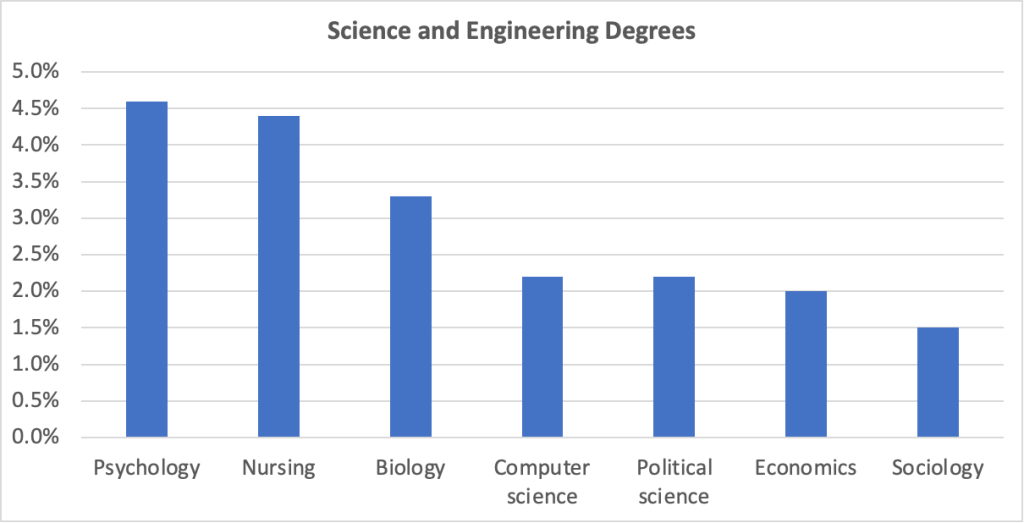
According to the census, in 2022, there were 81.9 million people in the United States aged 25 and older who had graduated from college with a bachelor’s degree. The report includes economics, along with several other social sciences—psychology, political science, and sociology—in the category of “Engineering and Science Degrees.” The following figure shows the leading majors in this category ranked by the percentage of all holders of a bachelor’s degree. (Sociology is included for comparison with the other three social sciences listed.) Psychology has the largest share of majors at 4.6 percent. Economics accounts for 2.0 percent of majors.

We can conclude that among social science majors, economics is less than half as popular as psychology, slightly less popular than political science, and significantly more popular than sociology.

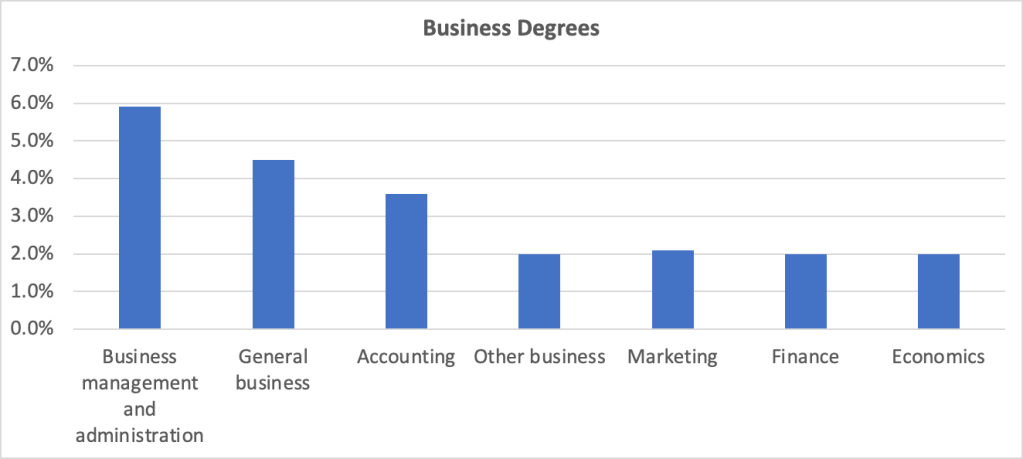
Economics departments are sometimes located in undergraduate business colleges. The following figure compares economics to other majors listed in the “Business Degrees” category of the report. At nearly 6 percent of all majors, “business management and administration” is the most popular of business majors, followed by general business and accounting. “Other business,” marketing, finance, and economics are all about equally popular with around 2 percent of all majors.

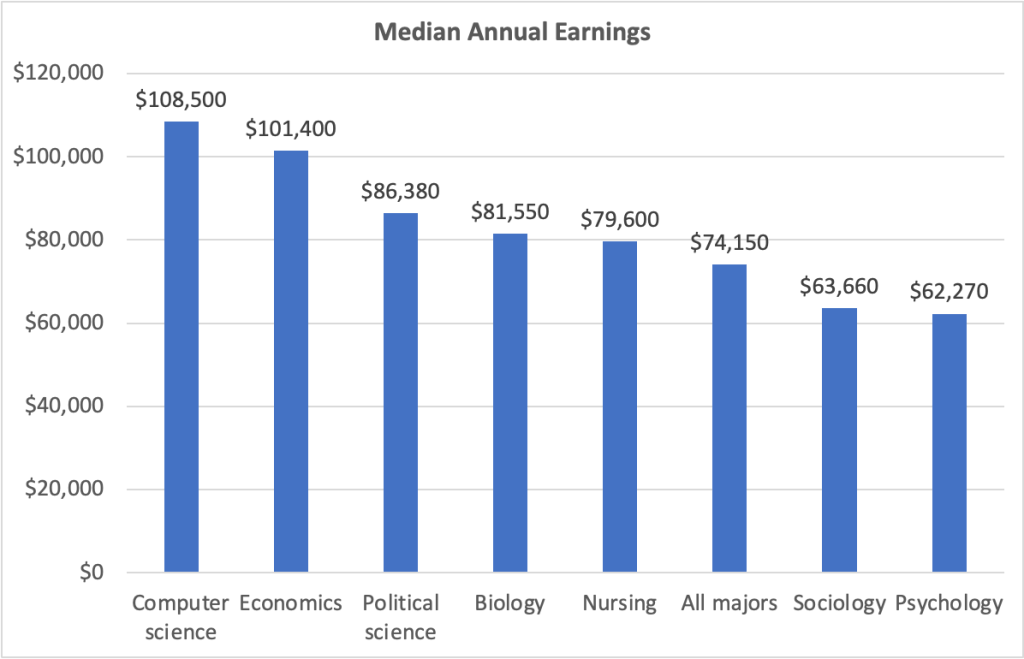
The figure below shows the median annual earnings for people aged 25 years to 64 years—prime-age workers—who majored in each of fields used in the first figure above, as well as for all holders of a bachelor’s degree. People who majored in economics earn significantly more than people who majored in the other social sciences listed and 35 percent more than people in all majors.

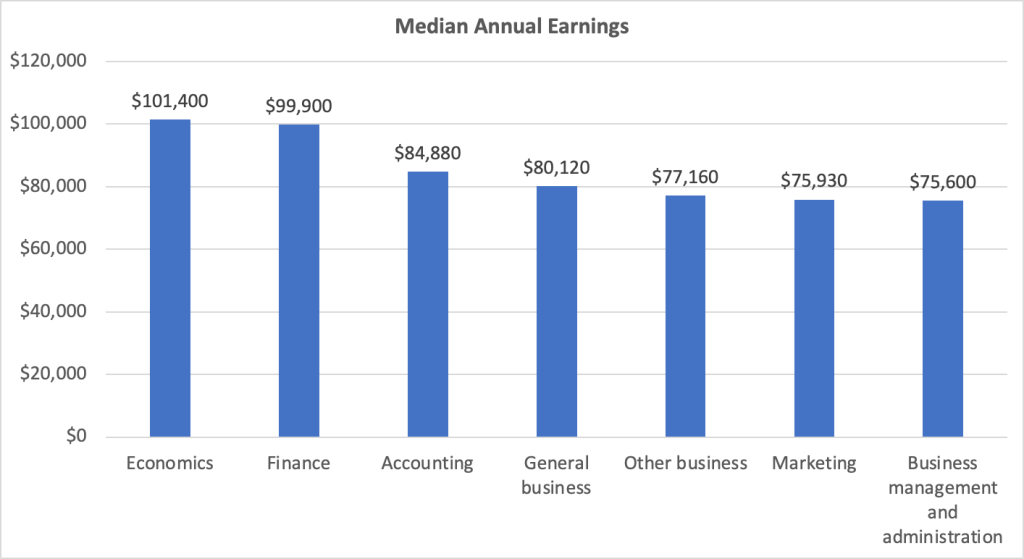
 The next figure shows median annual earnings for economics majors compared with majors in other business fields. Perhaps surprisingly—although not to people who know the many benefits from majoring in economics!—economics majors earn more on average than do majors in other business fields.

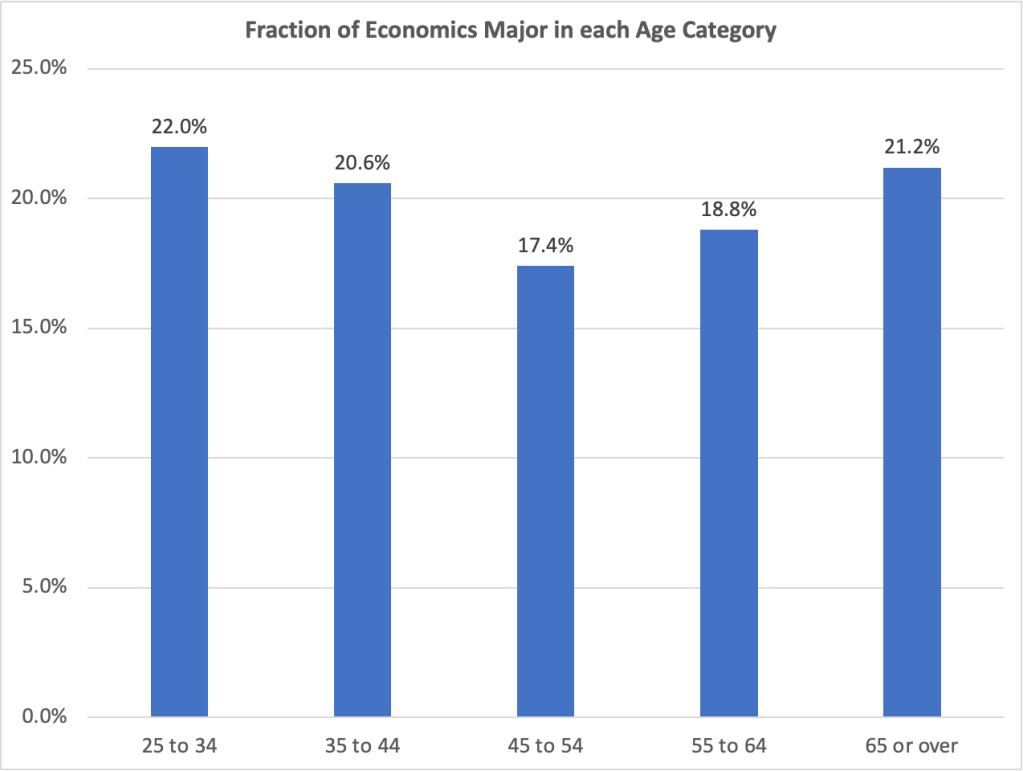
The following figure shows how many people with bacherlor’s degrees in economics majors fall into each age group. People aged 25 years to 34 years make up 22 percent of all economics majors, the most of any of the age groups. This result indicates that the economics major has gained in popularity (although note that the age groups don’t have equal numbers of people in them).

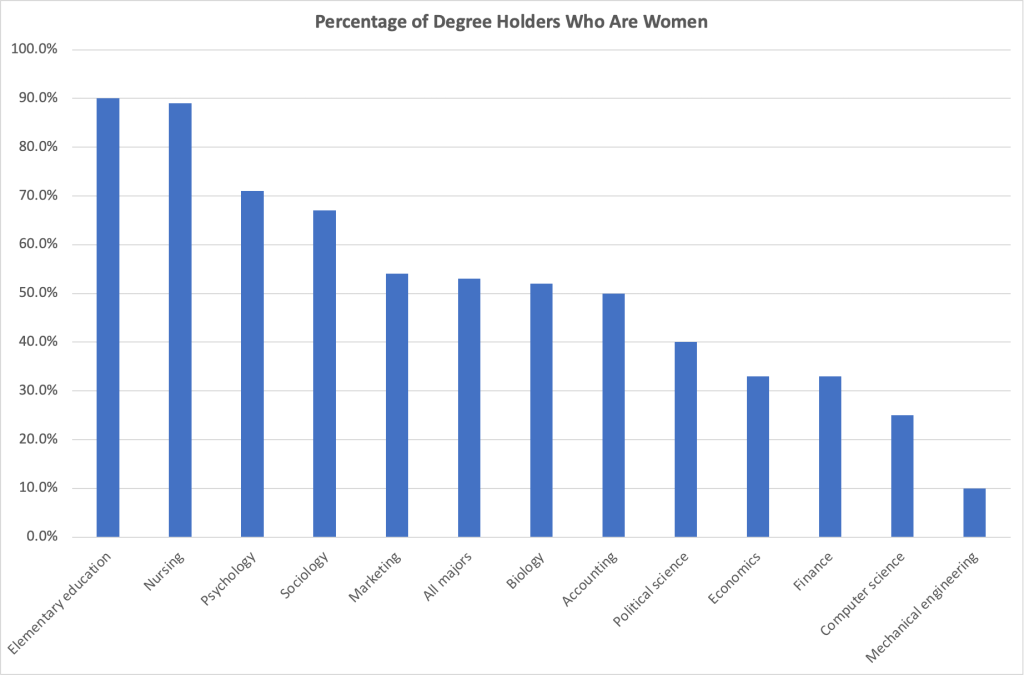
Finally, we can look at the demographic characteristics of economics majors. The next figure shows the percentage of degree holders in some popular majors who are women. Although women hold 53 percent of all bachelor’s degrees, they hold only 33 percent of bachelor’s degrees in economics. The share for economics is lower than for the other social sciences shown, the same as for finance majors, and more than for computer science and mechanical engineering majors.

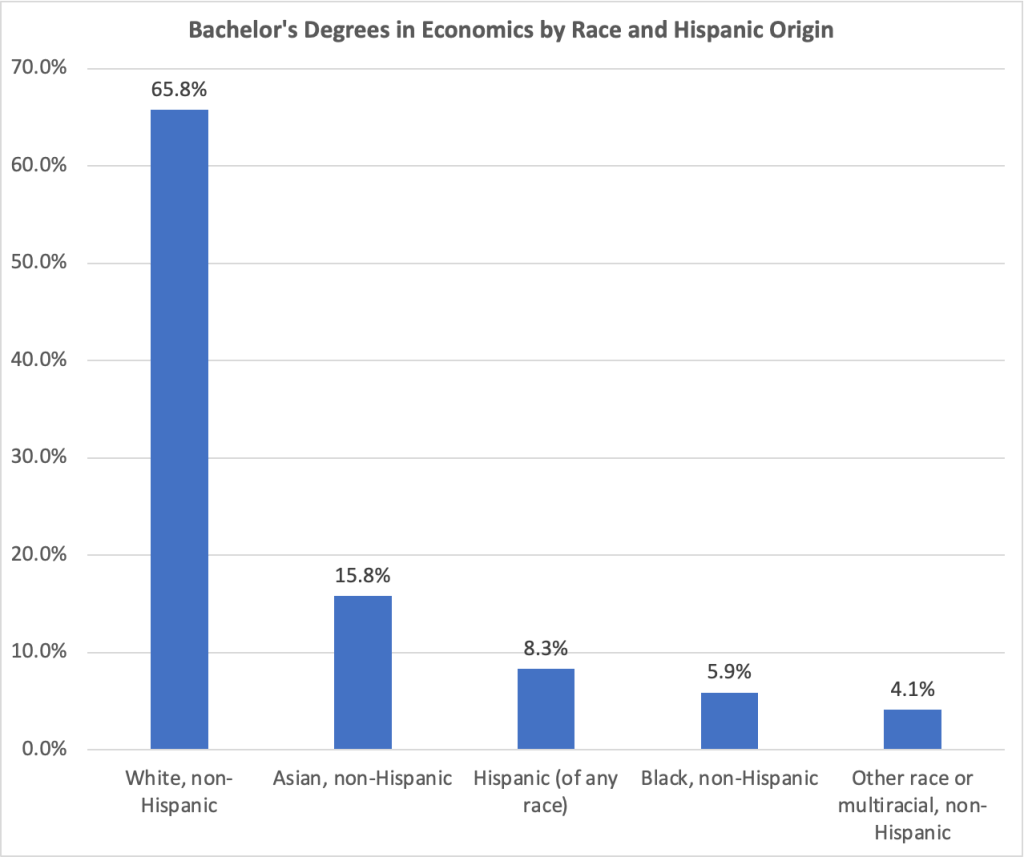
The next figure shows bachelor’s degrees in economics by race and Hispanic origin. Non-Hispanic whites and non-Hispanic Asians are overrepresented among economics majors compared with the percentages they make up of all bachelor’s degree holders. Non-Hispanic Blacks and Hispanics are underrepresented among economics majors compared with the percentages they make up of all bachelor’s degree holders. People who are multiracial or of another race hold the same percentage of economics degrees as of degrees in other subjects.

Is Caitlin Clark Being Paid What She’s Worth?

Photo of Caitlin Clark when she played for the University of Iowa from Reuters via the Wall Street Journal.

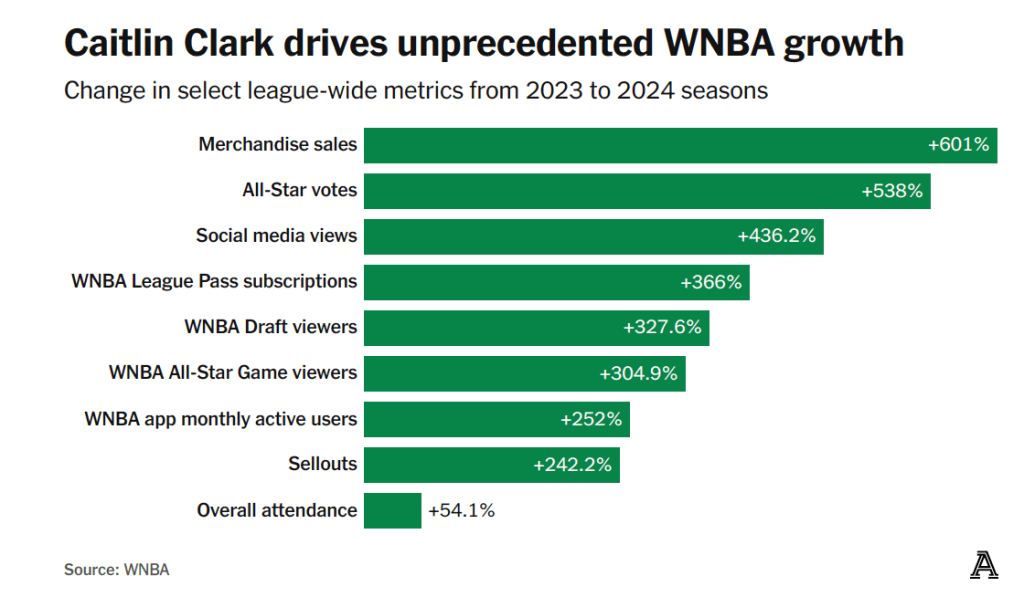
Caitlin Clark’s ability to hit three-point shots made her a star at the University of Iowa. Since she joined the Indiana Fever of the Women’s National Basketball Association (WNBA) in 2024, she’s been, arguably, the league’s biggest star. An article on theathletic.com discussing Clark’s effect on the league includes the following chart:

Clark’s popularity has resulted in substantially increased revenue for her team and for the WNBA. Should that fact affect the salary she receives from the Indiana Fever? The article states that: “Clark will almost assuredly never receive in salary what she is worth to the WNBA. In that regard, she’s a lot like [former men’s basketball star Michael] Jordan, and other all-time greats across sports.” Why won’t Clark be paid a salary equal to her worth to the WNBA?

In Microeconomics, Chapter 16, we show that in a competitive labor market, workers receive the value of their maginal products. The value of a basketball player’s marginal product is the additional revenue the player’s team earns from employing the player. We note that the marginal product of an athlete is the additional number of games the athlete’s team wins by employing the player. The value of a player’s marginal product is the additional revenue the team earns from those additional wins. Teams that win more games attract more fans to watch the teams play—both in person and on television or online. Teams earn revenue from selling tickets, as well as concessions and souvenirs sold in the area. Teams are paid for the rights to broadcast or stream their games. And, as the chart above shows, a player as popular as Clark will increase the game jerseys and other merchandise a team can sell.

We note in Chapter 16 that, once their inital contracts with their teams expire, the best professional athletes tend to sign contracts with teams in larger cities. Although an athlete’s marginal product may be no larger in a big city than in a smaller city, the revenue a team earns from the additional games the team wins from employing a star athlete depends in part on the population of the city the team plays in. Clark’s 2025 salary is only $78,066, far below the value of her marginal product, which is likely at least several million dollars. Her current contract with the Fever lasts through the 2027 season. But even after the contract expires, by league rules, she can’t be paid more than $294,244 by whichever team signs her. (It’s possible that amount may have increased by the time her current contract expires.)

The ceiling on WBNA salaries is far below the average salary in most U.S. men’s professional leagues. For instance, the average salary in the men’s National Basketball Association (NBA) during the 2024–2025 year was nearly $12 million. A low salary cap is common in leagues that are relatively new or that aren’t popular enough to receive large payments for the rights to broadcast or stream their games. For example, men’s Major League Soccer (MLS) has a salary limit of about $6 million per team. The WNBA was founded in 1996 (the NBA was founded in 1946) and, although the broadcast and online viewership for its games has increased, its viewership remains well below the NBA’s viewership.

Clark has been earning millions of dollars from endorisng Nike, Gatoade, and other products. But unless the factors just discussed change, it seems unlikely that she will receive a salary equal to the value of her marginal product to the Fever or any WNBA team she might play for in the future. The excerpt from theathletic.com article that we quoted above, though, compares her salary not to the value of her marginal product to the Fever but to the WNBA as a whole. Are there any circumstances under which we might expect a major sports star to be paid a salary equal to the additional revenue he or she is generating for a league as a whole?

The quotation from the article notes that no “all-time great” players, inclduing Michael Jordan of the NBA, have received salaries equal to the value of their marginal product to the leagues they played in. This outcome shouldn’t be surprising. Returns that entrepreneurs or workers earn in a market system are typically well below the total value they provide to society. For example, in a classic academic paper Nobel laureate William Nordhaus of Yale University estimated that entrepreneurs keep just 2.2 percent of the economic surplus they create by founding new firms. (We discuss the concept of economic surplus in Microeconomics, Chapter 4.) Leaving aside the monetary value of Clark to her team and her league, she has provided substantial consumer surplus to viewers of her games that is not captured by arena ticket prices or cable or streaming subscriptions. As we discuss in Chapter 4, the same is true of most goods and services in competitive markets.

Caitlin Clark, like Amazon founder Jeff Bezos, has only received a small fraction of the economic surplus she has created. (Photo from the Wall Street Journal)

So, although Caitlin Clark is a millionaire as a result of the money she has been paid to endorse products, the actual additional value she has created for her team, her league, and the economy is far greater than the income she earns.

“Clark will almost assuredly never receive in salary what she is worth to the WNBA. In that regard, she’s a lot like [Michael] Jordan, and other all-time greats across sports.”

The Strikingly Large Role of Foreign-Born Workers in the Growth of the U.S. Labor Force

As we noted in a recent post on the latest jobs report, the Bureau of Labor Statistics (BLS) has updated the population estimates in its household employment survey to reflect the revised population estimates from the Census Bureau. The census now estimates that the civilian noninstitutional population was about 2.9 million larger in December 2024 than it had previously estimated. The original undercount was significantly driven by an underestimate of the increase in the immigrant population.

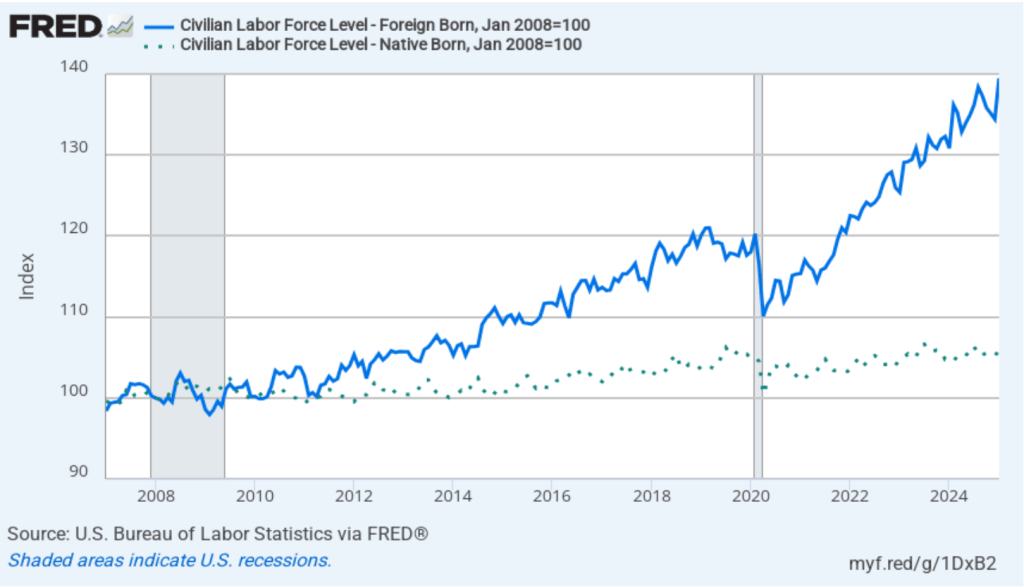
The following figure shows the more rapid growth of foreign-born workers in recent years in comparison with the growth in native-born workers. In the figure, we set the number of native-born workers and the number of foreign-born workers both equal to 100 in January 2007. Between January 2007 and January 2025, the number of foreign-born workers increased by 40 percent, while the number of native-born workers increased by only 6 percent.

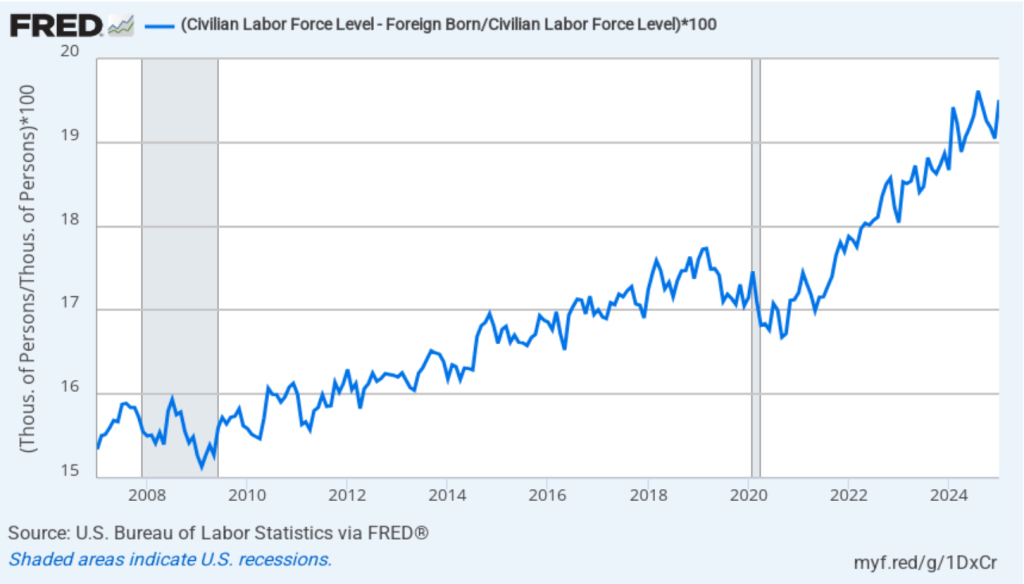
As the following figure shows, although foreign-born workers are an increasingly larger percentage of the total labor force, native-born workers are still a large majority of the labor force. Foreign-born workers were 15.3 percent of the labor force in January 2007 and 19.5 percent of the labor force in January 2025. Foreign-born workers accounted for about 56 percent of the increase in the total labor force over the period from January 2007 to January 2025.

H/T to Jason Furman for pointing us to the BLS data.

DeepSeek, Nvidia, and the Effect of New Information on Stock Prices

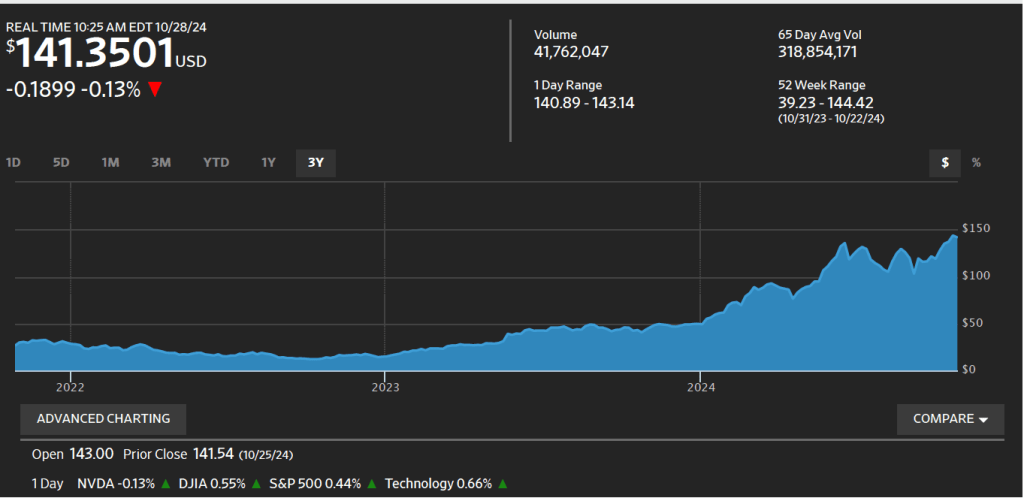
At the close of stock trading on Friday, January 24 at 4 pm EST, Nvidia’s stock had a price of $142.62 per share. When trading reopened at 9:30 am on Monday, January 27, Nvidia’s stock price plunged to $127.51. The total value of all Nvidia’s stock (the firm’s market capitalization or market cap) dropped by $589 billion—the largest one day drop in market cap in history. The following figure from the Wall Street Journal shows movements in Nvidia’s stock price over the past six months.

What happened to cause should a dramatic decline in Nvidia’s stock price? As we discuss in Macroeconomics, Chapter 6 (Economics, Chapter 8, and Money, Banking, and the Financial System, Chapter 6), Nividia’s price of $142.62 at the close of trading on January 24—like the price of any publicly traded stock—reflected all the information available to investors about the company. For the company’s stock to have declined so sharply at the beginning of the next trading day, important new information must have become available—which is exactly what happened.

As we discussed in this blog post from last October, Nvidia has been very successful in producing state-of-the-art computer chips that power the most advanced generative artificial intelligence (AI) software. Even after Monday’s plunge in the value of its stock, Nvidia still had a market cap of nearly $3.5 trillion at the end of the day. It wasn’t news that DeepSeek, a Chinese AI company had produced AI software called R1 that was similar to ChatGTP and other AI software produced by U.S. companies. The news was that R1—the latest version of the software is called V3—appeared to be comparable in many ways to the AI software produced by U.S. firms, but had been produced by DeepSeek despite not using the state-of-the-art Nvidia chips used in those AI programs.

The Biden administration had barred export to China of the newest Navidia chips to keep Chinese firms from surging ahead of U.S. firms in developing AI. DeepSeek claimed to have developed its software using less advanced chips and have trained its software at a much lower cost than U.S. firms have been incurring to train their software. (“Training” refers to the process by which engineers teach software to be able to accurately solve problems and answer questions.) Because DeepSeek’s costs are lower, the company charges less than U.S. AI firms do to use its computer infrastructure to handle business tasks like responding to consumer inquiries.

If the claims regarding DeepSeek’s software are accurate, then AI firms may no longer require the latest Nvidia chips and may be forced to reduce the prices they can charge firms for licensing their software. The demand for electricity generation may also decline if it turns out that the demand for AI data centers, which use very large amounts of power, will be lower than expected.

But on Monday it wasn’t yet clear whether the claims being made about DeepSeek’s software were accurate. Some industry observers speculated that, despite the U.S. prohibition on exporting the latest Nvidia chips to China, DeepSeek had managed to obtain them but was reluctant to admit that it had. There were also questions about whether DeepSeek had actually spent as little as it claimed in training its software.

What happens to the price of Nvidia’s stock during the rest of the week will indicate how investors are evaluating the claims DeepSeek made about its AI software.

The Amazing Rise of Nvidia

Nvidia’s headquarters in Santa Clara, California. (Photo from nvidia.com)

Nvidia was founded in 1993 by Jensen Huang, Chris Malachowsky, and Curtis Priem, electrical engineers who started the company with the goal of designing computer chips that would increase the realism of images in video games. The firm achieved a key breakthrough in 1999 when it invented the graphics processing unit, or GPU, which it marketed under the name GeForce256. In 2001, Microsoft used a Nvidia chip in its new Xbox video game console, helping Nvidia to become the dominant firm in the market for GPUs.

The technology behind GPUs has turned out to be usable not just for gaming, but also for powering AI—artificial intelligence—software. The market for Nvidia’s chips exploded witth technology giants Google, Microsoft, Facebook and Amazon, as well as many startups ordering large quantites of Nvidia’s chips.

By 2016, Nvidia CEO Jen-Hsun Huang could state in an interview that: “At no time in the history of our company have we been at the center of such large markets. This can be attributed to the fact that we do one thing incredibly well—it’s called GPU computing.” Earlier this year, an article in the Economist noted that: “Access to GPUs, and in particular those made by Nvidia, the leading supplier, is vital for any company that wants to be taken seriously in artificial intelligence (AI).”

Nvidia’s success has been reflected in its stock price. When Nvidia became a public company in 1999 by undertaking an initial public offering (IPO) of stock, a share of the firm’s stock had a price of $0.04, adjusted for later stock splits. The large profits Nvidia has been earning in recent years have caused its stock price to rise to more than $140 dollars a share.

(With a stock split, a firm reduces the price per share of its stock by giving shareholders additional shares while holding the total value of the shares constant. For example, in June of this year Nvidia carried out a 10 for 1 stock split, which gave shareholders nine shares of stock for each share they owned. The total value of the shares was the same, but each share now had a price that was 10 percent of its price before the split. We discuss the stock market in Microeconomics, Chapter 8, Section 8.2, Macroeconomics, Chapter 6, Section 6.2, and Economics, Chapter 8, Section 8.2.)

The following figure from the Wall Street Journal shows the sharp increase in Nvidia’s stock price over the past three years as AI has become an increasingly important part of the economy.

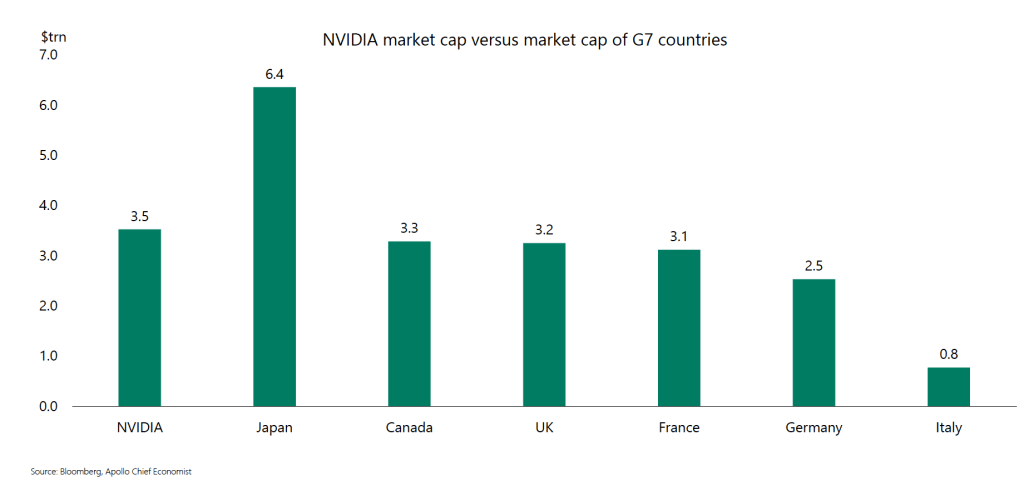
Nvidia’s market capitalization (or market cap)—the total value of all of its outstanding shares of stock—is $3.5 trillion.  How large is that? Torsten Sløk, the chief economist at Apollo, an asset management firm, has noted that, as shown in the following figure, Nvidia’s market cap is larger than the total market caps—the total value of all the publicly traded firms—in five large economies.

Can Nvidia’s great success continue? Will it be able to indefinitely dominate the market for AI chips? As we noted in Apply the Concept “Do Large Firms Live Forever?” in Microeconomics Chapter 14, in the long run, even the most successful firms eventually have their positions undermined by competition. That Nvidia has a larger stock market value than the total value of all the public companies in Germany or the United Kingdom is extraordinary and seems impossible to sustain. It may indicate that investors have bid up the price of Nvidia’s stock above the value that can be justified by a reasonable forecast of its future profits.

There are already some significant threats to Nvidia’s dominant position in the market for AI chips. GPUs were originally designed to improve computer displays of graphics rather than to power AI software. So, one way of competing with Nvidia that some startups are trying to exploit is to design chips specifically for use in AI. It’s also possible that larger chips may make it possible to use fewer chips than when using GPUs, possibly reducing the total cost of the chips necessary to run sophisticated AI software. In addition, existing large technology firms, such as Amazon and Microsoft, have been developing chips that may be able to compete with Nvidia.

As with any firm, Nvidia’s continued success requires it to innovate sufficiently to stay ahead of the many competitors that would like to cut into the firm’s colossal profits.

Glenn’s Interview with Jim Pethokoukis

Glenn discusses Fed policy, the state of the U.S economy, economic growth, China in the world economy, industrial policy, protectionism, and other topics in this episode of the Political Economy podcast from the American Enterprise Institute.

https://podcasts.apple.com/us/podcast/glenn-hubbard-a-pro-growth-policy-agenda/id589914386?i=1000665131415

Solved Problem: If Employment and Unemployment Both Increase, What Happens to the Unemployment Rate?

Supports: Macroeconomics, Chapter 9, Economics, Chapter 19, and Essentials of Economics, Chapter 13.

Image generated by GTP-4o.

In its “Employment Situation” report for July 2024, the Bureau of Labor Statistics (BLS) stated that according to the household survey the total number of people employed, the total number of people unemployed, and the unemployment rate all increased. Would we expect this result to always hold? That is, in a month in which both the total number of people employed and the total number of people unemployed increased will the unemployment rate always increase? Briefly explain.

Solving the Problem
Step 1: Review the chapter material. This problem is about calculating the unemployment rate, so you may want to review Chapter 9, Section 9.1, “Measuring the Unemployment Rate, the Labor Force Participation Rate, and the Employment-Population Ratio.” 

Step 2: Answer the question by explaining whether we can be certain what happens to the unemployment rate in a month in which both the total number of people employed and the total number of people unemployed increased.  The unemployment rate is equal to the number of people unemployed divided by the number of people in the labor force (multiplied by 100). The labor force equals the sum of the number of people employed and the number of people unemployed.

Suppose, for example, that the unemployment rate in the previous month was 4 percent. If both the number of people employed and the number of people unemployed increase, the unemployment rate will increase if the increase in the number of people unemployed as a percentage of the increase in the labor force is greater than 4 percent. The unemployment rate will decrease if the increase in the number of people unemployed as a percentage of the increase in the labor force is less than 4 percent.  

Consider a simple numerical example. Suppose that in the previous month there were 96 people employed and 4 people unemployed. In that case, the unemployment rate will be (4/(96 + 4)) x 100 = 4.0%.

Suppose that during the month the number of people employed increases by 30 and the number of people unemployed increases by 1. In that case, there are now 126 people employed and 5 people unemployed. The unemployment rate will have fallen from 4.0% to (5/(126 + 5)) x 100 = 3.8%.

Now suppose that the number of people employed increased by 30 and the number of people unemployed increases by 3. The unemployment will have risen from 4.0% to (7/(126 + 7)) x 100 = 5.3%.

We can conclude that what happened in July 2024 need not always happen. If both the total number of people employed and the total number of people unemployed increased during a given month, we can’t be sure whether the unemployment rate has increased or decreased.

Glenn’s Op-Ed on the Need for Pro-Growth Policies

(Photo from the New York Times.)

This op-ed orginally appeared in the Wall Street Journal.

Put Growth Back on the Political Agenda

In a campaign season dominated by the past, a central economic topic is missing: growth. Rapid productivity growth raises living standards and incomes. Resources from those higher incomes can boost support for public goods such as national defense and education, or can reconfigure supply chains or shore up social insurance programs. A society without growth requires someone to be worse off for you to be better off. Growth breaks that zero-sum link, making it a political big deal.

So why is the emphasis on growth fading? More than economics is at play. While progress from technological advances and trade generally is popular, the disruption that inevitably accompanies growth and hits individuals, firms and communities has many politicians wary. Such concerns can lead to excessive meddling via industrial policy.

As we approach the next election, the stakes for growth are high. Regaining the faster productivity that prevailed before the global financial crisis requires action. The nonpartisan Congressional Budget Office estimates  potential gross domestic product growth of 1.8% over the coming decade, and somewhat lower after that. Those figures are roughly 1 percentage point lower than the growth rate over the three decades before the pandemic. Many economists believe productivity gains from generative artificial intelligence can raise growth in coming decades. But achieving those gains requires an openness to change that is rare in a political climate stuck in past grievances about disruption—the perennial partner of growth.

Traditionally, economic policy toward growth emphasized support for innovation through basic research. Growth also was fostered by reducing tax burdens on investment, streamlining regulation (which has proliferated during the Biden administration) and expanding markets. These important actions have flagged in recent years. But such attention, while valuable, masks inattention to adverse effects on some individuals and communities, raising concerns about whether open markets advance broad prosperity.

This opened a lane for backward-looking protectionism and industrial policy from Democrats and Republicans alike. Absent strong national-defense arguments (which wouldn’t include tariffs on Canadian steel or objections to Japanese ownership of a U.S. steel company), protectionism limits growth. According to polls by the Chicago Council on Global Affairs, roughly three-fourths of Americans say international trade is good for the economy. Finally, protectionism belies ways in which gains from openness may be preserved, such as by simultaneously offering support for training and work for communities of individuals buffeted by trade and technological change.

On industrial policy, it is true that markets can’t solve every allocation problem. But such concerns underpin arguments for greater federal support of research for new technologies in defense, climate-change mitigation, and private activity, not micromanaged subsidies to firms and industries. If a specific defense activity merits assistance, it could be subsidized. These alternatives mitigate the problems in conventional industrial policy of “winner picking” and, just as important, the failure to abandon losers. It is policymakers’ hyperattention to those buffeted by change that hampers policy effectiveness and, worse, invites rent-seeking behavior and costly regulatory micromanagement.

Examples abound. Appending child-care requirements to the Chips Act and the inaptly named Inflation Reduction Act has little to do with those laws’ industrial policy purpose. The Biden administration’s opposition to Nippon Steel’s acquisition of U.S. Steel raises questions amid the current wave of industrial policy. How is a strong American ally’s efficient operation of an American steel company with U.S. workers an industrial-policy problem? Flip-flops on banning TikTok fuel uncertainty about business operations in the name of industrial policy.

The wrongly focused hyperattention is supposedly grounded in putting American workers first. But it raises three problems. First, the interventions raise the cost of investments, and the jobs they are to create or protect, by using mandates and generating policy uncertainty. Second, they contradict the economic freedom in market economies of voluntary transactions. Absent a strong national-security foundation, why is public policy directing investment in or ownership of assets? Such policies threaten the nation’s long-term prosperity by discouraging investment and invite rent-seeking in a way that voluntary market transactions don’t. Both problems hamstring growth. 

Third, and perhaps most important, such micromanagement misses the economic and political mark of actually helping individuals and communities disrupted by growth-enhancing openness. A more serious agenda would focus on training suited to current markets (through, for example, more assistance to community colleges), on work (through expanding the Earned Income Tax Credit), and on aid to communities hit by prolonged employment loss (through services that enhance business formation and job creation). The federal government could also establish research centers around the country to disseminate ideas for businesses. 

Growth matters—for individual livelihoods, business opportunities and public finances. Pro-growth policies that account for disruption’s effects while encouraging innovation, saving, capital formation, skill development and limited regulation must return to the economic agenda. A shift to prospective, visionary thinking would reorient the bipartisan, backward-looking protectionism and industrial policy that weaken growth and fail to address disruption.

Will the United States Experience a Sustained Boom in the Growth Rate of Labor Productivity?

Blue Planet Studio/Shutterstock

Recent articles in the business press have discussed the possibility that the U.S. economy is entering a period of higher growth in labor productivity:

“Fed’s Goolsbee Says Strong Hiring Hints at Productivity Growth Burst” (link)

“US Productivity Is on the Upswing Again. Will AI Supercharge It?” (link)

“Can America Turn a Productivity Boomlet Into a Boom?” (link)

In Macroeconomics, Chapter 16, Section 16.7 (Economics, Chapter 26, Section 26.7), we highlighted  the role of growth in labor productivity in explaining the growth rate of real GDP using the following equations. First, an identity:

Real GDP = Number of hours worked x (Real GDP/Number of hours worked),

where (Real GDP/Number of hours worked) is labor productivity.

And because an equation in which variables are multiplied together is equal to an equation in which the growth rates of these variables are added together, we have:

Growth rate of real GDP = Growth rate of hours worked + Growth rate of labor productivity

From 1950 to 2023, real GDP grew at annual average rate of 3.1 percent. In recent years, real GDP has been growing more slowly. For example, it grew at a rate of only 2.0 percent from 2000 to 2023. In February 2024, the Congressional Budget Office (CBO) forecasts that real GDP would grow at 2.0 percent from 2024 to 2034. Although the difference between a growth rate of 3.1 percent and a growth rate of 2.0 percent may seem small, if real GDP were to return to growing at 3.1 percent per year, it would be $3.3 trillion larger in 2034 than if it grows at 2.0 percent per year. The additional $3.3 trillion in real GDP would result in higher incomes for U.S. residents and would make it easier for the federal government to reduce the size of the federal budget deficit and to better fund programs such as Social Security and Medicare. (We discuss the issues concerning the federal government’s budget deficit in this earlier blog post.)

Why has growth in real GDP slowed from a 3.1 percent rate to a 2.0 percent rate? The two expressions on the right-hand side of the equation for growth in real GDP—the growth in hours worked and the growth in labor productivity—have both slowed. Slowing population growth and a decline in the average number of hours worked per worker have resulted in the growth rate of hours worked to slow substantially from a rate of 2.0 percent per year from 1950 to 2023 to a forecast rate of only 0.4 percent per year from 2024 to 2034.

Falling birthrates explains most of the decline in population growth. Although lower birthrates have been partially offset by higher levels of immigration in recent years, it seems unlikely that birthrates will increase much even in the long run and levels of immigration also seem unlikely to increase substantially in the future. Therefore, for the growth rate of real GDP to increase significantly requires increases in the rate of growth of labor productivity.

The Bureau of Labor Statistics (BLS) publishes quarterly data on labor productivity. (Note that the BLS series is for labor productivity in the nonfarm business sector rather than for the whole economy. Output of the nonfarm business sector excludes output by government, nonprofit businesses, and households. Over long periods, growth in real GDP per hour worked and growth in real output of the nonfarm business sector per hour worked have similar trends.) The following figure is taken from the BLS report “Productivty and Costs,” which was released on February 1, 2024.

Note that the growth in labor productivity increased during the last three quarters of 2023, whether we measure the growth rate as the percentage change from the same quarter in the previous year or as growth in a particular quarter expressed as anual rate. It’s this increase in labor productivity during 2023 that has led to speculation that labor productivity might be entering a period of higher growth. The following figure shows labor productivity growth, measured as the percentage change from the same quarter in the previous year for the whole period from 1950 to 2023.

The figure indicates that labor productivity has fluctuated substantially over this period. We can note, in particular, productivity growth during two periods: First, from 2011 to 2018, labor productivity grew at the very slow rate of 0.9 percent per year. Some of this slowdown reflected the slow recovery of the U.S. economy from the Great Recession of 2007-2009, but the slowdown persisted long enough to cause concern that the U.S. economy might be entering a period of stagnation or very slow growth.

Second, from 2019 through 2023, labor productivity went through very large swings. Labor productivity experienced strong growth during 2019, then, as the Covid-19 pandemic began affecting the U.S. economy, labor productivity soared through the first half of 2021 before declining for five consecutive quarters from the first quarter of 2022 through the first quarter of 2023—the first time productivity had fallen for that long a period since the BLS first began collecting the data. Although these swings were particularly large, the figure shows that during and in the immediate aftermath of recessions labor productivity typically fluctuates dramatically. The reason for the fluctuations is that firms can be slow to lay workers off at the beginning of a recession—which causes labor productivity to fall—and slow to hire workers back during the beginning of an economy recovery—which causes labor productivity to rise. 

Does the recent increase in labor productivity growth represent a trend? Labor productivity, measured as the percentage change since the same quarter in the previous year, was 2.7 percent during the fourth quarter of 2023—higher than in any quarter since the first quarter of 2021. Measured as the percentage change from the previous quarter at an annual rate, labor productivity grew at a very high average rate of 3.9 during the last three quarters of 2023. It’s this high rate that some observers are pointing to when they wonder whether growth in labor productivity is on an upward trend.

As with any other economic data, you should use caution in interpreting changes in labor productivity over a short period. The productivity data may be subject to large revisions as the two underlying series—real output and hours worked—are revised in coming months. In addition, it’s not clear why the growth rate of labor productivity would be increasing in the long run. The most common reasons advanced are: 1) the productivity gains from the increase in the number of people working from home since the pandemic, 2) businesses’ increased use of artificial intelligence (AI), and 3) potential efficiencies that businesses discovered as they were forced to operate with a shortage of workers during and after the pandemic.

To this point it’s difficult to evaluate the long-run effects of any of these factors. Wconomists and business managers haven’t yet reached a consensus on whether working from home increases or decreases productivity. (The debate is summarized in this National Bureau of Economic Research Working Paper, written by Jose Maria Barrero of Instituto Tecnologico Autonomo de Mexico, and Steven Davis and Nicholas Bloom of Stanford. You may need to access the paper through your university library.)

Many economists believe that AI is a general purpose technology (GPT), which means that it may have broad effects throughout the economy. But to this point, AI hasn’t been adopted widely enough to be a plausible cause of an increase in labor productivity. In addition, as Erik Brynjolfsson and Daniel Rock of MIT and Chad Syverson of the University of Chicago argue in this paper, the introduction of a GPT may initially cause productivity to fall as firms attempt to use an unfamiliar technology. The third reason—efficiency gains resulting from the pandemic—is to this point mainly anecdotal. There are many cases of businesses that discovered efficiencies during and immediately after Covid as they struggled to operate with a smaller workforce, but we don’t yet know whether these cases are sufficiently common to have had a noticeable effect on labor productivity.

So, we’re left with the conclusion that if the high labor productivity growth rates of 2023 can be maintained, the growth rate of real GDP will correspondingly increase more than most economists are expecting. But it’s too early to know whether recent high rates of labor productivty growth are sustainable.