The Economics of Apple’s Vision Pro

Photo from apple.com.

On Friday, February 2, Apple released Vision Pro, its long-awaited, much discussed virtual reality (VR) headset. The Vision Pro headset allows users to experience either VR, in which the user sees only virtual objects, as for instance when the user sees only images from a video game; or augmented reality (AR), in which the user sees virtual objects, such as icon apps or web pages superimposed on the real world (as in the two photos below). Apple refers to people using the headsets as being engaged in “spatial computing” and sometimes refers to the headsets as “face computers.”

Photo from Apple via the Wall Street Journal.

Photo from Apple via the Wall Street Journal.

Vision Pro has a price of $3,499, which can increase to more than $4,000 when including the cost of the insert necessary for anyone who wears prescription eyeglasses or contact lenses and who chooses to buy additional storage capacity. The price is much higher than Meta’s Quest Pro VR headset (shown in the photo below), which has a price of $999.

Photo from meta.com.

In this post, we can briefly discuss some of the economic issues raised by the Vision Pro. First, why would Apple charge such a high price? In her review of the Vision Pro in the Wall Street Journal, Joanna Stern, the site’s personal technology writer, speculated that: “You’re probably not going to buy the $3,500 Apple Vision Pro. Unless you’re an app developer or an Apple die-hard ….”  

There are several reasons why Apple may believe that a price of $3,499 is profit maximizing. But we should bear in mind that pricing any new product is difficult because firms lack good data on the demand curve and are unsure how consumers will respond to changes in price. In our new ninth edition of Economics and Microeconomics, in Chapter 6 on price elasticity we discuss how Elon Musk and managers at Tesla experimented with the cutting the price of the Model 3 car as they attempted to discover the effect on price changes on the quantity demanded. Managers at Apple are in similar situation of lacking good data on how many headsets they are likely to sell at $3,499.

If Apple lacks good data on how consumers are likely to respond to different prices, why pick a price four times as high as Meta is charging for its Quest Pro VR headsets?

First, Apple expects to be able to clearly differentiate its headset from Meta’s headset. If consumers considered the two headsets to be close substitutes, the large price difference would make it unlikely that Apple would sell many headsets. Apple has several marketing advantages over Meta that make it likely that Apple can convince many consumers that the Meta headset is not a close substitute for the Vision Pro: 

  1. Apple has a history of selling popular electronic products, such as the iPhone, iPad, Air Pods, and the Apple Watch. It also owns the most popular app store. Apple has succeeded in seamlessly integrating these electronic products with each other and with use of the app store. As a result, a significant number of consumers have a strong preference for Apple products over competitors. Meta has a much more limited history of selling popular electronic products. For instance, it doesn’t produce its own smartphone.
  2. Apple has an extensive network of retail stores inside and outside of the United States. The stores have been successful in giving consumers a chance to try a new electronic product before buying it and to receive help at the stores’ Genius Bars with setting up the device or dealing with any later problems.  Meta operates few retail stores, relying instead on selling through other retailers, such as Best Buy, or through  its online site. For some consumers Meta’s approach is less desirable than Apple’s.

Second, as we discuss in Economics and Microeconomics, Chapter 15, Section 15.5, charging a high price for a new electronic product is common, partly because doing so allows firms to price discriminate across time. With this strategy, firms charge a higher price for a product when it is first introduced and a lower price later. Some consumers are early adopters who will pay a high price to be among the first to own certain new products. Early adopers are a particularly large segment of buyers of Apple products, with long lines often forming at Apple stores on the days when a new product is released. That firms price discriminate over time helps explain why products such as Blu-ray players and 4K televisions sold for very high prices when they were first introduced. After the demand of the early adopters was satisfied, the companies reduced prices to attract more price-sensitive customers. For example, the price of Blu-ray players dropped by 95 percent within five years of their introduction. Similarly, we can expect that Apple will cut the price of Vision Pro significantly over time.

Third, because Apple is initially producing a relatively small number of units, it is likely experiencing a high average cost of producing the Vision Pro. The production of the components of the headset and the final assembly are likely to be subject to large economies of scale. (We discuss economies of scale in Economics and Microeconomics, Chapter 11, Section 11.6.) Apple hasn’t released information on how many units of the headset it intends to produce during 2024, but estimates are that it will be fewer than 400,000 and perhaps as few as 180,000. (Estimates can be found here, here, and here.) Compare that number to the 235 million iPhones Apple sold during 2023. We would expect as Apple’s suppliers increase their production runs, the average cost of production will decline as Apple moves down its long-run average cost curve. As a result, over time Apple is likely to cut the price.

In addition, when producing a new good, firms often experience learning as managers better understand the most efficient way to produce and assemble the new good. For example, the best method of assembling iPhones may not be the best method of assembling headsets, but this fact may only become clear after assembling several thousand headsets. Apple is likely to experience a learning curve with the average cost of producing headsets declining as the total number of headsets produced increases. While economies of scale involve a movement down a static long-run average cost curve, learning results in the long-run average cost curve shifting down. This second reason why Apple’s average cost of producing headsets will decline contributes to the liklihood that Apple will cut the price of the Vision Pro over time.

Finally, we can discuss a key factor that will determine how successful Apple is in selling headsets. In Chapter 11 of the new ninth edition of Economics and Microeconomics, we have a new Apply the Concept, “Mark Zuckerberg … Alone in the Metaverse?” In that feature, we note that Meta CEO Mark Zuckerberg has invested heavily in the metaverse, a word that typically means software programs that allow people to access either AR or VR images and information. Zuckerberg believed so strongly in the importance of the metaverse that he changed the name of the company from Facebook to Meta. The metaverse, which is accessed using headsets likes Meta’s Quest Pro or Apple’s Vision Pro, is subject to large network externalities—the usefulness of the headsets increases with the number of consumers who use them. The network externalities arise because many software applications, such as Meta’s Horizon World, depend on interactions among users and so are not very useful when there aren’t many users.

Meta hasn’t sold as many headsets as they expected because they have had difficulty attracting enough users to make their existing software useful and the failure to have enough users has reduced the incentive for other firms to develop apps for Meta’s headsets. Initially, some reviewers made similar comments about Apple’s Vision Pro. For instance, even though streaming films in 3D is one of the uses that Apple promotes, some streaming services, including Netflix and YouTube, have not yet released apps for Vision Pro. Some important business related apps, such as FaceTime and Zoom, aren’t yet available. There are also currently no workout apps. As one reviewer put it “there are few great apps” for Vision Pro. Another reviewer wondered whether the lack of compelling software and apps might result in the Vision Pro headset suffering the fate of “every headset I test [which] ends up in my closet collecting dust.”

So, a key to the success of the Vision Pro will be the ability of Apple to attract enough users to exploit the network externalities that exist with VR/AR headsets. If successful, the Vision Pro may represent an important development in the transition to spatial computing.

Solved Problem: The Houthis and the Price Elasticity of Demand for Shipping

Map from the Wall Street Journal.

Supports: Microeconomics and Economics Chapter 6, Section 6.2 and Esstentials of Economics, Chapter 7, Section 7.6.

The Houthis, a rebel group based in Yemen, have been attacking shipping in the Red Sea, which freighters sail through after exiting the Suez Canal. About 30 percent of global shipping travels through the Suez Canal. An article in the Financial Times noted that maritime insurance firms have increased their charges for insuring freight passing through the Suez Canal by about $6,000 per container.” The article also noted that: “Freight demand is price inelastic in the short run and transport isn’t a big part of overall costs.” And that “the average container holds about $100,000 worth of goods wholesale, which will be sold at destination for $300,000.”  

  1. Is there a connection between the observation that freight demand is price inelastic and the observation that the charge for transporting goods isn’t a large fraction of the price of the goods shipped by container? Briefly explain.
  2. The article notes that the main alternative to transporting freight by ship is to transport it by air, but if only 1 percent of freight sent by ship were to be sent by air instead, all the available flight capacity would be filled. Does this fact also have relevance to explaining the price inelasticity of demand for transporting freight by ship? Briefly explain.

Solving the Problem

Step 1: Review the chapter material. This problem is about the determinants of the price elasticity of demand, so you may want to review Microeconomics and Economics, Chapter 6, Section 6.2 (Essentials of Economics, Chapter 7, Section 7.6), “The Determinants of the Price Elasticity of Demand and Total Revenue.”

Step 2: Answer part a. by explaining why the small fraction that transportation is of the total price of the goods in a container of freight makes it more likely that the demand for shipping is price inelastic in the short run.  This section of the chapter notes that goods and services that are only a small fraction of a consumer’s budget tend to have less elastic demand than do goods and services that are a large faction. In this case, the consumer is a firm shipping freight. Because the $6,000 increase per container in the cost of shipping freight makes up only 2 percent of the dollar amount the freight can be sold for, shippers are likely not to significantly reduce the quantity of shipping services they demand. Note, though, that the article refers to the price elasticity of freight demand “in the short run.” It’s possible that over a longer period of time the market for transporting freight by ship may adjust by, for instance, firms offering to ship freight by air increasing their capacity and lowering their prices. In that case, the price elasticity of demand for transporting freight by ship will be higher in the long run than in the short tun.

Step 3: Answer part b. by explaining whether the limited amount of available capacity for sending freight by air may help explain why the demand for sending freight by ship is price inelastic.  This section of the chapter notes that the most important determinant of the price elasticity of demand for a good or service is the availability of close substitutes. That there is only a small amount of unused capacity to transport goods by air indicates that transporting goods by air is not a close substitute for transporting goods by sea. Therefore, we would expect that this factor contributes to the demand for transporting goods by sea being price inelastic in the short run.

California Deals with the Paradox of Tobacco Taxes

(Photo from Zuma Press via the Wall Street Journal.)

When state and local governments impose taxes on sales of liquor, on cigarettes and other tobacco products, or on soda and other sweetened beverages, they typically have two objectives: (1) Discourage consumption of the taxed goods, and (2) raise revenue to pay for government services.  As we discuss in Chapter 6 of Microeconomics (also Economics, Chapter 6), these objectives can be at odds with each other. The tax revenue a government receives depends on both the size of the tax and the number of units sold. Therefore, the more successful a tax is in significantly reducing, say, sales of cigarettes, the less tax revenue the government receives from the tax.

As we discuss in Chapter 6, a tax on a good shifts the supply curve for the good up by the amount of the tax. (We think it’s intuitively easier to think of a tax as shifting up a supply curve, but analytically the effect on equilibrium is the same if we illustrate the effect of the tax by shifting down the demand curve for the taxed good by the amount of the tax.)  A tax will raise the equilibrium price consumers pay and reduce the equilibrium quantity of the taxed good that they buy. For a supply curve of a given price elasticity in the relevant range of prices, how much a tax increases equilibrium  price relative to how much it decreases equilibrium quantity is determined by the price elasticity of demand. 

The following figure illustrates these points. If a city implements a tax of $0.75 per 2-liter bottle of soda, the supply curve shifts up from S1 to S2. If demand is price elastic, the equilibrium price increases from $1.75 to $2.00, while the equilibrium quantity falls from 90,000 bottles per day to 70,000. If demand is price inelastic, the equilibrium price rises by more, but the equilibrium quantity falls by less. Therefore, a more price elastic demand curve is good news for objective (1) above—soda consumption falls by more—but bad news for the amount of tax revenue the government collects. When the demand for soda is price inelastic, the government collects tax revenue of $0.75 per bottle multiplied by 80,000 bottles, or $60,000 per day. When the demand for soda is price elastic, the government collects tax revenue of $0.75 per bottle multiplied by 70,000 bottles, or only $52,500 per day.

One further point: We would expect the amount of revenue the government earns from the tax to decline over time, holding constant other variables that might affect the market for the taxed good, . This conclusion follows from the fact that demand typically becomes more price elastic over time. In other words, when a tax is first imposed (or an existing tax is increased), consumers are likely to reduce purchases of the taxed good less in the short run than in the long run. This result can a problem for governments that make a commitment to use the tax revenues for a particular purpose.

A recent article in the Los Angeles Times highlighted this last point. In 1999, California voters passed Proposition 10, which increased the tax on cigarettes by $0.50 per pack, with similar tax increases on other tobacco products. The tax revenues were dedicated to funding “First 5” state government agencies, which are focused on providing services to children 5 years old and younger.  The article notes, as the above analysis would lead us to expect, that the additional revenue the state received from the tax increase was largest in the first year and has gradually declined since as the quantity of cigarettes and other tobacco products sold has fallen. (Note that over such a long period of time, other factors in addition to the effects of the tax have contributed to the decline in smoking in California.) As a result, the state and county governments have had to scramble to find additional sources of funds for the First 5 agencies. The article quotes Deborah Daro, a researcher at the University of Chicago, as noting: “It seemed like a brilliant solution—tax the sinners who are smoking to help newborns and their parents …. But then people stopped smoking, which from a public health perspective is great, but from a funding perspective for First 5—they don’t have another funding stream.”

Solved Problem: The German Tobacco Tax and Price Elasticity

(Photo from Reuters via the Wall Street Journal)

Supports: Microeconomics, Chapter 6, Section 6.3, Economics, Chapter 6, Section 6.3, and Essentials of Economics, Chapter 7, Section 7.7.

In August 2023, an article in the Wall Street Journal discussed the effort of the German government to reduce tobacco use. As part of the effort, the government increased the tax on tobacco products, including cigars and cigarettes. The tax increase took effect on January 1, 2022. According to German government data, during 2022 the quantity of cigars and cigarettes sold declined by 8.3 percent. At the same time, the tax revenue the government collected from the tobacco tax declined from €14.7 billion to €14.2 billion.

  1. From this information, can you determine whether the tobacco tax raised the price of cigars and cigarettes by more or less than 8.3 percent? Can you determine whether the demand for cigars and cigarettes in Germany is price elastic or price inelastic? Briefly explain.
  2. According to the Wall Street Journal article, in addition to increasing the tax on tobacco products, the German government took other steps, including banning outdoor advertising of tobacco products, to discourage smoking. Does this additional information affect your answer to parts a.? Briefly explain. 

Solving the Problem

Step 1:  Review the chapter material. This problem is about the effect of price changes on revenue, so you may want to review Microeconomics, Chapter 6, Section 6.3, “The Relationship between Price Elasticity of Demand and Total Revenue,” or the corresponding sections in Economics, Chapter 6 or Essentials of Economics, Chapter 7.

Step 2: Answer part a. by explaining whether you can tell if the tobacco tax raised the price of cigars and cigarettes by more than 8.3 percent and whether the demand for cigars and cigarettes in Germany is price elastic or price inelastic. We have two pieces of information: (1) In 2022, the quantity of cigars and cigarettes sold in Germany fell by 8.3 percent, and (2) the revenue the German government collected from the tobacco tax fell. We know that if a company increases the price of its product and the total revenue it earns falls, then the demand for the product must be price elastic. We can apply that same reasoning to a government increasing a tax. If the tax increase leads to a fall in revenue we can conclude that the demand for the good being taxed (in this case cigars and cigarettes) is price elastic.  When the demand for a good is price elastic, the percentage change in the quantity demanded resulting from a price increase will be greater than the percentage change in the price.  Therefore, the percentage change in price resulting from the tax must be less than 8.3 percent. An important qualification to this conclusion is that it holds only if no variable, other than the increase in the tax, affected the demand for cigars and cigarettes during 2022.

Step 3: Answer part b. by explaining how the German government’s banning of outdoor advertising of tobacco products affects your answer to part a. Banning outdoor advertising of tobacco products may have reduced the demand for cigars and cigarettes. If the demand curve for cigars and cigarettes shifted to left, then some of the 8.3 percent decline in the quantity sold may have been the result of the shift in demand rather than the result of the increase in the tax. In other words, the German market for cigars and cigarettes in 2022 may have experienced both a decrease in demand—as the demand curve shifted to the left—and a decrease in the quantity demanded—as the tax increase raised the price of cigars and cigarettes. Given this new information, we can’t be sure that our conclusions in part a.—that the demand for cigars and cigarettes is price elastic and that the tax resulted in an increase in the price of less than 8.3 percent—are correct.  

Extra credit:  This discussion indicates that in practice economists have to use statistical methods when they estimate the price elasticity of demand for a good or service. The statistical methods make it possible to distinguish the effect of a movement along a demand curve as the price changes from a shift in the demand curve caused by changes in other economic variables.  

Sources:  Jimmy Vielkind, “Smoking Is a Dying Habit. Not in Germany,” Wall Street Journal, August 31, 2023; and Statistisches Bundesamt, “Taxation of Tobacco Products (Cigarettes, Cigars/Cigarillos, Fine-Cut Tobacco, Pipe Tobacco): Germany, Years, Tax Stamps,” September 10, 2023.

The Price Elasticity of Demand for Subway and Bus Rides

Supports: Microeconomics, Chapter 6, Section 6.3, Economics, Chapter 6, Section 6.3, and Essentials of Economics, Chapter 7, Section 7.7.

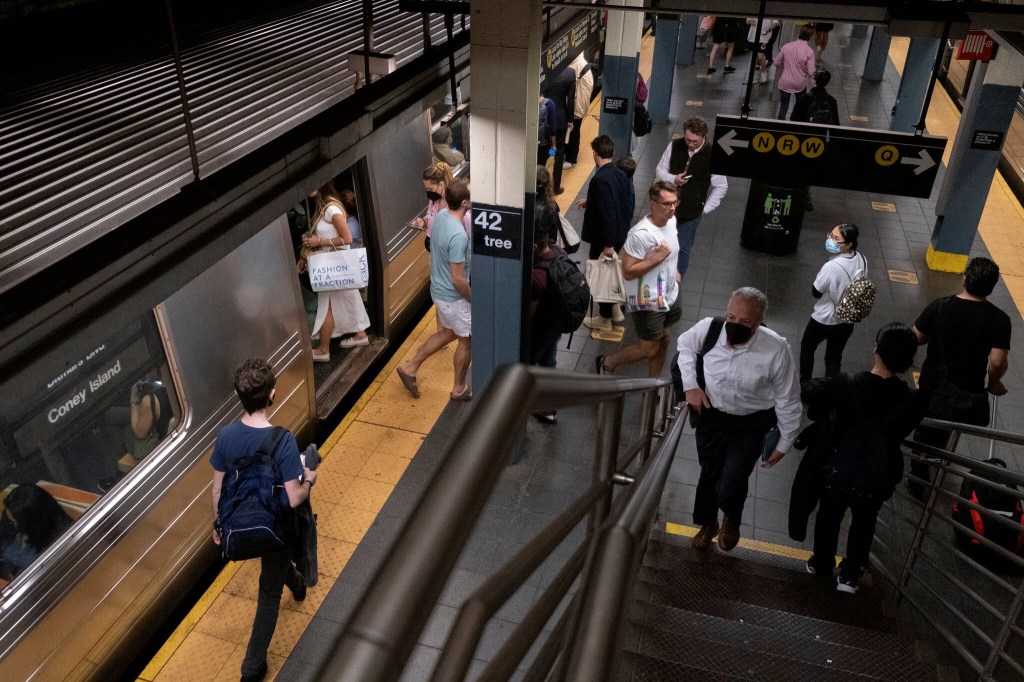
New York City subway. (Photo from the New York Times.)

An article on Crain’s New York Business noted that the Metropolitan Transit Authority (MTA), which runs New York City’s public transportation system was increasing the fare for a bus or subway ride from $2.75 to $2.90. The article noted that: “Revenue generated by the fare increase is expected to cover the [MTA’s] operating expenses and help keep up with inflation.”

a.  What is the MTA assuming about the price elasticity of demand for subway and bus rides in New York City? How plausible do you find this assumption? Briefly explain.

b. What is the largest percentage decline in subway and bus rides that the MTA can experience and still meet its revenue expectations?

Solving the Problem

Step 1:  Review the chapter material. This problem is about the relationship between a price increase on quantity demanded and revenue, so you may want to review the section “The Relationship between Price Elasticity of Demand and Total Revenue.”

Step 2:  Answer part (a) by explaining what the MTA is assuming about the price elasticity of demand for subway and bus rides, and comment on the plausibility of this assumption. If the MTA is expecting that an increase in the price of a subway and bus ride will increase the total revenue it earns from these rides, it must be assuming that the demand for subway and bus rides is price inelastic. If the demand were price elastic, the MTA would earn less revenue following the price increase.

 As we saw in Chapter 6, Section 6.2, the most important determinant of elasticity is the existence of substitutes. In a big city, the most important substitutes to taking public transportation are: (1) people walking, (2) people driving their own cars, or (3) people using a ride-hailing service, such as Uber and Lyft.  People who live close to their destination and who were indifferent between walking and taking public transportation before the price increase, are likely to switch to walking. Given the size of a city like New York, we might expect the number of these people to be relatively small. Driving your own car in a big city has the drawback that heavy traffic may mean it takes longer to drive than to take the bus or subway and paying for parking can be expensive. Using Uber or Lyft is also much more expensive than taking public transportation and may also be slow. It seems likely that current users of public transportation in New York City don’t see these alternatives as close substitutes for the bus or subway. So, it’s plausible for the MTA to assume that the demand for subway and bus rides is price inelastic. 

Step 3:  Answer part (b) by calculating the largest percentage decline in bus and subway rides that the MTA can experience and still meet its revenue expectations. The MTA is increasing the price of subway and bus rides from $2.75 to $2.90 per ride. That is a ($0.15/$2.75) × 100 = 5.5 percent increase. (Note that we would get a somewhat different result if we used the midpoint formula described in Section 6.1.) For the MTA’s revenue to increase as a result of the price increase, the percentage decrease in the quantity demanded of subway rides must be less than the percentage increase in the price. Therefore, the price increase can’t result in a decline of more than 5.5 percent. 

Source:  Caroline Spivak, “Subway and Bus Fares Will Increase Starting Sunday,” crainesnewyork.com, August 18, 2023.

The Price Elasticity of Demand for Disney+

Supports: Microeconomics, Chapter 6, Section 6.3, Economics, Chapter 6, Section 6.3, and Essentials of Economics, Chapter 7, Section 7.7

The Walt Disney Studios in Burbank, California (Photo from reuters.com)

On August 9, Disney released its earnings for the third quarter of its fiscal year. In a conference call with investors, Disney CEO Bob Iger announced that the price for a subscription to the Disney+ streaming service would increase from $10.99 per month to $13.99. An article in the Wall Street Journal quoted Iger as saying that the company had been more uncertain about pricing Disney+ than rival Netflix was about pricing its streaming service “because we’re new at all this.” According to the article, Iger had also said that “there was room to raise prices further [for Disney+] without reducing demand.” A column in the New York Times made the following observation: “The strategy now is to extract more money from subscribers via hefty price increases for Disney+, and hoping that those efforts don’t drive them away.”

a.  What is Disney assuming about the price elasticity of demand for Disney+? Briefly explain.

b. Assuming that Disney is only concerned with the total revenue it earns from Disney+, what is the largest percentage of subscribers Disney can afford to “drive away” as a result of its price increase?

c.  Why would Iger point out that Disney was new at selling streaming services when discussing the large price increase they were implementing?

d.  According to the Wall Street Journal’s account of Iger’s remarks, did he use the phrase “reducing demand” as an economist would? Briefly explain. 

Solving the Problem

Step 1:  Review the chapter material. This problem is about the effect of a price change on a firm’s revenue, so you may want to review the section “The Relationship between Price Elasticity of Demand and Total Revenue.”

Step 2:  Answer part (a) by explaining what Disney is assuming about the price elasticity of demand for Disney+.Disney must be assuming that the demand for Disney+ is price inelastic because they expect that the price increase will increase the revenue they earn from the service. If the demand were price elastic, they would earn less revenue following the price increase. 

Step 3:  Answer part (b) by calculating the largest percentage of subscribers that Disney can drive away with the price increase. Disney is increasing the price of Disney+ by $3 per month, from $10.99 to $13.99. That is a ($3/$10.99) × 100 = 27.3 percent increase. (Note that we would get a somewhat different result if we used the midpoint formula described in Section 6.1.)  For the price increase to increase Disney’s revenue from Disney+, the percentage decrease in the quantity demanded must be less than the percentage increase in the price. Therefore, the price increase can’t drive away more than 27.3 percent of Disney+ subscribers. 

Step 4:  Answer part (c) by explaining why Iger mentioned that Disney was new to streaming when discussing the Disney+ price increase. Firms sometimes attempt to statistically estimate their demand curves to determine the price elasticity. But particularly when a firm has only recently started selling a product, it often searches for the profit maximizing price through a process of trial and error. Iger contrasted Disney’s relative lack of experience in selling streaming services with Netflix’s much longer experience. In that context, it’s plausible that Disney had been substantially overestimating the price elasticity of demand for Disney+ (that is, Disney had thought that in absolute value, the price elasticity was larger than it actually was). So, the profit maximizing price might be significantly higher than the company had initially thought.

Step 5:  Answer part (d) by explaining whether Iger used the phrase “reducing demand” as an economist would. Following a price increase, Disney will experience a reduction in the quantity demanded of Disney+ subscriptions—a movement along the demand curve for subscriptions. For Disney to experience reduced demand for Disney+ subscriptions—a shift of the demand curve—a change in some variable other than price would have to cause consumers to reduce their willingness to buy subscriptions at every price.

Sources:  Robbie Whelan, “Disney to Significantly Raise Prices of Disney+, Hulu Streaming Services,” Wall Street Journal, August 9, 2023; and Andrew Ross Sorkin, Ravi Mattu, Sarah Kessler, Michael J. de la Merced, and Ephrat Livni, “Bob Iger Tweaks Disney’s Strategy on Streaming,” New York Times, August 10, 2023.

Think the Concept of Price Elasticity is Hard? Just Ask Bob Iger.

The Magic Kingdom in Walt Disney World in Florida. Photo by the AP via the Wall Street Journal.

Elasticity is near the top of the list of topics that students struggle with in the principles course. Some students struggle with the arithmetic of calculating elasticities, while others have difficulty understanding the basic concept. The importance and difficulty of elasticity led us to devote an entire chapter to it: Chapter 6 in both Microeconomics and Economics. (We include a briefer discussion in Chapter 7, Sections 7.5 and 7.6 in Essentials of Economics.)

When the Walt Disney Company released its 2023 second quarter earnings report on May 10, it turned out that Disney CEO Bob Iger is also a little shaky on the concept of price elasticity. During Iger’s previous time as Disney CEO he had started the Disney+ subscription streaming service. Like some other streaming services during the past year, Disney+ has struggled to earn a profit. Disney’s announcement in November 2022 that Disney+ had lost $1.47 billion during the previous quarter contributed to Bob Chapek, Iger’s predecessor as CEO, being fired by Disney’s board of directors.

For this quarter, Iger was able to announce that losses at Disney+ had been reduced to $659 million, although skepticism among investors about whether the service would turn a profit by next year as Iger indicated contributed to a sharp decline in Disney’s stock price. The smaller loss at Disney+ was largely the result of Disney having raised the price of the service in December 2022 from $7.99 per month to $10.99 per month. According to an article in the Wall Street Journal, Iger noted that the price increase had caused only a very small decline in subscribers. Iger was quoted as concluding: “That leads us to believe that we, in fact, have pricing elasticity” with respect to Disney+.

Taken literally, Iger has the concept of elasticity backwards. If “having pricing elasticity” means having price elastic demand, then Disney would have experienced a large loss of Disney+ subscribers after the price increase, not a small loss. To use the concept correctly, Iger should have said something like “we have price inelastic demand.” If we give Iger the benefit of the doubt and assume that he knows the definitions of price elastic and price inelastic, then we can interpret what he said as meaning “we have favorable price elasticity.” Favorable in this case would mean demand is price inelastic.

In any case, this episode is a good example of why many students–and CEOs!–can struggle with the concept of price elasticity.

Solved Problem: Evaluating the Disney World Pricing Strategy

Photo from the New York Times.

Supports: Microeconomics, Chapter 6, Section 6.3 and Chapter 10, Section 10.3, Economics Chapter 6, Section 6.3 and Chapter 10, Section 10.3, and Essentials of Economics, Chapter 7, Section 7.4 and Section 7.7. 

In August 2022, an article in the Wall Street Journal discussed the Disney Company increasing the prices it charges for admission to its Disneyland and Walt Disney World theme parks. As a result of the price increases, “For the quarter that ended July 2 [2022], the business unit that includes the theme parks … posted record revenue of $5.42 billion and record operating income of $1.65 billion.” The increase in revenue occurred even though “attendance at Disney’s U.S. parks fell by 17% compared with the previous year….”

The article also contains the following observations about Disney’s ticket price increases: 

  1. “Disney’s theme-park pricing is determined by ‘pure supply and demand,’ said a company spokeswoman.” 
  2. “[T]he changes driving the increases in revenue and profit have drawn the ire of what Disney calls ‘legacy fans,’ or longtime parks loyalists.”
  1. Briefly explain what must be true of the demand for tickets to Disney’s theme parks if its revenue from ticket sales increased even though 17 percent fewer tickets were sold. [For the sake of simplicity, ignore any other sources of revenue Disney earns from its theme parks apart from ticket sales.]
  2. In Chapter 10, Section 10.3 the textbook discusses social influences on decision making, in particular, the business implications of fairness. Briefly discuss whether the analysis in that section is relevant as Disney determines the prices for tickets to its theme parks. 

Solving the Problem

Step 1: Review the chapter material. This problem is about the effects of price increases on firms’ revenues and on whether firms should pay attention the possibility that consumers might be concerned about fairness when making their consumption decisions, so you may want to review Chapter 6, Section 6.3, “The Relationship between Price Elasticity of Demand and Total Revenue” and Chapter 10, Section 10.3, “Social Influences on Decision Making,” particularly the topic “Business Implications of Fairness.” 

Step 2: Answer part a. by explaining what must be true of the demand for tickets to Disney’s theme parks if revenue from ticket sales increased even though Disney sold fewer tickets. Assuming that the demand curve for tickets to Disney’s theme parks is unchanged, a decline in the quantity of tickets sold will result in a move up along the demand curve for tickets, raising the price of tickets.  Only if the demand curve for theme park tickets is price inelastic will the revenue Disney receives from ticket sales increase when the price of tickets increases. Revenue increases in this situation because with an inelastic demand curve, the percentage increase in price is greater than the percentage decrease in quantity demanded. 

Step 3: Answer part b. by explaining whether the textbook’s discussion of the business implications of fairness is relevant as Disney as determines ticket prices.  Section 10.3 may be relevant to Disney’s decisions because the section discusses that firms sometimes take consumer perceptions of fairness into account when deciding what prices to charge. Note that ordinarily economists assume that the utility consumers receive from a good or service depends only on the attributes of the good or service and is not affected by the price of the good or service. Of course, in making decisions on which goods and services to buy with their available income, consumers take price into account. But consumers take price into account by comparing the marginal utilities of products realtive to their prices, with the marginal utilities assumed not to be affected by the prices.

In other words, a consumer considering buying a ticket to Disney World will compare the marginal utility of visiting Disney World relative to the price of the ticket to the marginal utility of other goods and services relative to their prices. The consumer’s marginal utility from spending a day in Disney World will not be affected by whether he or she considers the price of the ticket to be unfairly high.

The textbook gives examples, though, of cases where a business may fail to charge the price that would maximize short-run profit because the business believes consumers would see the price as unfair, which might cause them to be unwilling to buy the product in the future. For instance, restaurants frequently don’t increase their prices during a particularly busy night, even though doing so would increase the profit they earn on that night. They are afraid that if they do so, some customers will consider the restaurants to have acted unfairly and will stop eating in the restaurants. Similarly, the National Football League doesn’t charge a price that would cause the quantity of Super Bowl tickets demanded to be equal to the fixed supply of seats available at the game because it believes that football fans would consider it unfair to do so.

The Wall Street Journal article quotes a Disney spokeswomen as saying that the company sets the price of tickets according to demand and supply. That statement seems to indicate that Disney is charging the price that will maximize the short-run profit the company earns from selling theme park tickets. But the article also indicates that many of Disney’s long-time ticket buyers are apparently upset at the higher prices Disney has been charging. If these buyers consider Disney’s prices to be unfair, they may in the future stop buying tickets. 

In other words, it’s possible that Disney might find itself in a situation in which it has increased its profit in the short run at the expense of its profit in the long run. The managers at Disney might consider sacrificing some profit in the long run to increase profit in the short run an acceptable trade-off, particularly because it’s difficult for the company to know whether in fact many of its customers will in the future stop buying admission tickets because they believe current ticket prices to be unfairly high.  

Sources: Robbie Whelan and Jacob Passy, “Disney’s New Pricing Magic: More Profit From Fewer Park Visitors,” Wall Street Journal, August 27, 2022.

Solved Problem: High Prices and High Revenue in the U.S. Car Industry

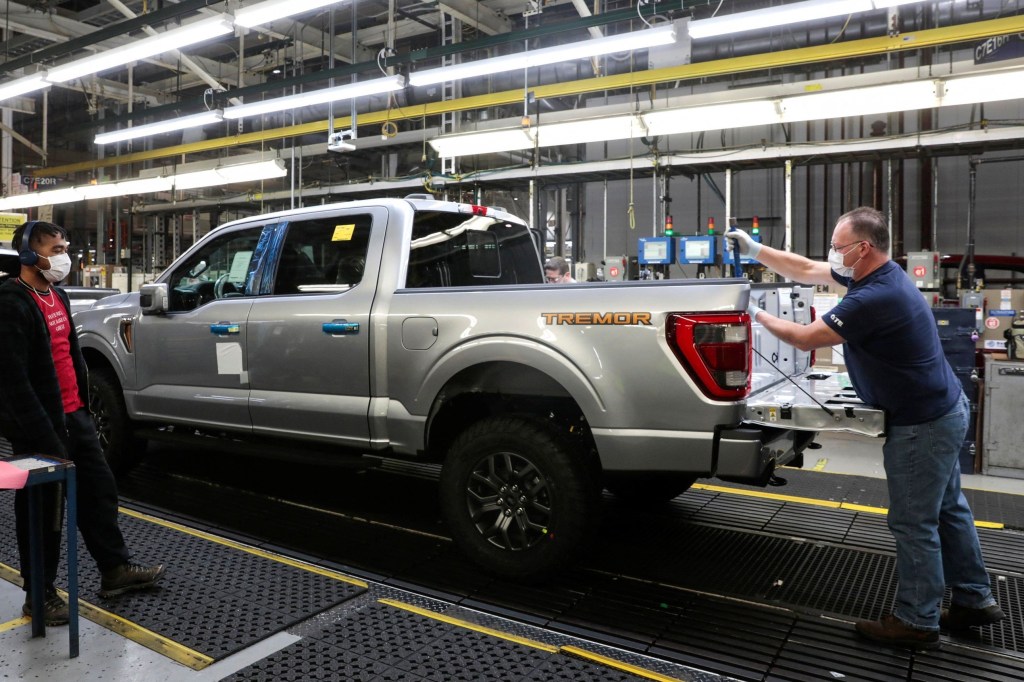
Production line for Ford F-series trucks. Photo from the Wall Street Journal.

Supports: Microeconomics, Chapter 6, Section 6.3 and Chapter 15, Section 15.6, Economics Chapter 6, Section 6.3 and Chapter 15, Section 15.6, and Essentials of Economics, Chapter 7, Section 7.7 and Chapter 10, Section 10.5.

In July 2022, an article in the Wall Street Journal noted that “The chip shortage and broader supply constraints have hampered vehicle production … Many major car companies on Friday reported U.S. sales declines of 15% or more for the first half of the year.” But the Wall Street Journal also reported that car makers were experiencing increases in revenues. For example, Ford Motor Company reported an increase in revenue even though it had sold fewer cars than during the same period in 2021.

  1. Briefly explain what must be true of the demand for new cars if car makers can sell 15 percent fewer cars while increasing their revenue.
  2. Eventually, the chip shortage and other supply problems facing car makers will end. At that point, would we expect that car makers will expand production to prepandemic levels or will they continue to produce fewer cars in order to maintain higher levels of profits? Briefly explain. 

Solving the Problem

Step 1: Review the chapter material. This problem is about the effects of price increases on firms’ revenues and on the ability of firms to restrict output in order increase profits, so you may want to review Chapter 6, Section 6.3, “The Relationship between Price Elasticity of Demand and Total Revenue” and Chapter 15, Section 15.6, “Government Policy toward Monopoly.” 

Step 2: Answer part a. by explaining what must be true of the demand for new cars if car makers are increasing their profits while selling fewer cars. Assuming that the demand curve for cars is unchanged, a decline in the quantity of cars sold will result in a move up along the demand curve for cars, raising the price of cars.  Only if the demand curve for new cars is price inelastic will the revenue car markers receive increase when the price increases. Revenue increases in this situation because with an inelastic demand curve, the percentage increase in price is greater than the percentage decrease in quantity demanded. 

Step 3: Answer part b. by explaining whether we should expect that once the car industry’s supply problems are resolved, car makers will continue to produce fewer cars.  Although as a group car makers would be better off if they could continue to reduce the supply of cars, they are unlikely to be able to do so. Any one car maker that decided to keep producing fewer cars would lose sales to other car makers who increased their production to prepandemic levels. Because this increased production would result in a movement down along the demand curve for new cars, the price would fall. So a car maker that reduced output would receive a lower price on its reduced output, causing its profit to decline. (Note that this situation is effectively a prisoner’s dilemma as discussed in Chapter 14, Section 14.2.)

The firms could attempt to keep output of new cars at a low level by explicitly agreeing to do so.  But colluding in this way would violate the antitrust laws, and executives at the firms would risk being fined or even imprisoned. The firms could attempt to implicitly collude by producing lower levels of output without explicitly agreeing to do so. (We discus implicit collusion in Chapter 14, Section 14.2.) But implicit collusion is unlikely to succeed because firms have an incentive to break an implicit agreement by increasing output. 

We can conclude that once the chip and other supply problems facing car makers are resolved, production of cars is likely to increase.

Sources: Mike Colias and Nora Eckert, “GM Says Unfinished Cars to Hurt Quarterly Results,” Wall Street Journal, July 1, 2022; and Nora Eckert, “Ford’s U.S. Sales Increase 32% in June, Outpacing Broader Industry,” Wall Street Journal, July 5, 2022.

Inflation, Supply Chain Disruptions, and the Peculiar Process of Purchasing a Car

Photo from the Wall Street Journal.

Inflation as measured by the percentage change in the consumer price index (CPI) from the same month in the previous year was 7.9 percent in February 2022, the highest rate since January 1982—near the end of the Great Inflation that began in the late 1960s. The following figure shows inflation in the new motor vehicle component of the CPI.  The 12.4 percent increase in new car prices was the largest since April 1975.

The increase in new car prices was being driven partly by increases in aggregate demand resulting from the highly expansionary monetary and fiscal policies enacted in response to the economic disruptions caused by the Covid-19 pandemic, and partly from shortages of semiconductors and some other car components, which reduced the supply of new cars.

As the following figure shows, inflation in used car prices was even greater. With the exception of June and July of 2021, the 41.2 percent increase in used car prices in February 2022 was the largest since the Bureau of Labor Statistics began publishing these data in 1954. 

Because used cars are a substitute of new cars, rising prices of new cars caused an increase in demand for used cars. In addition, the supply of used cars was reduced because car rental firms, such as Enterprise and Hertz, had purchased fewer new cars during the worst of the pandemic and so had fewer used cars to sell to used car dealers. Increased demand and reduced supply resulted in the sharp increase in the price of used cars.

Another factor increasing the prices consumers were paying for cars was a reduction in bargaining—or haggling—over car prices.  Traditionally, most goods and services are sold at a fixed price. For example, some buying a refrigerator usually pays the posted price charged by Best Buy, Lowes, or another retailer. But houses and cars have been an exception, with buyers often negotiating prices that are lower than the seller was asking.

In the case of automobiles, by federal law, the price of a new car has to be posted on the car’s window. The posted price is called the Manufacturer’s Suggested Retail Price (MSRP), often referred to as the sticker price.  Typically, the sticker price represents a ceiling on what a consumer is likely to pay, with many—but not all—buyers negotiating for a lower price. Some people dislike the idea of bargaining over the price of a car, particularly if they get drawn into long negotiations at a car dealership. These buyers are likely to pay the sticker price or something very close to it.

As a result, car dealers have an opportunity to practice price discrimination:  They charge buyers whose demand for cars is more price elastic lower prices and buyers whose demand is less price elastic higher prices. The car dealers are able to separate the two groups on the basis of the buyers willingness to haggle over the price of a car. (We discuss price discrimination in Microeconomics and Economics, Chapter 15, Section 15.5.)  Prior to the Covid-19 pandemic, the ability of car dealers to practice this form of price discrimination had been eroded by the availability of online car buying services, such as Consumer Reports’ “Build & Buy Service,” which allow buyers to compare competing price offers from local car dealers. There aren’t sufficient data to determine whether using an online buying service results in prices as low as those obtained by buyers willing to haggle over price face-to-face with salespeople in dealerships.

In any event, in 2022 most car buyers were faced with a different situation: Rather than serving as a ceiling on the price, the MSRP, had become a floor. That is, many buyers found that given the reduced supply of new cars, they had to pay more than the MSRP. As one buyer quoted in a Wall Street Journal article put it: “The rules have changed so dramatically…. [T]he dealer’s position is ‘This is kind of a take-it-or-leave-it proposition.’” According to the website Edmunds.com, in January 2021, only about 3 percent of cars were sold in the United States for prices above MSRP, but in January 2022, 82 percent were.

Car manufacturers are opposed to dealers charging prices higher than the MSRP, fearing that doing so will damage the car’s brand. But car manufacturers don’t own the dealerships that sell their cars. The dealerships are independently owned businesses, a situation that dates back to the beginning of the car industry in the early 1900s. Early automobile manufacturers, such as Henry Ford, couldn’t raise sufficient funds to buy and operate a nationwide network of car dealerships. The manufacturers often even had trouble financing the working capital—or the funds used to finance the daily operations of the firm—to buy components from suppliers, pay workers, and cover the other costs of manufacturing automobiles.

The manufacturers solved both problems by relying on a network of independent dealerships that would be given franchises to be the exclusive sellers of a manufacturer’s brand of cars in a given area. The local businesspeople who owned the dealerships raised funds locally, often from commercial banks. Manufacturers generally paid their suppliers 30 to 90 days after receiving shipments of components, while requiring their dealers to pay a deposit on the cars they ordered and to pay the balance due at the time the cars were delivered to the dealers. One historian of the automobile industry described the process:

The great demand for automobiles and the large profits available for [dealers], in the early days of the industry … enabled the producers to exact substantial advance deposits of cash for all orders and to require cash payment upon delivery of the vehicles ….  The suppliers of parts and materials, on the other hand, extended book-account credit of thirty to ninety days. Thus the automobile producer had a month or more in which to assemble and sell his vehicles before the bills from suppliers became due; and much of his labor costs could be paid from dealers’ deposits.

The franchise system had some drawbacks for car manufacturers, however. A car dealership benefits from the reputation of the manufacturer whose cars it sells, but it has an incentive to free ride on that reputation. That is, if a local dealer can take an action—such as selling cars above the MSRP—that raises its profit, it has an incentive to do so even if the action damages the reputation of Ford, General Motors, or whichever firm’s cars the dealer is selling.  Car manufacturers have long been aware of the problem of car dealers free riding on the manufacturer’s reputation. For instance, in the 1920s, Ford sent so-called road men to inspect Ford dealers to check that they had clean, well-lighted showrooms and competent repair shops in order to make sure the dealerships weren’t damaging Ford’s brand.

As we discuss in Microeconomics and Economics, Chapter 10, Section 10.3, consumers often believe it’s unfair of a firm to raise prices—such as a hardware store raising the prices of shovels after a snowstorm—when the increases aren’t the result of increases in the firm’s costs. Knowing that many consumers have this view, car manufacturers in 2022 wanted their dealers not to sell cars for prices above the MSRP. As an article in the Wall Street Journal put it: “Historically, car companies have said they disapprove of their dealers charging above MSRP, saying it can reflect poorly on the brand and alienate customers.”

But the car manufacturers ran into another consequence of the franchise system. Using a franchise system rather than selling cars through manufacturer owned dealerships means that there are thousands of independent car dealers in the United States. The number of dealers makes them an effective lobbying force with state governments. As a result, most states have passed state franchise laws that limit the ability of car manufacturers to control the actions of their dealers and sometimes prohibit car manufacturers from selling cars directly to consumers. Although Tesla has attained the right in some states to sell directly to consumers without using franchised dealers, Ford, General Motors, and other manufacturers still rely exclusively on dealers. The result is that car manufacturers can’t legally set the prices that their dealerships charge. 

Will the situation of most people paying the sticker price—or more—for cars persist after the current supply chain problems are resolved? AutoNation is the largest chain of car dealerships in the United States. Recently, Mike Manley, the firm’s CEO, argued that the substantial discounts from the sticker price that were common before the pandemic are a thing of the past. He argued that car manufacturers were likely to keep production of new cars more closely in balance with consumer demand, reducing the number of cars dealers keep in inventory on their lots: “We will not return to excessively high inventory levels that depress new-vehicle margins.” 

Only time will tell whether the situation facing car buyers in 2022 of having to pay prices above the MSRP will persist. 

Sources: Mike Colias  and Nora Eckert, “A New Brand of Sticker Shock Hits the Car Market,” Wall Street Journal, February 26, 2022; Nora Eckert and Mike Colias, “Ford and GM Warn Dealers to Stop Charging So Much for New Cars,” Wall Street Journal, February 9, 2022; Gabrielle Coppola, “Car Discounts Aren’t Coming Back After Pandemic, AutoNation Says,” bloomberg.com, February 9, 2022; cr.org/buildandbuy; Lawrence H. Seltzer, A Financial History of the American Automobile Industry, Boston: Houghton-Mifflin, 1928; and Federal Reserve Bank of St. Louis.