


If your sister gives you a sweater that you don’t like, the subjective value you place on the sweater will probably be less than the price your sister paid for it. As we saw in Chapter 4, Sections 4.1 and 4.2, consumer surplus is the difference between the highest price a consumer is willing to pay for a good (which equals the consumer’s marginal benefit from the good) and the actual price the consumer pays. We expect that you will only buy things that have a marginal benefit to you greater than (or, at worst, equal to) the price you paid. Therefore, everything you buy provides you with positive (or, again at worst, zero) consumer surplus. But if the price is greater than the marginal benefit—as is the case with the sweater your sister gave you—consumer surplus is negative and there is a deadweight loss.
In the early 1990s, Joel Waldfogel, currently at the University of Minnesota, published an article in the American Economic Review in which he reported surveying his undergraduate students, asking them to: (1) list every gift they had received for Christmas, (2) estimate the retail price of each gift, and (3) state how much they would have been willing to pay for each gift. Waldfogel’s students estimated that their families and friends had paid $438 on average on the students’ gifts. The students themselves, however, would have been willing to pay only $313 for the goods they received as gifts—so, on average, each student’s gifts caused a deadweight loss of $313 – $438 = –$125. If the deadweight losses experienced by Waldfogel’s students were extrapolated to the whole population, the total deadweight loss of Christmas gift giving could be as much as $23 billion (adjusting the value in Waldfogel’s article to 2020 prices).
If the gifts had been cash, the people receiving the gifts would not have been constrained by the gift givers’ choices, and there would have been no deadweight loss. If your sister had given you cash instead of that sweater you didn’t like, you could have bought whatever you wanted and received positive consumer surplus.
Waldfogel’s article attracted much more attention than is received by the typical academic journal article, being covered in newspaper articles and on television. It also set off a lively debate among economists over whether his approach was valid. Waldfogel later published a short book, Scroogenomics, in which he argued that, in fact, his journal article had underestimated the deadweight loss of gift giving because it compared the value of the gift to the person receiving it to the value of receiving cash instead. He noted that a more accurate comparison would be not to cash but to the value of the good the person receiving the gift would have bought with the cash. Because that purchase would provide positive consumer surplus to the buyer, the buyer’s loss from receiving a gift rather than cash is significantly greater than he had originally calculated.
Waldfogel again surveyed his undergraduate students asking them to make this revised comparison and found (p. 35): “Dollars on gifts for you produce 18 percent less satisfaction, per dollar, than dollars you spend on yourself.” Waldfogel also noted that a gift giver has to spend time shopping for a gift, which—unless the giver enjoys spending time shopping—should be added to the cost of gift giving.
As a number of critics of Waldfogel’s analysis have noted, if giving gifts rather than cash makes the recipient worse off and the giver no better off (or worse off if we take into account the cost of the time spent shopping) why has the tradition of giving gifts on holidays and birthdays persisted? Waldfogel argues that for a large fraction of the U.S. population, giving gifts at Christmas is a strong social custom that people are reluctant to break. He believes there is also a social custom against close friends and relatives—parents, siblings, girlfriends, boyfriends, and spouses—giving cash. (Although he believes that it’s socially acceptable for relatives—such as grandparents, aunts, and uncles—who see the gift recipient infrequently to give cash or gift cards).
Some economists have questioned Waldfogel’s results because he surveyed only college students, who are not a representative sample of the population because they are on average younger and come from higher-income families. Because Waldfogel’s students were all enrolled in an economics course, their views may have been affected by what they learned in class. Sarah Solnick, of the University of Vermont, and David Hemenway, of the Harvard University School of Public Health, argue that because most economics students know the economic result that receiving cash as a gift is likely to be preferable to receiving a good, they may have felt social pressure to value their gifts at less than the price paid for them.
To see whether Waldfogel’s including only college students in his survey mattered for his results, Solnick and Hemenway surveyed graduate students and staff at the Harvard School of Public Health as well as people randomly approached at train stations and airports in Boston and Philadelphia. On average the people Solnick and Hemenway surveyed gave their Christmas gifts a value 114 percent higher than the price they estimated the gift giver had paid. In other words, contrary to Waldfogel’s result, gift giving generated a large positive consumer surplus or a welfare gain rather than a welfare loss. The authors speculate that the positive consumer surplus in gift giving may result because the recipient “respects the tastes of the giver, or the item is something the recipient never remembers to get.” Or, perhaps, “The individual wants the item but would feel bad purchasing it for herself. She is grateful to receive it as a gift.”
Solnick and Hemenway’s analysis has also been criticized. Bradley Ruffle and Orit Tykocinski of Ben Gurion University in Israel point out that the order in which questions are asked in a survey can influence the responses. Both Waldfogel and Solnick and Hemenway asked people being surveyed to first estimate what the giver had paid for the gift before asking the value the recipient assigned to the gift. Ruffle and Tykocinski also noted that Solnick and Hemenway changed one question being asked from “the amount of cash such that you are indifferent” between receiving the gift and receiving cash (which is how Waldfogel phrased the question) to the “amount of money that would make you equally happy.” Ruffle and Tykocinski believe this change in wording may also help account for why Solnick and Hemenway’s results differed from Waldfogel’s.
Ruffle and Tykocinski carried out a survey using undergraduate psychology and economics students, varying the wording and the order of the questions. Their results indicated that the wording of the questions mattered, although the order the questions had only a slight effect, and that the psychology students and the economics students did not have significant differences in how much they valued gifts, although psychology students tended to estimate that gift givers had paid a higher price for the gifts. The authors concluded: “Is gift-giving a source of deadweight loss? Our results indicate that it depends critically on how you ask the question and, to a lesser degree, on whom you ask.”
Solnick and Hemenway responded that Ruffle and Tykocinski’s analysis was flawed because, like Waldfogel, they surveyed only undergraduate students: “Ours remains the only study to use adults, living independently, as subjects.” They note that “Ruffle and Tykocinski’s subjects performed poorly in estimating costs,” which may indicate that they lack the experience in buying a large range of goods and so have trouble comparing the value they place on a gift to the cost the giver paid.
John List, of the University of Chicago, and Jason Shogren, of the University of Wyoming, raised the issue of whether the hypothetical nature of the values the gift recipients placed on their gifts mattered. That is, whatever subjective value the recipient gave to a gift, he or she would not actually have the opportunity to sell the gift at a price equal to that value. To test the possibility the recipient’s valuation of a gift would change if the recipient had the opportunity to sell the gift, List and Shogren asked a group of undergraduates to estimate the costs of the gifts they had received for Christmas and to indicate the value they placed on the gifts (just as Waldfogel and the other economists discussed earlier had done). But List and Shogren then added another step by carrying out a so-called random nth price auction of the gifts: “For example, suppose G = 500 gifts overall and #6 was chosen as the random nth price, then only the five lowest-valuation gifts overall would be purchased at the sixth lowest offer.” This somewhat complicated auction design was intended to make it more likely that the students being surveyed would reveal the true value they placed on the gifts.
The results were similar to those found by Solnick and Hemenway in that the recipients put a higher value on the gifts than their estimates of the price the givers paid—so there was positive consumer surplus from gift giving. Their estimate of the welfare gain was significantly smaller than Solnick and Hemenway’s estimate—21 percent to 35 percent versus 114 percent.
Solnick and Hemenway were not entirely convinced by List and Shogren’s findings. They note that because the auction design made it unlikely that the students would actually have to sell their most expensive gifts, the students may have placed a subjective value on these gifts that was too low. In addition, they note that List and Shogren, like Waldfogel, included only college students in their survey.
Joel Waldfogel also replied to List and Shogren, making several of the points he was later to elaborate on in his Scroogenomics book, as discussed above: Basic economic analysis assumes that consumers choose the goods and services they buy to maximize their utility (see Chapter 10 in our textbook), therefore: “If givers, through their choice of gifts, can achieve higher recipient utility than can the recipients themselves, then a fundamental economic assumption is called into question.” List and Shogren compare the value students place on their gifts to the value of receiving cash rather than to the consumer surplus the students would receive from the goods and services they could buy with the cash. Finally, Waldfogel notes that List and Shogren’s results may be affected by what behavioral economists call the endowment effect: The tendency of people to be unwilling to sell a good they already own even if they are offered a price that is greater than the price they would be willing to pay to buy the good if they didn’t already own it. (See the discussion in Chapter 10, Section 10.4 of our textbook.) Because people will require a higher price to sell a good they already own than the price they would pay to buy it, “deadweight loss estimates based on selling prices are much smaller than deadweight loss estimates based on buying prices.”
Even though economists have carried on the debate over the deadweight loss of gift giving in technical terms involving how consumer surplus is best measured, how surveys should be designed, and how best to solicit accurate answers from survey takers, journalists have been intrigued enough by the debate to write it about for general audiences. Josh Barro, who writes for New York magazine and is the son of Harvard economist Robert Barro, wrote a column for the New York Times, “An Economist Goes Christmas Shopping,” in which he observes that the debate among economists over gift giving “makes ordinary people think economists are kind of crazy.” He writes that his father had given him a box of chocolates for Christmas and notes that because he’s on a diet, the gift was “an example of what Mr. Waldfogel warned us about: gift mismatch leading to deadweight loss.” But that he actually ate half the box of chocolates indicated that his father had “identified an item I would not have bought for myself but apparently wanted.” But “now feel I should not have eaten the chocolates, or at least not so many of them in two days.” He concludes that, “The real drag on the economy then isn’t gifts; it’s bad gifts.”
A recent article by Andrew Silver on the Wired website in the United Kingdom notes that a study by academics in India found “an average deadweight loss of about 15 per cent for non-monetary gifts” given during the Hindu festival Diwali. Silver notes that the deadweight loss to gift giving is difficult to avoid because the social custom of gift giving during holidays is very strong in many countries. He concludes, “Sometimes you’ve just got to buckle down and buy something you suspect the recipient won’t value as much as you paid for it.”
Finally, do most economists agree with Waldfogel that there is a significant deadweight loss to gift giving or do they agree with his critics who argue that holiday gift giving actually increases welfare? Although the question has never been asked in a large survey of economists, it was included in a survey of leading economists conducted by the Booth School of Business at the University of Chicago as part of its Initiative on Global Markets (IGM). The IGM regularly surveys a panel of economists on important (although in this case, maybe not so important) economic issues.
A few years ago, they asked their panel whether they agreed with this statement: “Giving specific presents as holiday gifts is inefficient, because recipients could satisfy their preferences much better with cash.” Of the 42 economists who responded to the question, 25 disagreed with the statement, 7 agreed, and 10 were uncertain. Of those who commented, several mentioned a point that Waldfogel had intentionally excluded from his analysis: the sentimental or emotional value that some people attach to giving and receiving presents. For instance, Janet Currie of Princeton noted that: “Gifts serve many functions such as signaling regard and demonstrating social ties with the recipient. Cash transfers don’t do this as well.” Or as Barry Eichengreen of the University of California, Berkeley put it: “Implications of a specific gift (signal it sends, behavioral impact) may give additional utility to either the giver or receiver.” Eric Maskin of Harvard may have stated his reason for disagreeing with the statement most succinctly: “Only an economist could think like this.”
Sources: Joel Waldfogel, “The Deadweight Loss of Christmas,” American Economic Review, Vol. 83, No. 4, December 1993, pp. 328–336; Joel Waldfogel, Scroogenomics: Why You Shouldn’t Buy Presents for the Holidays, Princeton, NJ: Princeton University Press, 2009; Sara J. Solnick and David Hemenway, “The Deadweight Loss of Christmas: Comment,” American Economic Review, Vol. 86, No. 5, December 1996, pp. 1299-1305; Bradley J. Ruffle and Orit Tykocinski, ““The Deadweight Loss of Christmas: Comment,” American Economic Review, Vol. 90, No. 1, March 2000, pp. 319-324; Sara J. Solnick and David Hemenway, “The Deadweight Loss of Christmas: Reply,” American Economic Review, Vol. 90, No. 1, March 2000, pp. 325-326; John A. List and Jason F. Shogren, “The Deadweight Loss of Christmas: Comment,” American Economic Review, Vol. 88, No. 5, December 1998, pp. 1350-1355; Sara J. Solnick and David Hemenway, “The Deadweight Loss of Christmas: Reply,” American Economic Review, Vol. 88, No. 5, December 1998, pp. 1356-1357; Joel Waldfogel, “The Deadweight Loss of Christmas: Reply,” American Economic Review, Vol. 88, No. 5, December 1998, pp. 1358-1360; Tim Hyde, “Did Holiday Gift Giving Just Create a Multi-Billion-Dollar Loss for the Economy?” aeaweb.org, December 28, 2015; Josh Barro, “An Economist Goes Christmas Shopping,” New York Times, December 19, 2014; Andrew Silver, “Economists Want You to Have the Most Boring Christmas Possible,” wired.co.uk, December 17, 2020; and Chicago Booth School of Business, The Initiative on Markets, “Bah, Humbug,” December 17, 2013.
In March 2020, as the effects of the Covid-19 pandemic on the U.S. economy became clear, Congress passed and President Donald Trump signed the Coronavirus Aid, Relief, and Economic Security (Cares) Act, which authorized more than $2 trillion in new spending. This fiscal policy action helped to cushion the effects on businesses and households of the job losses and reduced spending resulting directly from the pandemic and from the actions state and local governments took to contain the spread of the coronavirus, including restrictions on the operations of many businesses.
After a long debate over whether additional government aid would be required, in December 21, 2020, as hospitalizations and deaths from Covid-19 hit new highs in the United States, Congress agreed to a second fiscal policy action, totaling about $900 billion. On December 27, President Donald Trump signed the legislation. The components of the new spending are shown in the following pie chart, which is adapted from an article in the Wall Street Journal that can be found HERE. Note that the dollar values in the pie chart are in billions.
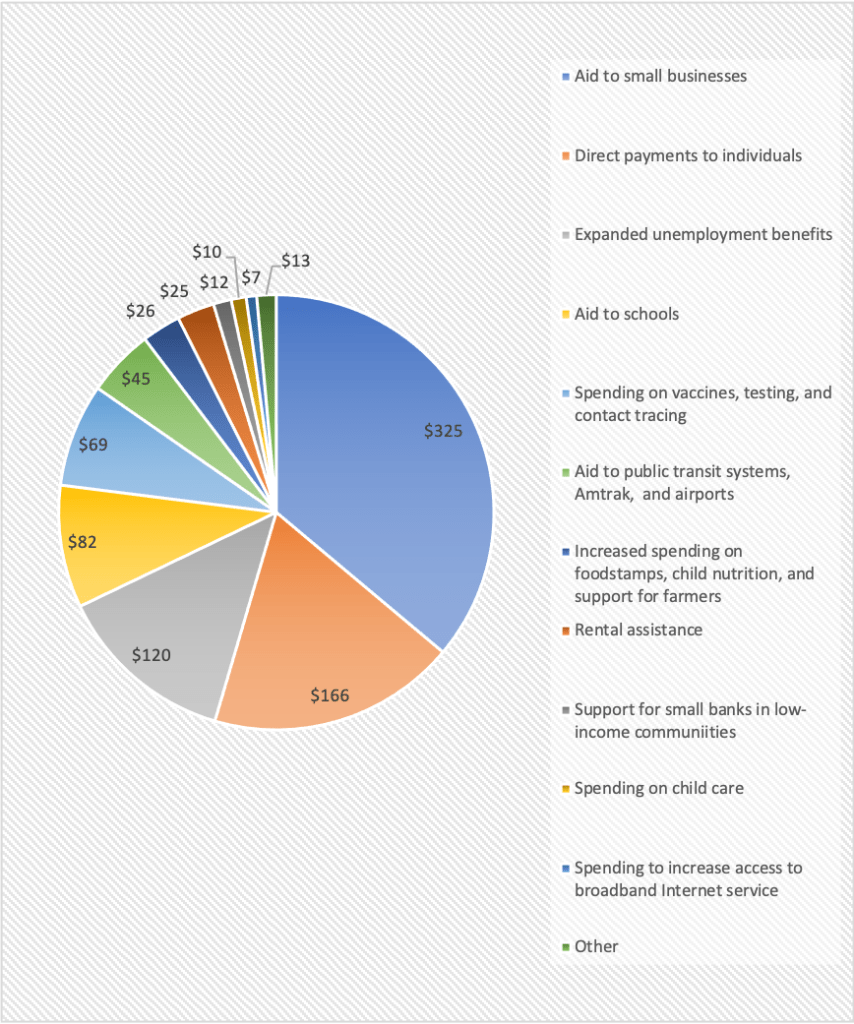
The largest component of the package is aid to small businesses, most of which takes the form of providing additional funds for the Paycheck Protection Plan. (We discuss the Paycheck Protection Plan in an earlier blog post that you can read HERE. An analysis by economists at the U.S. Department of the Treasury of the effectiveness of the original round of spending under the Paycheck Protection Plan can be found HERE.) The second largest component of the program involves direct payments of $600 per adult and $600 per child. The payments phase out for individuals with incomes over $75,000 and for couples with incomes over $150,000. The next largest component of the package is expanded unemployment benefits, followed by aid to schools, and increased spending on vaccines, testing, and contact tracing.
An article from the Associated Press describing the plan can be found HERE.
As we discuss in Chapter 16, the demand for labor depends on the marginal product of labor. In our basic model of a competitive labor market we assume that all workers have the same ability, skills, and training. Firms can hire as many workers as they would like at the market equilibrium wage. Because, by assumption, all workers have the same abilities, firms don’t have to worry about whether one person might be less able or willing to perform the assigned work than another person.
In reality, we know that most firms face more complicated hiring decisions. Even for a job, such as being a cashier in supermarket, that most people can be quickly trained to do, workers differ in how well they carry out their tasks and whether they can be relied on to regularly show up for work and to treat customers politely.
When hiring workers, firms face a problem of asymmetric information: Workers know more about whether they intend to work hard than firms know. Even for applicants who have a work history, a firm may have difficulty discovering how well or how poorly the applicant performed his or her duties in earlier jobs. In responding to inquiries from other firms about a job applicant, firms are rarely willing to do more than confirm that a person has worked at the firm because they are afraid that reporting anything negative about the person—even if true—might expose the firm to a law suit. In Section 16.5, we discuss the field of personnel economics, which includes the study of how firms design compensation policies that attempt to ensure that workers have an incentive to work hard.
When hiring someone entering the labor market, such as a new college graduate, firms have a particular problem in gauging the likely performance of a worker who may have no job history. In this case, there may not be a problem of asymmetric information because the worker may also be uncertain as to how well he or she will be able to perform the job, particularly if the worker has not previously held a full-time job in that field. When hiring new college graduates, firms may rely on an applicant’s college grades, the reputation of the applicant’s college, and the applicant’s scores on standardized test. Some firms have also developed their own tests to measure an applicant’s cognitive skills, knowledge relevant to the position applied for, and even psychological temperament. Some technology firms and investment banks ask applicants to complete demanding problems that may be unrelated to either technology or banking but can provide insight into whether the applicant has the cognitive ability and temperament to quickly complete complicated tasks.
Teams in the National Football League (NFL) face an interesting problem when hiring new players, particularly those playing the position of quarterback. College football players hoping to play professional football enter the NFL draft in which each of the 32 teams select players in eight rounds, with the selections being in reverse order of the teams’ records during the previous football season. There is often a substantial gap between an athlete’s ability to be successful playing college football and his ability to be successful in the NFL. As a result, many players who are stars in college are unable to succeed as professionals.
The position of quarterback is usually thought to be the most difficult to succeed at. Many highly-regarded college quarterbacks fail to do well in the NFL. Teams typically settle on one player as their starting quarterback who will play most of the time. But teams also have one or two backups. Sometimes the backups are older, former starters on other teams, but often they are players chosen in the draft of college players. It’s very difficult to judge how well a quarterback is likely to perform except by seeing him play in a game. Players who perform well in practice often don’t play well in games. As a result, a backup quarterback may be drafted and, if the starting quarterback on his team remains healthy and is effective, earn a nice salary from year to year without actually playing in many games. If a team’s starting quarterback is injured or is ineffective, the backup quarterback may play in several games during a season.
If the backup shows himself to be an effective player, the team may decide to retain him as the starter—with a substantial increase in salary. But given the difficulty of playing the position of quarterback, a more likely outcome is that the backup plays poorly and the team decides to draft another backup quarterback the following year.
The result is an odd situation: The more that a backup quarterback plays in games, often the less likely he is to keep his job. And the less that a backup quarterback plays, the more likely he is to keep his job. Or as one NFL head coach put it: “Backups who don’t play a lot tend to have long NFL careers, while those who are exposed [by actually] playing … have shorter careers.”
This outcome is an extreme example of the difficulty firms sometimes have in measuring how well new hires are likely to perform in their jobs.
Source for quote: Sportswriter David Lombardi on Twitter, quoting San Francisco 49ers’ head coach Kyle Shanahan, December 14, 2020.
The recession that resulted from the Covid-19 pandemic affected most sectors of the U.S. economy, but some sectors of the economy fared better than others. As a broad generalization, we can say that online retailers, such as Amazon; delivery firms, such as FedEx and DoorDash; many manufacturers, including GM, Tesla, and other automobile firms; and firms, such as Zoom, that facilitate online meetings and lessons, have done well. Again, generalizing broadly, firms that supply a service, particularly if doing so requires in-person contact, have done poorly. Examples are restaurants, movie theaters, hotels, hair salons, and gyms.
The following figure uses data from the Federal Reserve Economic Data (FRED) website (fred.stlouisfed.org) on employment in several business sectors—note that the sectors shown in the figure do not account for all employment in the U.S. economy. For ease of comparison, total employment in each sector in February 2020 has been set equal to 100.
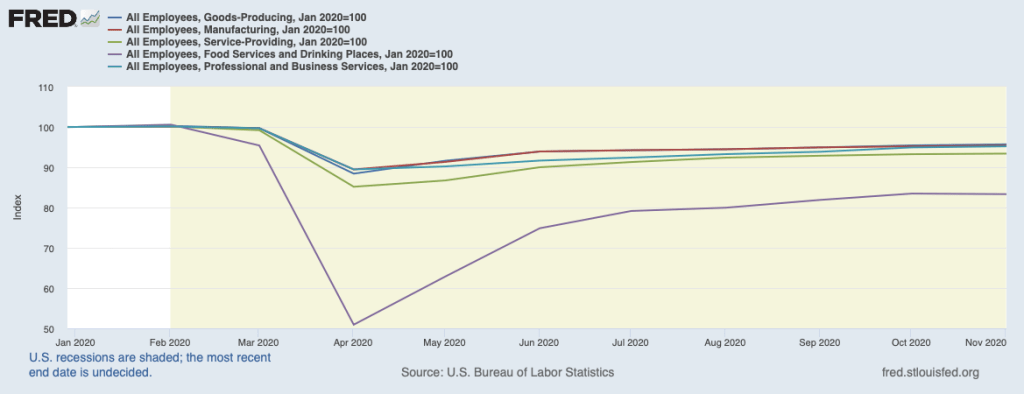
Employment in each sector dropped sharply between February and April as the pandemic began to spread throughout the United States, leading governors and mayors to order many businesses and schools closed. Even in areas where most businesses remained open, many people became reluctant to shop in stores, eat in restaurants, or exercise in gyms. From April to November, there were substantial employment gains in each sector, with employment in all goods-producing industries and employment in manufacturing (a subcategory of goods-producing industries) in November being just 5 percent less than in February. Employment in professional and business services (firms in this sector include legal, accounting, engineering, legal, consulting, and business software firms), rose to about the same level, but employment in all service industries was still 7 percent below its February level and employment in restaurants and bars was 17 percent below its February level.
Raj Chetty of Harvard University and colleagues have created the Opportunity Insights website that brings together data on a number of economic indicators that reflect employment, income, spending, and production in geographic areas down to the county or, for some cities, the ZIP code level. The Opportunity Insights website can be found HERE.
In a paper using these data, Chetty and colleagues find that during the pandemic “spending fell primarily because high-income households started spending much less.… Spending reductions were concentrated in services that require in-person physical interaction, such as hotels and restaurants …. These findings suggest that high-income households reduced spending primarily because of health concerns rather than a reduction in income or wealth, perhaps because they were able to self-isolate more easily than lower-income individuals (e.g., by substituting to remote work).”
As a result, “Small business revenues in the highest-income and highest-rent ZIP codes (e.g., the Upper East Side of Manhattan) fell by more than 65% between March and mid-April, compared with 30% in the least affluent ZIP codes. These reductions in revenue resulted in a much higher rate of small business closure in affluent areas within a given county than in less affluent areas.” As the revenues of small businesses declined, the businesses laid off workers and sometimes reduced the wages of workers they continued to employ. The employees of these small businesses, were typically lower- wage workers. The authors conclude from the data that: “Employment for high- wage workers also rebounded much more quickly: employment levels for workers in the top wage quartile [the top 20 percent of wages] were almost back to pre-COVID levels by the end of May, but remained 20% below baseline for low-wage workers even as of October 2020.”
The paper, which goes into much greater detail than the brief summary just given, can be found HERE.
Each year the U.S. Census Bureau conducts the American Community Survey (ACS) by surveying 3.5 million households on a wide range of questions including their income, their employment, their ethnicity, their marital status, how large their house or apartment is, and how many cars they own. The ACS is the most reliable source of data on these issues and is widely used by economists, business managers, and government policy makers. The data for 2019 and for the five-year period 2015-2019 were released on December 10. You can learn more about the survey and explore the data on the ACS website.
The ACS provides data on increases in income over time by different ethnic groups. This news article discusses the result that between 2005 and 2019, the incomes of Asian American grew the fastest, followed by the incomes of Hispanics, the incomes of non-Hispanic whites, and the incomes of African Americans.
Supports: Economics: Chapter 28 – Macroeconomics in an Open Economy (Section 28.2); Macroeconomics: Chapter 12, Section 12.2; and Essentials: Chapter 19 – Comparative Advantage, International Trade, and Exchange Rates (Section 19.6)
Solved Problem: The Macroeconomic Effects of a Stronger Euro
In December 2020, an article in the Wall Street Journal discussed the effects of changes in the value of the euro in exchange for the U.S. dollar. The article noted that: “A stronger euro makes exports from the region less competitive overseas” and that a stronger euro would also “damp inflation” in countries using the euro as their currency.
a. What does the article mean by a “stronger euro”? Why would a stronger euro make European exports less competitive?
b. What does the article mean by “damp inflation”? Why would a stronger euro damp inflation in countries using the euro?
Source: Caitlin Ostroff, “Euro Rally Weighs on Inflation, Sapping Appetite for Stocks,” Wall Street Journal, December 9, 2020.
Solving the Problem
Step 1: Review the chapter material. This problem is about the effect of changes in the exchange rate on a country’s (or region’s) imports and exports, so you may want to review Chapter 28, Section 28.2 “How Movements in Exchange Rates Affect Imports and Exports.”
Step 2: Answer part a. by explaining what a “stronger euro” means and why a stronger euro would make European exports less competitive. A stronger euro is one that exchanges for more dollars or, which amounts to the same thing, requires fewer euros to exchange for a dollar. (You may want to review the Apply the Concept “Is a Strong Currency Good for a Country?”) A stronger euro results in U.S. consumers having to pay more dollars to buy goods and services imported from Europe. In other words, the prices of European exports to the United States will rise making the exports less competitive with U.S.-produced goods or with other countries exports to the United States. If the euro is also becoming stronger against currencies such as the British pound, Japanese yen, and Chinese yuan, then European exports will also be less competitive in those countries.
Step 3: Answer part b. by explaining what “damp inflation” means and why a stronger euro would damp inflation in countries using the euro. To “damp inflation” is to reduce inflation. So the article is stating that a stronger euro will result in lower inflation in Europe. To understand why, remember that while a stronger euro will raise the dollar price of European exports to the United States, it will reduce the euro price of European imports from the United States (and from other countries if the euro is also becoming stronger against currencies such as the British pound, Japanese yen, and Chinese yuan). Inflation in a country is measured using the prices of goods and services that consumers purchase, whether those goods and services are produced domestically or are imported.

Christopher Waller
On Thursday, December 3, Christopher Waller, executive vice president and research director at the Federal Reserve Bank of St. Louis, was confirmed by the Senate as a member of the Federal Reserve’s Board of Governors. The Board of Governors has seven members and, under the Federal Reserve Act, is responsible for the monetary policy of the United States and for overseeing the operation of the Federal Reserve System.
Board members are appointed by the president and confirmed by the Senate to 14-year nonrenewable terms. The terms are staggered so that one expires every other January 31. Members frequently leave the Board before their terms expire to return to their previous occupations or to accept other positions in the government. The following table shows the current Board members, when their terms will expire, and which president appointed them. Note that one seat on the Board is vacant. President Trump nominated Judy Shelton to fill this seat but it appears unlikely that she will be confirmed by the Senate before the change in administration takes place on January 20.
| Name | Year Term Ends | Appointed to the Board by |
|---|---|---|
| Jerome Powell, Chair | As Chair: 2022 As Board member: 2028 | As Chair: President Trump As Board member: President Obama |
| Richard Clarida, Vice Chair | As Vice Chair and as Board member: 2022 | President Trump |
| Randal Quarles, Vice Chair for Supervision | As Vice Chair for Supervision: 2021; As Board member: 2032 | President Trump |
| Michelle Bowman | 2034 | President Trump |
| Lael Brainard | 2026 | President Obama |
| Christopher Waller | 2030 | President Trump |
| Vacant |
Information on the history and structure of the Board of Governors and on the backgrounds of current members can be found HERE on the Fed’s website. An announcement of Waller’s confirmation can be found HERE on the website of the St. Louis Fed. A news story discussing Waller’s confirmation and the likely outcome of Shelton’s nomination, as well as some of the politics involved with current Fed nominations can be found HERE (those with a subscription to the Wall Street Journal may also want to read the article HERE).

Janet Yellen
President-elect Joe Biden has nominated Janet Yellen to be treasury secretary. If confirmed by the Senate, Yellen would be the first woman to hold that post. She would also be the first person to have been both Federal Reserve Chair and treasury secretary. Yellen also served as President of the Federal Reserve Bank of San Francisco and as Chair of the Council of Economic Advisers during the Clinton administration. Prior to entering government service, Yellen was on the economics faculties of Harvard University and the University of California, Berkeley. At the time of her nomination she was a Distinguished Fellow in Residence at the Brookings Institution.
A news story on her nomination can be read HERE. Her biography on the Brookings Institution web site is HERE (includes a video conversation from a few years ago with former Fed Chair Ben Bernanke). A speech she gave in 2018 reflecting on the 2007-2009 financial crisis can be read HERE.

Walter Williams
Walter Williams, John M. Olin Distinguished Professor of Economics at George Mason University, died on December 2, shortly after teaching class. In addition to his academic publications (listed HERE), Williams was a spirited participant in public policy debates through his syndicated columns and television appearances. Some of his recent columns can be read through the links HERE. An appreciation by Thomas Sowell of Stanford’s Hoover Institution can be read HERE.
