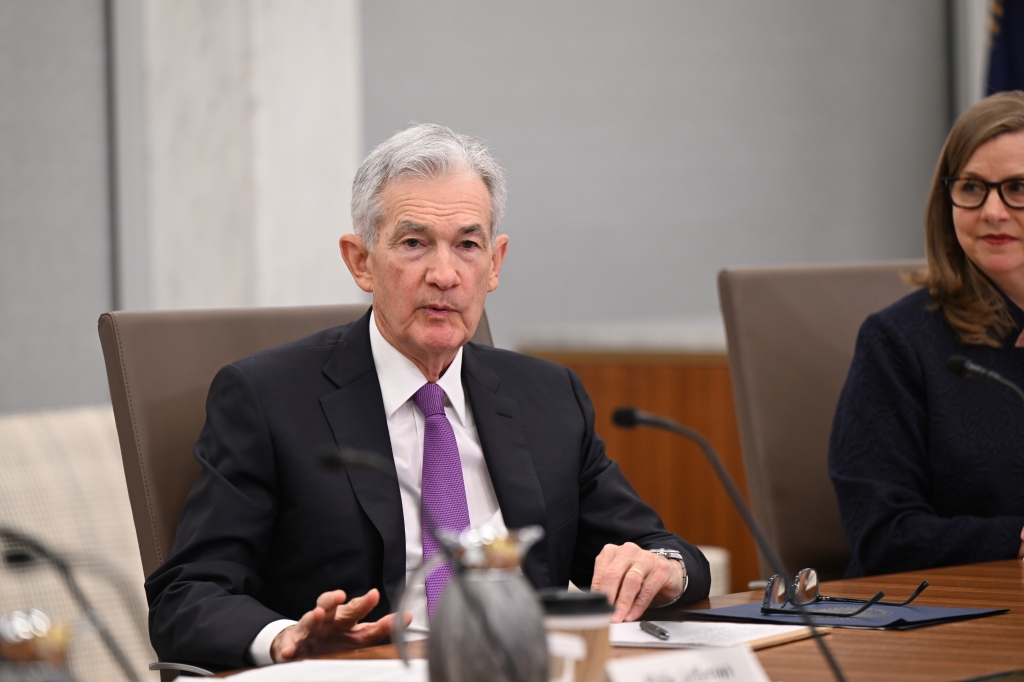
Federal Reserve Chair Jerome Powell (Photo from federalreserve.gov)
In a post yesterday, we noted that the quarterly data on the personal consumption expenditures (PCE) price index in the latest GDP report released by the Bureau of Economic Analysis (BEA) indicated that inflation was running higher than expected. Today (April 26), the BEA released its “Personal Income and Outlays” report for March, which includes monthly data on the PCE. The monthly data are consistent with the quarterly data in showing that PCE inflation remains higher than the Federal Reserve’s 2 percent annual inflation target. (A reminder that PCE inflation is particularly important because it’s the inflation measure the Fed uses to gauge whether it’s hitting its inflation target.)
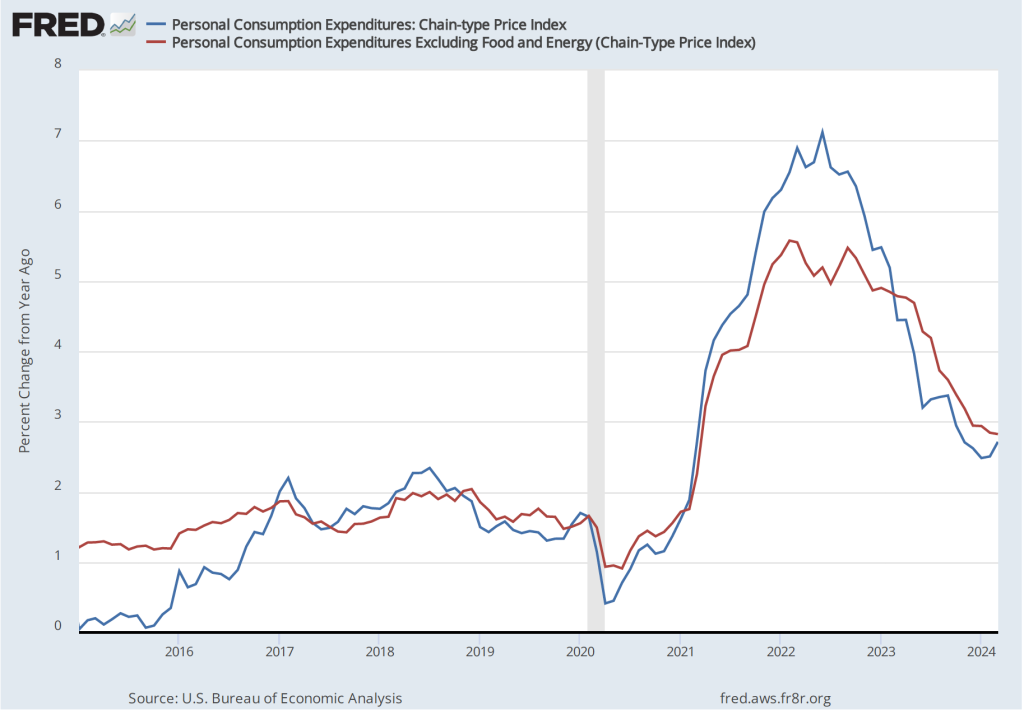
The following figure shows PCE inflation (blue line) and core PCE inflation (red line)—which excludes energy and food prices—with inflation measured as the percentage change in the PCE from the same month in the previous year. Many economists believe that core inflation gives a better gauge of the underlying inflation rate. Measured this way, PCE inflation increased from 2.5 percent in February to 2.7 percent in March. Core PCE inflation remained unchanged at 2.8 percent.
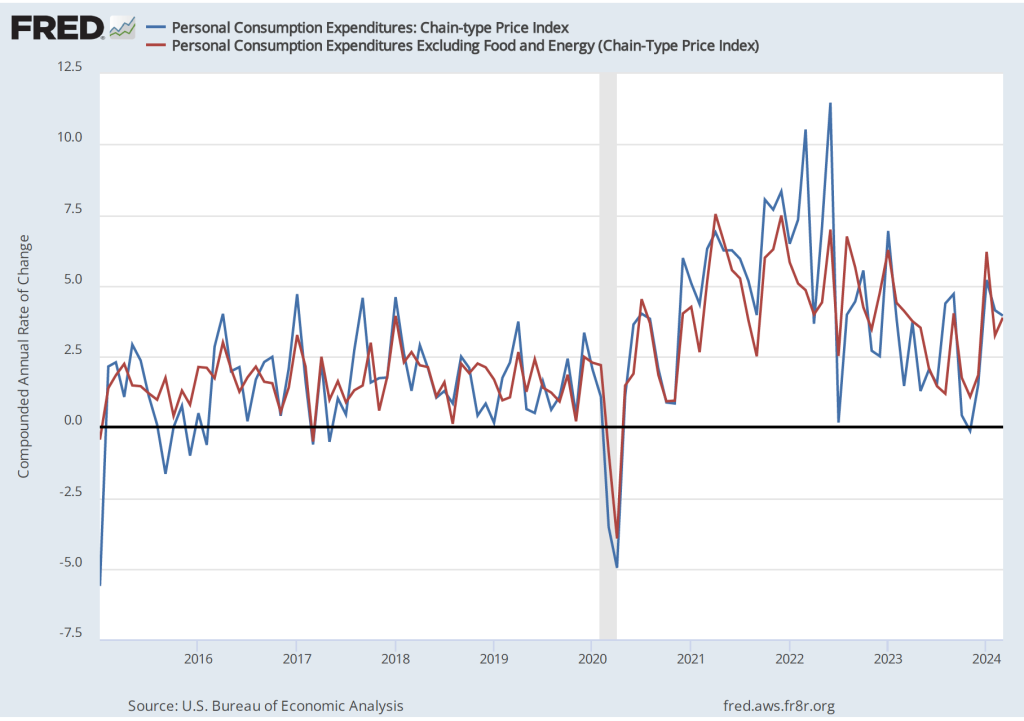
The following figure shows PCE inflation and core PCE inflation calculated by compounding the current month’s rate over an entire year. (The figure above shows what is sometimes called 12-month inflation, while this figure shows 1-month inflation.) Measured this way, PCE inflation declined from 4.1 percent in February to 3.9 percent in March. Core PCE inflation increased from 3.2 percent in February to 3.9 in March. So, March was another month in which both PCE inflation and core PCE inflation remained well above the Fed’s 2 percent inflation target.
The following figure shows other ways of gauging inflation by including the 12-month inflation rate in the PCE (the same as shown in the figure above—although note that PCE inflation is now the red line rather than the blue line), inflation as measured using only the prices of the services included in the PCE (the green line), and the rate of inflation (the blue line) excluding the prices of housing, food, and energy. Fed Chair Jerome Powell has said that he is particularly concerned by elevated rates of inflation in services. Some economists believe that the price of housing isn’t accurately measured in the PCE, which makes it interesting to see if excluding the price of housing makes much difference in calculating the inflation rate. All three measures of inflation increased from February to March, with inflation in services remaining well above overall inflation and inflation excluding the prices of housing, food, and energy being somewhat lower than overall inflation.

The following figure uses the same three inflation measures as the figure above, but shows the 1-month inflation rate rather than the 12-month inflation rate. Measured this way, inflation in services increased sharply from 3.2 percent in February to 5.0 percent in March. Inflation excluding the prices of housing, food, and energy doubled from 2.0 percent in February to 4.1 percent in March.

Overall, the data in this report indicate that the decline in inflation during the second half of 2023 hasn’t continued in the first three months of 2024. In fact, the inflation rate may be slightly increasing. As a result, it no longer seems clear that the Fed’s policy-making Federal Open Market Committee (FOMC) will cut its target for the federal funds rate this year. (We discuss the possibility that the FOMC will keep its target unchanged through the end of the year in this blog post.) At the press conference following the FOMC’s next meeting on April 30-May 1, Fed Chair Jerome Powell may explain what effect the most recent data have had on the FOMC’s planned actions during the remainder of the year.
