Shrinkflation in the Comic Book Industry

Action Comics No. 1, published in June 1938, is often consider the first superhero comic book. (Image from comics.org.)

In a political advertisement that ran before the broadcast of the Super Bowl, President Joe Biden discussed shrinkflation, which refers to firms reducing the quantity of a product in container while keeping the price unchanged. In this post from the summer of 2022, we discussed examples of shrinkflation—including Chobani reducing the quantity of yogurt in the package shown here from 5.3 ounces to 4.5 ounces—and noted that shrinkflation complicates the job of the Bureau of Labor Statistics when compiling the consumer price index. 

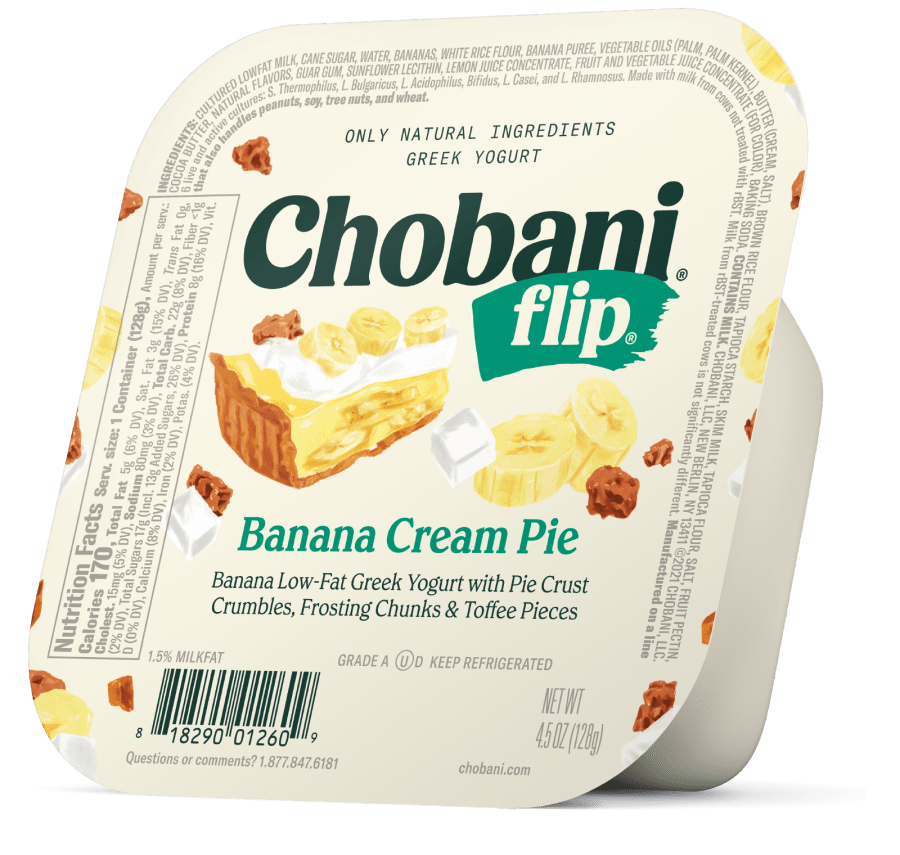
This yogurt remained the same price although the quantity of yogurt in the container shrank from 5.3 ounces to 4.5 ounces.

Shrinkflation isn’t new; firms have used the strategy for decades. Firms are particularly likely to use shrinkflation during periods of high inflation or during periods when the federal government implements price controls.  Firms also sometimes resort to shrinkflation when the the price of a product has remained constant for long enough that the firms fear that consumers will react strongly to the firms increasing the price.

Comic books provide an interesting historical example of shrinkflation. David Palmer, a professor of management at South Dakota State University published an article in 2010 in which he presented data on the price and number of pages in copies of Action Comics from 1938 to 2010. When DC Comics introduced Superman in the first issue of Action Comics in June 1938, it started the superhero genre of comic books. Action Comics No. 1 had a price of $0.10 and was 64 pages.

After the United States entered World War II in December 1941, the federal government imposed price controls to try to limit the inflation caused by the surge in spending to fight the war. Rising costs of producing comic books, combined with the difficulty in raising prices because of the controls, led comic book publishers to engage in shrinkflation. In 1943, the publishers reduced the number of pages in their comics from 64 to 56. In 1944, the publishers engaged in further shrinkflation, reducing the number of pages from 56 to 48.

In 1951, during the Korean War, the federal government again imposed price controls. Comic book publishers responded with further shrinkflation, keeping the price at $0.10, while reducing the number of pages from 48 to 40. In 1954, they shrank the number of pages to 36, which remains the most common number of pages in a comic book today. At that time, the publishers also slightly reduced the width of comics from 7 3/4 inches to 7 1/8 inches. (Today the typical comic book has a width of 6 7/8 inches.)

By the late 1950s, comic book publishers became convinced that they would be better off raising the prices of comic books rather than further shrinking the number of pages. But they were reluctant to raise their prices because they had been a constant $0.10 for more than 20 years, so children and their parents might react very negatively to a price increase, and because no firm wanted to be the first to raise its price for fear of losing sales to its competitors. They were caught in a prisoner’s dilemma: Comic book publishers would all have been better off if they had raised their prices but the antitrust laws kept them from colluding to raise prices and no individual firm had an incentive to raise prices alone. (We discuss collusion, prisoner’s dilemmas, and other aspects of oligopolistic firm behaviour in Chapter 14 of Microeconomics and Economics.)

The most successful publisher in the 1950s was Dell, which sold very popular comic books featuring Donald Duck, Uncle Scrooge, and other characters that particularly appealed to younger children. Because the prices of Dell’s comic books, like those of other publishers, been unchanged at $0.10 since the late 1930s, the firm didn’t have a clear idea of the price elasticity of demand for its comics. In 1957, the firm’s managers decided to use a market experiment to gather data on the price elasticity of demand. In most cities, Dell kept the price of its comics at $0.10, but in some cities it sold the identical comics at a price of $0.15.

The experiment lasted from March 1957 to August 1958 when the company discontinued it by reverting to selling all of its comics for $0.10. Although we lack the data necessary to compare the sales of Dell comics with a $0.15 price to the sales of Dell comics with a $0.10 price, the fact that no other publisher raised its prices during that period and that Dell abandoned the experiment indicates that the demand curve for Dell’s comics was price elastic—the percentage decline in the quantity sold was greater than the 50 percent increase in price—so Dell’s revenue from sales in the cities selling comics with a price of $0.15 likely declined. Dell’s strategy can be seen as a failed example of price leadership. (We discuss the relationship between the price elasticity of demand for a good and the total revenue a firm earns from selling the good in Chapter 6, Section 6.3 of Microeconomics and Economics. We discuss price leadership in Microeconomic and Economics, Chapter 14, Section 14.2.)

In March 1961, Dell increased the price of all of its comics from $0.10 to $0.15. At first, Dell’s competitors kept the prices of their comics at $0.10. As a result, in September 1961, Dell cut the price of its comics from $0.15 to $0.12. By early 1962, Dell’s competitors, including DC Comics, Marvel Comics—publishers of Spider-Man and the Fantastic Four—along with several smaller publishers, had increased the prices of their comics from $0.10 to $0.12. The managers at DC decided that raising the price of comics after having kept it constant for so long required an explantion. Accordingly, they printed the following letter in each of their comics.

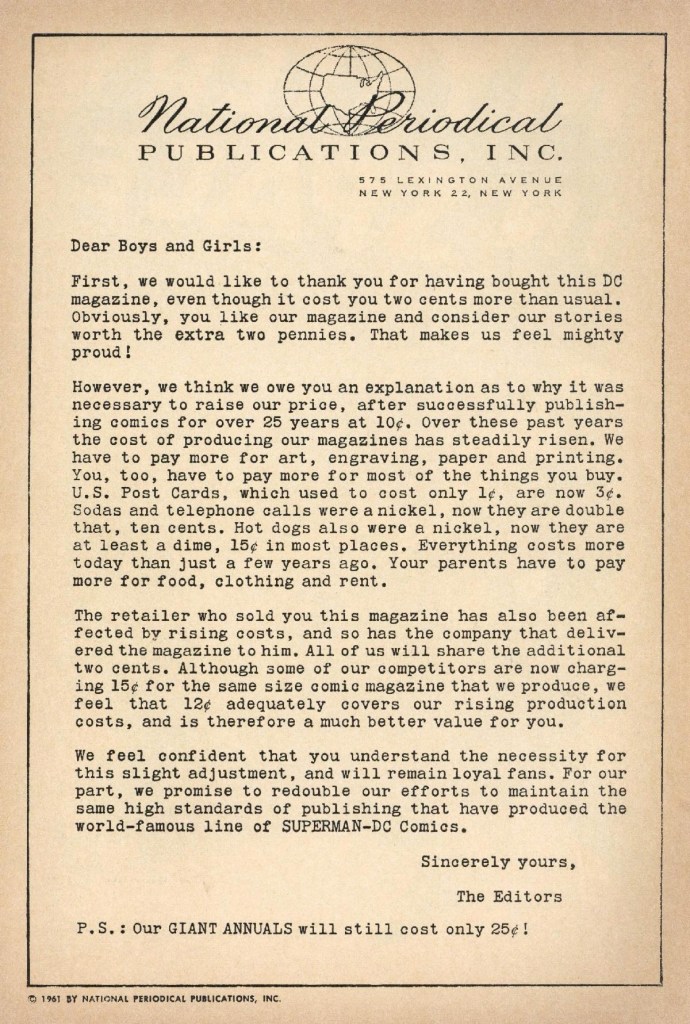
H/T to Buddy Saunders for the image.

Comic book publishers have raised their prices many times since the early 1960s, with most comics currently having a price of $4.99. During the recent period of high inflation, comic publishers did not use a strategy of shrinkflation perhaps because they believe that 36 pages is the minimum number that buyers will accept.

The first 25 years of the comic book industry represents an interesting historical example of shrinkflation.

Solved Problem: High Prices and High Revenue in the U.S. Car Industry

Production line for Ford F-series trucks. Photo from the Wall Street Journal.

Supports: Microeconomics, Chapter 6, Section 6.3 and Chapter 15, Section 15.6, Economics Chapter 6, Section 6.3 and Chapter 15, Section 15.6, and Essentials of Economics, Chapter 7, Section 7.7 and Chapter 10, Section 10.5.

In July 2022, an article in the Wall Street Journal noted that “The chip shortage and broader supply constraints have hampered vehicle production … Many major car companies on Friday reported U.S. sales declines of 15% or more for the first half of the year.” But the Wall Street Journal also reported that car makers were experiencing increases in revenues. For example, Ford Motor Company reported an increase in revenue even though it had sold fewer cars than during the same period in 2021.

  1. Briefly explain what must be true of the demand for new cars if car makers can sell 15 percent fewer cars while increasing their revenue.
  2. Eventually, the chip shortage and other supply problems facing car makers will end. At that point, would we expect that car makers will expand production to prepandemic levels or will they continue to produce fewer cars in order to maintain higher levels of profits? Briefly explain. 

Solving the Problem

Step 1: Review the chapter material. This problem is about the effects of price increases on firms’ revenues and on the ability of firms to restrict output in order increase profits, so you may want to review Chapter 6, Section 6.3, “The Relationship between Price Elasticity of Demand and Total Revenue” and Chapter 15, Section 15.6, “Government Policy toward Monopoly.” 

Step 2: Answer part a. by explaining what must be true of the demand for new cars if car makers are increasing their profits while selling fewer cars. Assuming that the demand curve for cars is unchanged, a decline in the quantity of cars sold will result in a move up along the demand curve for cars, raising the price of cars.  Only if the demand curve for new cars is price inelastic will the revenue car markers receive increase when the price increases. Revenue increases in this situation because with an inelastic demand curve, the percentage increase in price is greater than the percentage decrease in quantity demanded. 

Step 3: Answer part b. by explaining whether we should expect that once the car industry’s supply problems are resolved, car makers will continue to produce fewer cars.  Although as a group car makers would be better off if they could continue to reduce the supply of cars, they are unlikely to be able to do so. Any one car maker that decided to keep producing fewer cars would lose sales to other car makers who increased their production to prepandemic levels. Because this increased production would result in a movement down along the demand curve for new cars, the price would fall. So a car maker that reduced output would receive a lower price on its reduced output, causing its profit to decline. (Note that this situation is effectively a prisoner’s dilemma as discussed in Chapter 14, Section 14.2.)

The firms could attempt to keep output of new cars at a low level by explicitly agreeing to do so.  But colluding in this way would violate the antitrust laws, and executives at the firms would risk being fined or even imprisoned. The firms could attempt to implicitly collude by producing lower levels of output without explicitly agreeing to do so. (We discus implicit collusion in Chapter 14, Section 14.2.) But implicit collusion is unlikely to succeed because firms have an incentive to break an implicit agreement by increasing output. 

We can conclude that once the chip and other supply problems facing car makers are resolved, production of cars is likely to increase.

Sources: Mike Colias and Nora Eckert, “GM Says Unfinished Cars to Hurt Quarterly Results,” Wall Street Journal, July 1, 2022; and Nora Eckert, “Ford’s U.S. Sales Increase 32% in June, Outpacing Broader Industry,” Wall Street Journal, July 5, 2022.

Solved Problem: Pricing Video Games

Supports:  Econ (Chapter 12 – Oligopoly: Firms in Less Competitive Markets (Section 14.2); Essentials: Chapter 11 – Monopolistic Competition and Oligopoly (Section 11.6)

Solved Problem: Pricing Video Games

   In November 2020, an article on bloomberg.com discussed the pricing of video games for consoles like PlayStation and Xbox. The article noted that firms selling video games had kept prices constant at $60 per game since 2005. But this stable price was about to change: “This week, video game publishers will press ahead with an industry-wide effort to raise the standard price to $70.” An article in the Wall Street Journal indicated that the number of people playing video games has been increasing and had reached 244 million in the United States and 3.1 billion worldwide in 2020. Answer the following questions assuming that the video game industry is an oligopoly.

a. Is it likely that the demand for video games and the cost of producing them have remained constant for 15 years? If not, what can explain the fact that the prices of video games remained constant from 2005 to 2020?

b. Given your answer to part a., what can explain the fact that the prices of video games increased by $10 in 2020? Does the fact that this increase was an “industry-wide effort” matter? Briefly explain.

Sources: Olga Kharif and Takashi Mochizuki, “Video Game Prices Are Going Up for the First Time in 15 Years,” Bloomberg.com, November 9, 2020; and Sarah E. Needleman, “From ‘Fall Guys’ to ‘Among Us,’ How America Turned to Videogames Under Lockdown,” Wall Street Journal, October 31, 2020.

Solving the Problem

Step 1:   Review the chapter material. This problem is about pricing in an oligopolistic industry, so you may want to review Chapter 14, Section 14.2 “Game Theory and Oligopoly.”

Step 2:   Answer part a. by discussing whether it’s likely that the demand for video games and the cost of producing them have remained constant for 15 years and by providing an alternative explanation for the prices of video games remaining constant over this period. Over such a long period, it’s unlikely that the demand for video games and the cost of producing them have remained constant. For one thing, the Wall Street Journal article indicates that the number of people playing video games has been increasing, reaching 244 million in the United States in 2020 (out of a U.S. population of about 330 million). The cost of producing most consumer electronics has declined over the years. Although we are not given specific information that the cost of producing video games has followed this pattern, it seems probable that it did. So, it’s unlikely that the reason that the prices of video games have remained constant is that the demand for video games and the cost of producing them have remained unchanged.

The problem tells us to assume that the video game industry is an oligopoly. We know that price stability in an oligopolistic industry can sometimes be the result of the firms in the industry finding themselves in a prisoner’s dilemma. In this situation, the most profitable strategy for a firm is to match the low price charged by competitors even though the firm and its competitors could, both as a group and individually, earn larger profits by all charging a higher price. It seems more likely that the firms in the video game industry were stuck for years in a prisoner’s dilemma than that they have faced unchanged demand and production costs over such a long period.

Step 3:   Answer part b. by explaining why the prices of video games increased by $10 in 2020, taking into account that the increase was an “industry-wide effort.” As we note in the textbook, the prisoner’s dilemma is an example of a noncooperative equilibrium in which firms fail to cooperate by taking actions—in this case raising the prices of video games—that would make them all better off. Firms have an incentive to increase their profits by switching to a cooperative equilibrium of charging $10 more for video games by implicitly colluding to do so. Explicitly colluding by having firms’ executives meet and agree to raise prices is against the law in the United States and Europe. But implicit collusion in which firms signal to each other—perhaps by talking about their plans with journalists—that they intend to raise prices is a gray area of the law that governments may not take action against. The fact that the bloomberg.com article states that the price increase was an “industry-wide effort” is an indication that video game firms may have implicitly colluded to raise video game prices by $10.