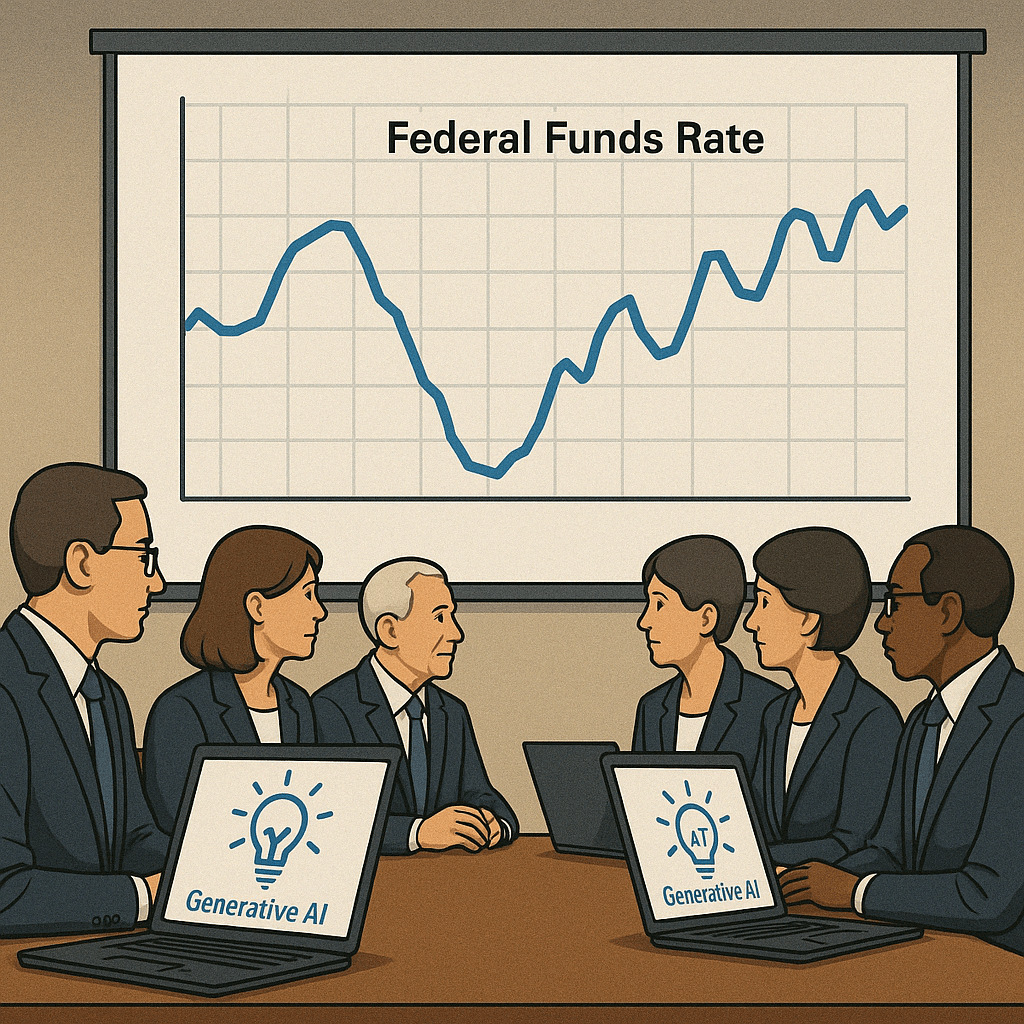
Image generated by ChatGTP-4o
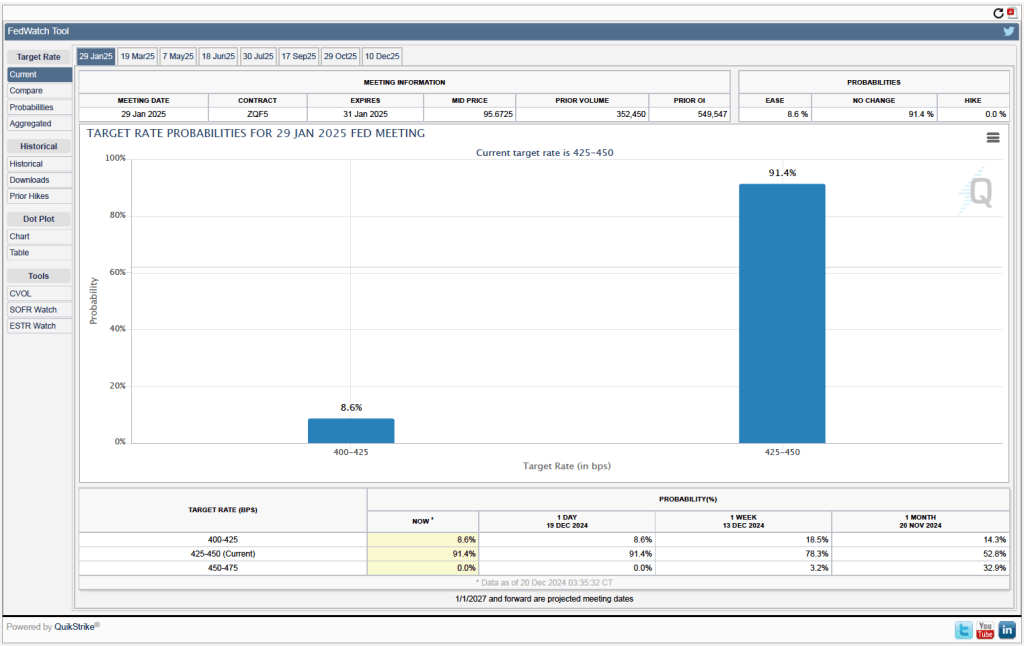
One of the key issues in monetary policy—dating back decades—is whether policy should be governed by a rule or whether the members of the Federal Open Market Committee (FOMC) should make “data-driven” decisions. Currently, the FOMC believes that the best approach is to let macroeconomic data drive decisions about the appropriate target for the federal funds rate rather than to allow a policy rule to determine the target.
In its most recent Monetary Policy Report to Congress, the Fed’s Board of Governors noted that policy rules “can provide useful benchmarks for the consideration of monetary policy. However, simple rules cannot capture all of the complex considerations that go into the formation of appropriate monetary policy, and many practical considerations make it undesirable for the FOMC to adhere strictly to the prescriptions of any specific rule.” We discuss the debate over monetary policy rules—sometimes described as the debate over “rules versus discretion” in conducting policy—in Macroeconomics, Chapter 15, Section 15.5 (Economics, Chapter 25, Section 25.5.)
Probably the best known advocate of the Fed relying on policy rules is John Taylor of Stanford University. The Taylor rule for monetary policy begins with an estimate of the value of the real federal funds rate, which is the federal funds rate—adjusted for inflation—that would be consistent with real GDP being equal to potential real GDP in the long run. With real GDP equal to potential real GDP, cyclical unemployment should be zero, and the Fed will have attained its policy goal of maximum employment, as the Fed defines it.
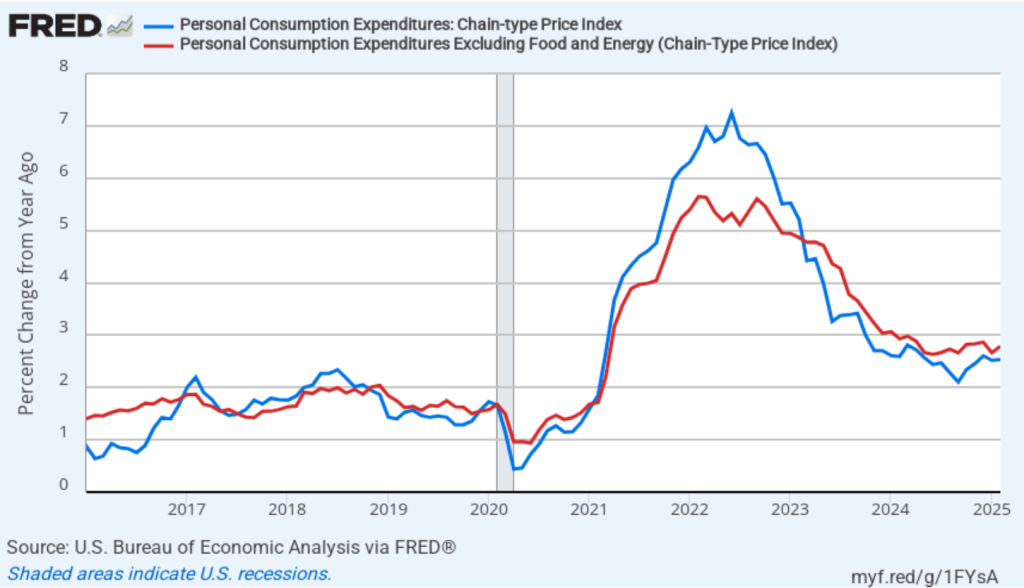
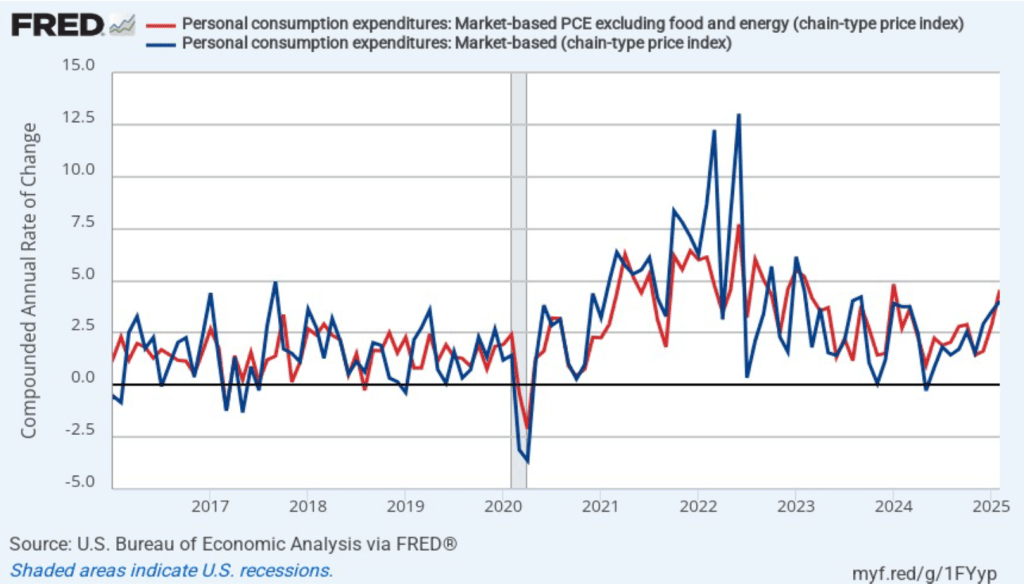
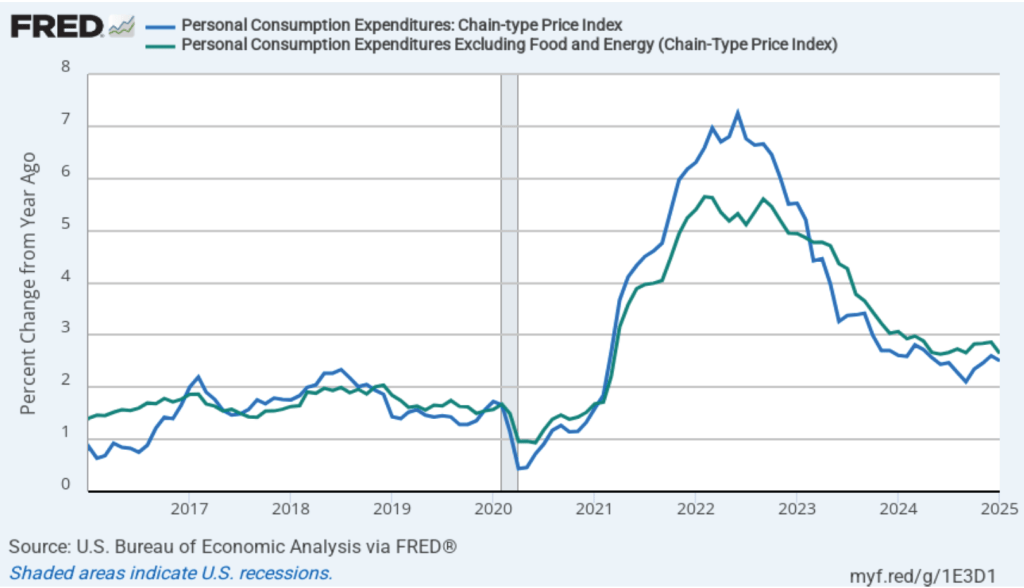
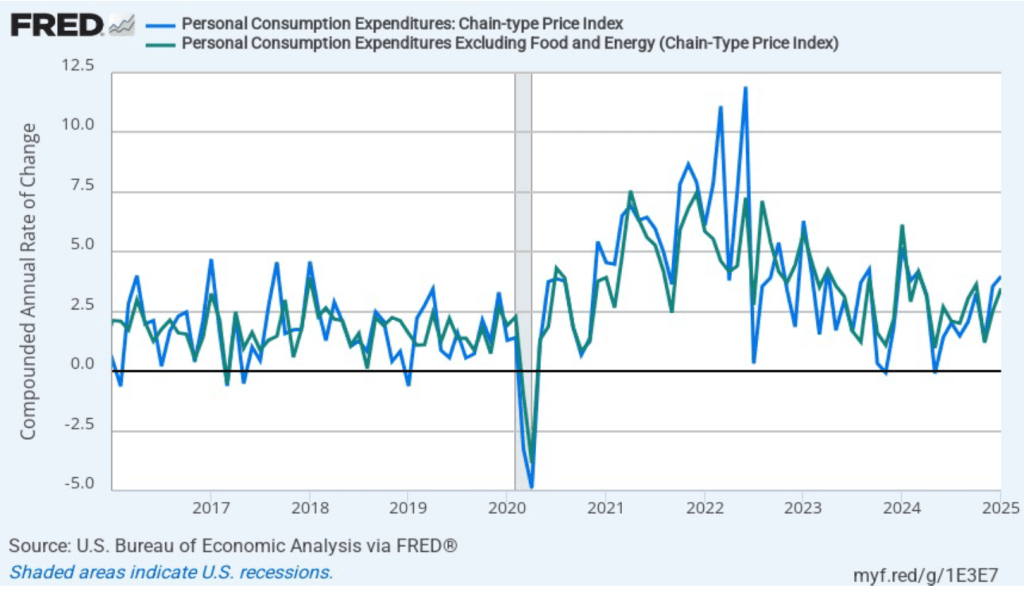
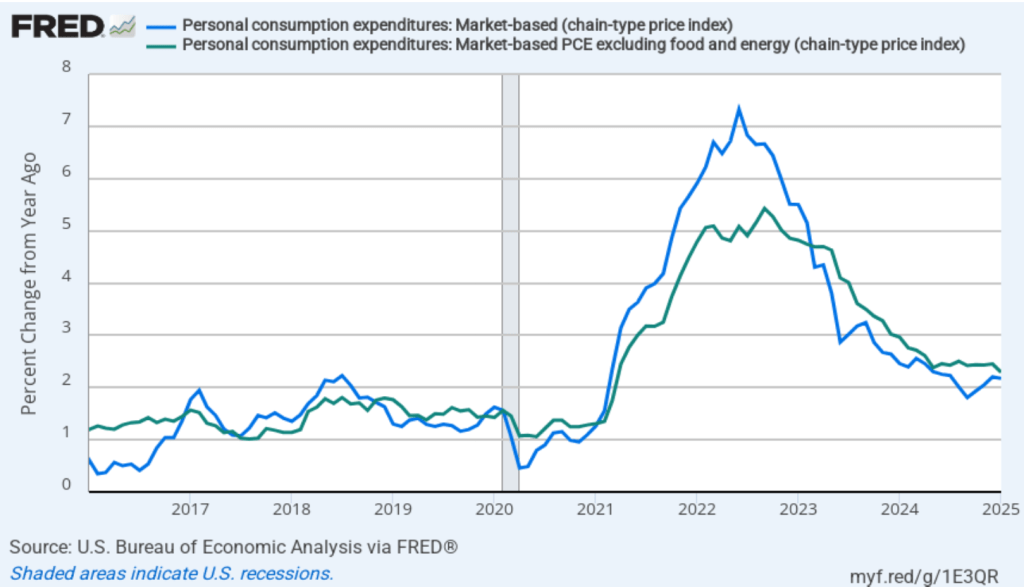
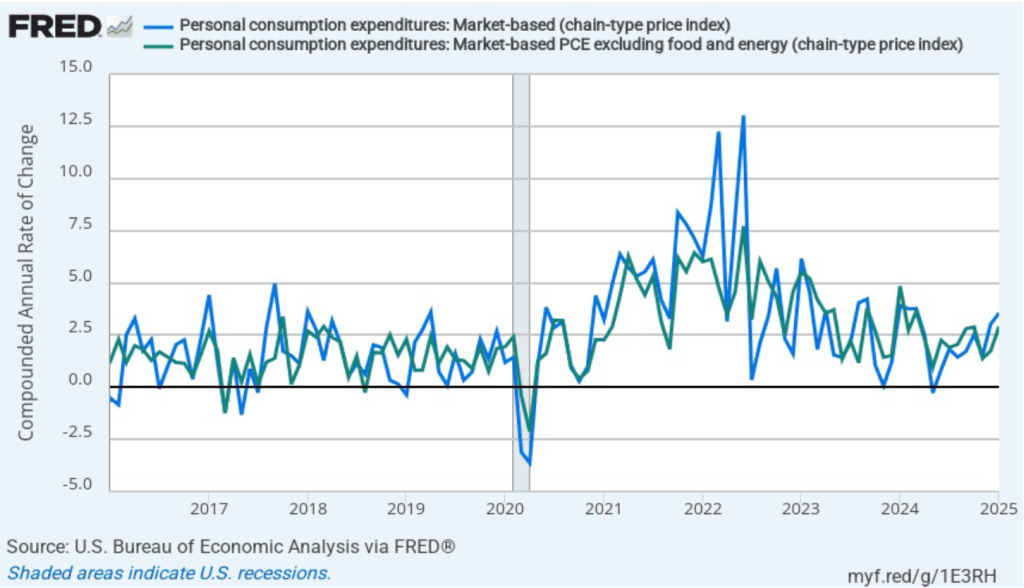
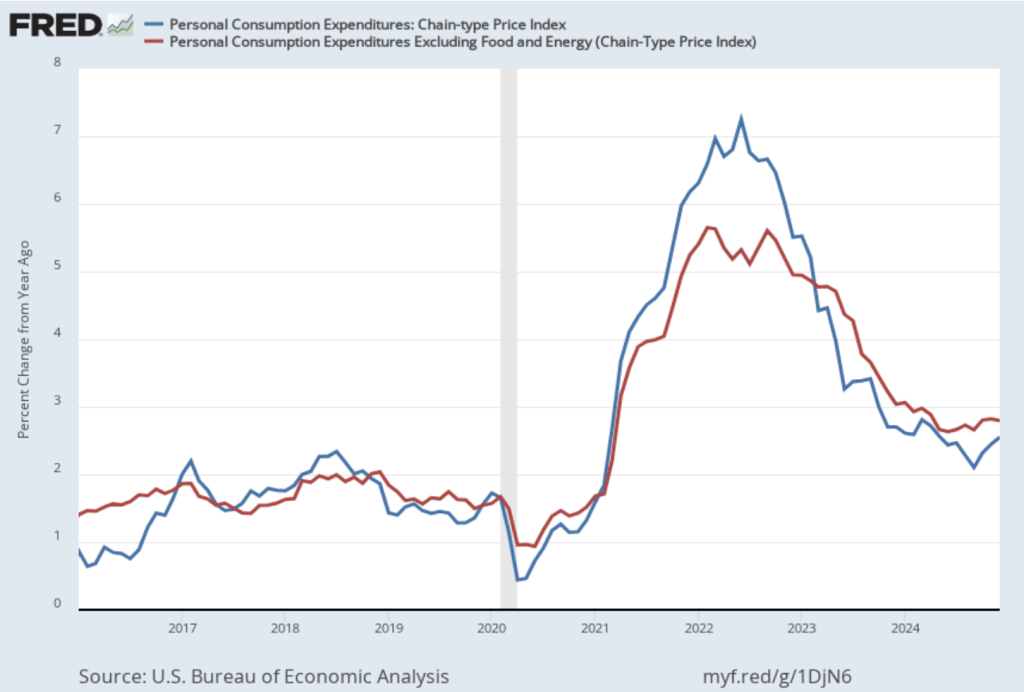
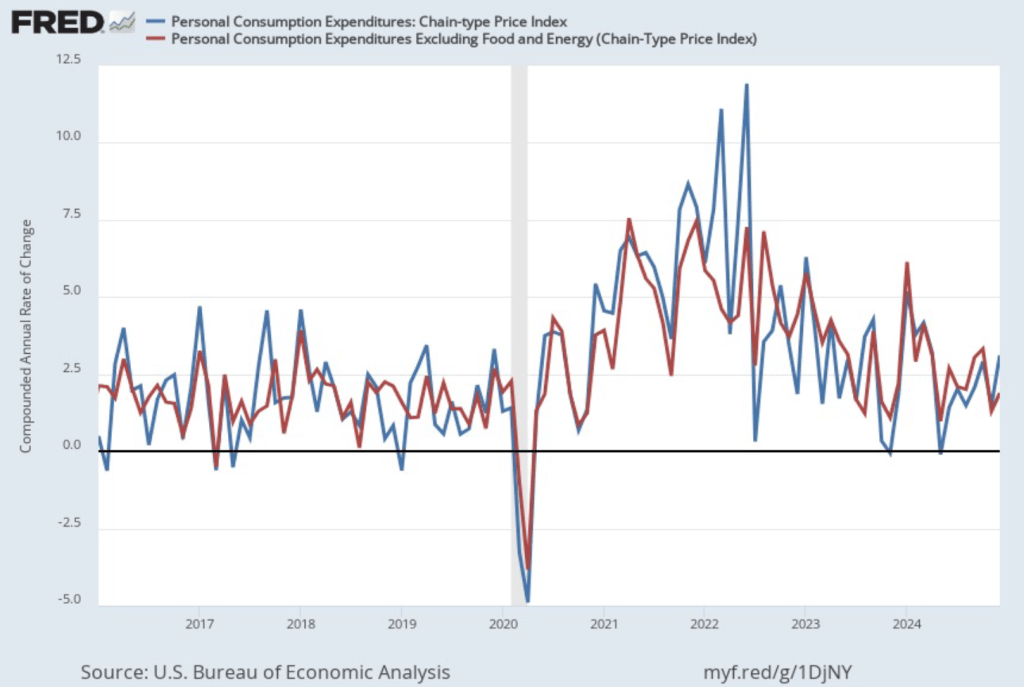
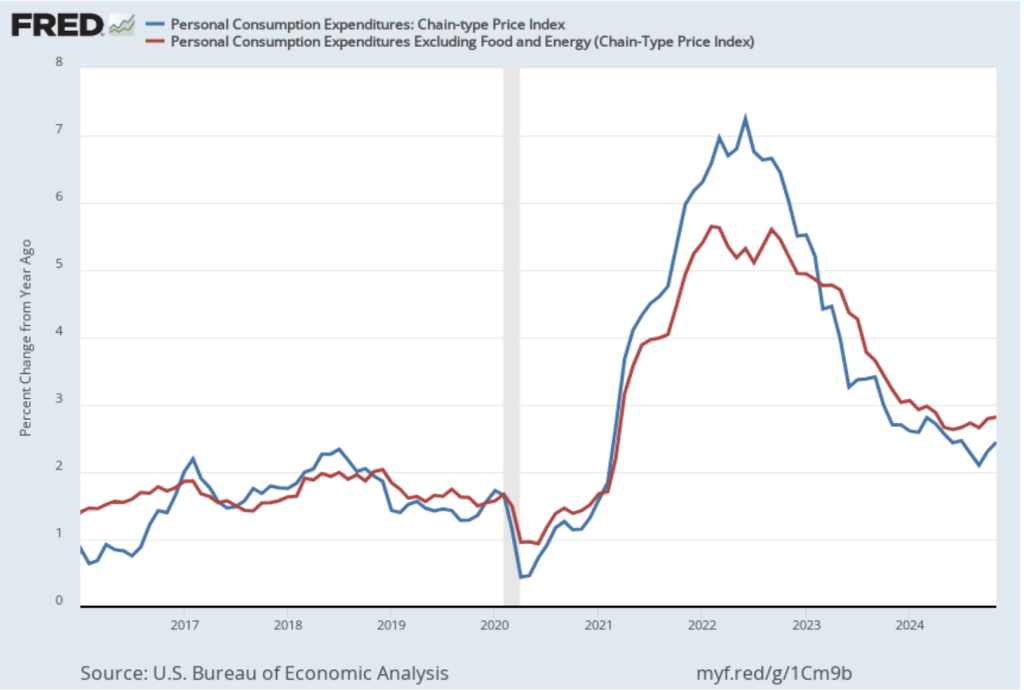
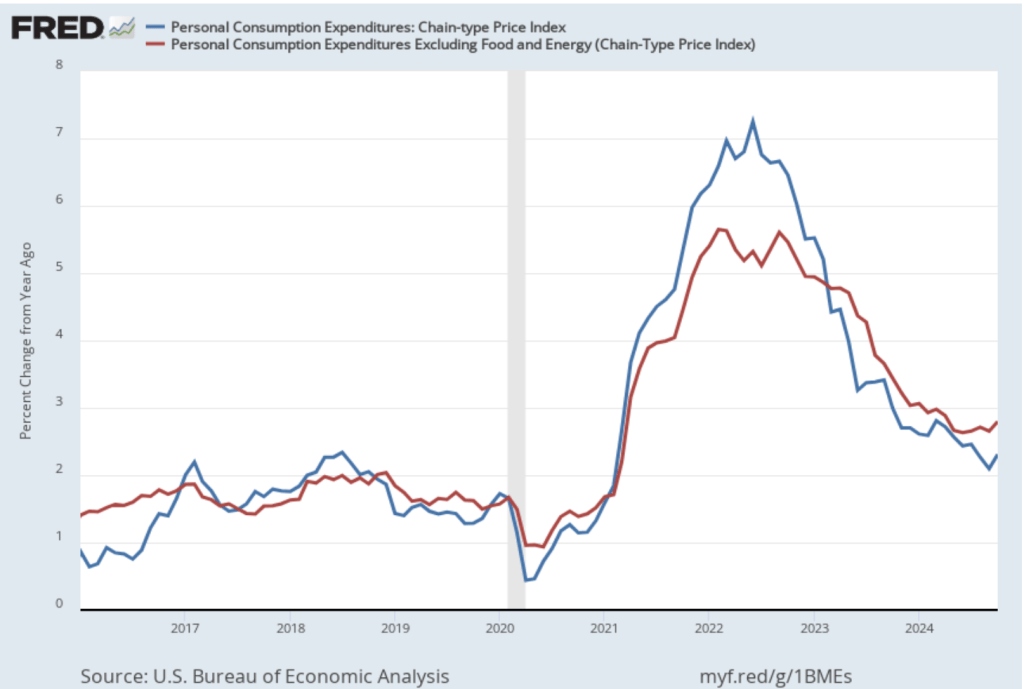
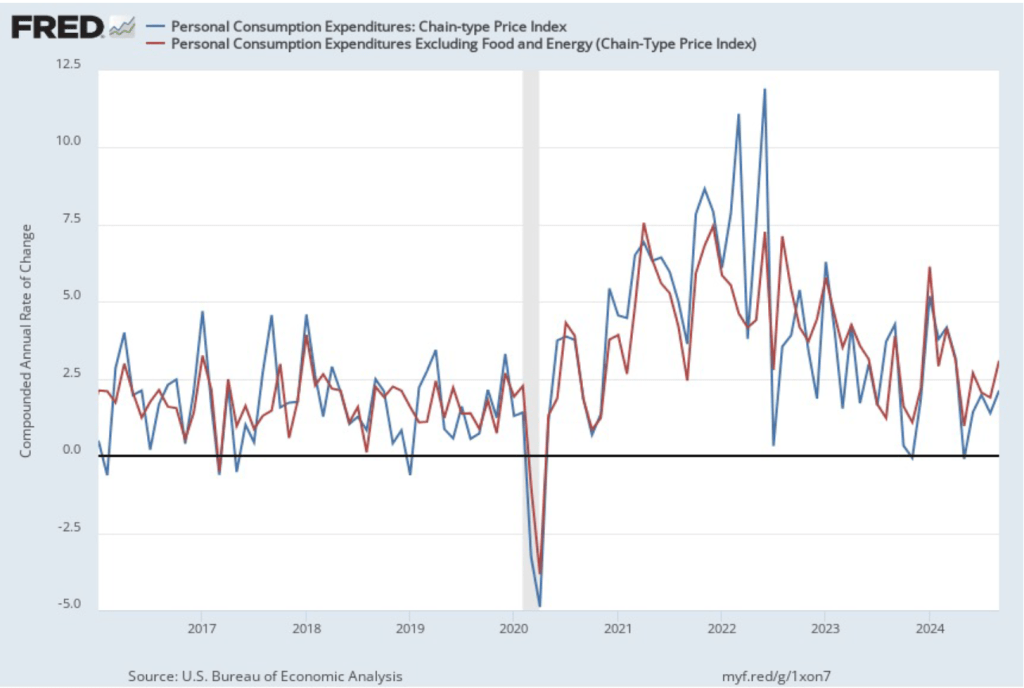
According to the Taylor rule, the Fed should set its current federal funds rate target equal to the sum of the current inflation rate, the equilibrium real federal funds rate, and two additional terms. The first of these terms is the inflation gap—the difference between current inflation and the target rate (currently 2 percent, as measured by the percentage change in the personal consumption expenditures (PCE) price index; the second term is the output gap—the percentage difference of real GDP from potential real GDP. The inflation gap and the output gap are each given “weights” that reflect their influence on the federal funds rate target. With weights of one-half for both gaps, we have the following Taylor rule:
Federal funds rate target = Current inflation rate + Equilibrium real federal funds rate + (1/2 × Inflation gap) + (1/2 × Output gap).
So when the inflation rate is above the Fed’s target rate, the FOMC will raise the target for the federal funds rate. Similarly, when the output gap is negative—that is, when real GDP is less than potential GDP—the FOMC will lower the target for the federal funds rate. In calibrating this rule, Taylor assumed that the equilibrium real federal funds rate is 2 percent and the target rate of inflation is 2 percent. (Note that the Taylor rule we are using here was the one Taylor first proposed in 1993. Since that time, Taylor and other economists have also analyzed other similar rules with, for instance, an assumption of a lower equilibrium real federal funds rate.)
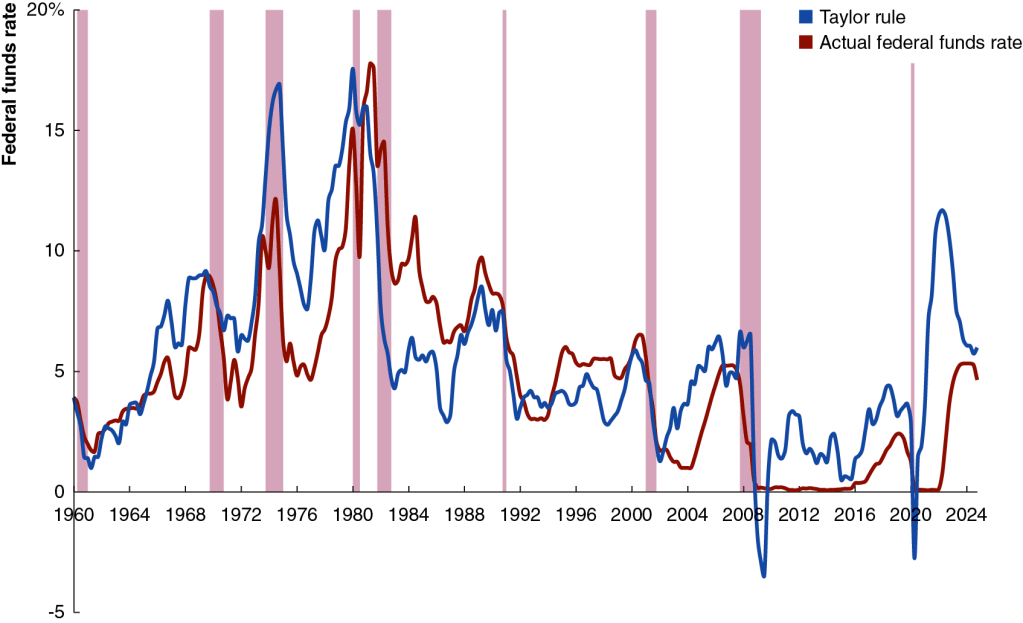
The following figure shows the level of the federal funds rate that would have occurred if the Fed had strictly followed the original Taylor rule (the blue line) and the actual federal funds rate (the red line). The figure indicates that because during many years the two lines are close together, the Taylor rule does a reasonable job of explaining Federal Reserve policy. There are noticeable exceptions, however, such as the period of high inflation that began in the spring of 2021. During that period, the Taylor rule indicates that the FOMC should have begun raising its target for the federal funds rate earlier and raised it much higher than it did.
Taylor has presented a number of arguments in favor of the Fed relying on a rule in conducting monetary policy, including the following:
- A simple policy rule (such as the Taylor rule) makes it easier for households, firms, and investors to understand Fed policy.
- Conducting policy according to a rule makes it less likely that households, firms, and investors will be surprised by Fed policy.
- Fed policy is less likely to be subject to political pressure if it follows a rule: “If monetary policy appears to be run in an ad hoc and complicated way rather than a systematic way, then politicians may argue that they can be just as ad hoc and interfere with monetary policy decisions.”
- Following a rule makes it easier to hold the Fed accountable for policy errors.
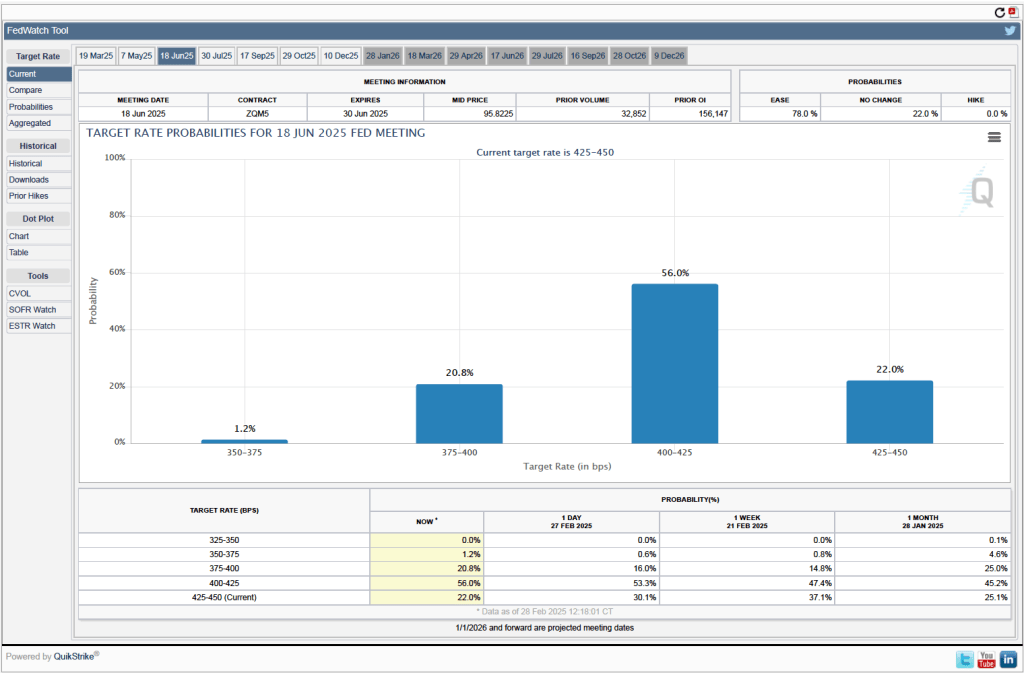
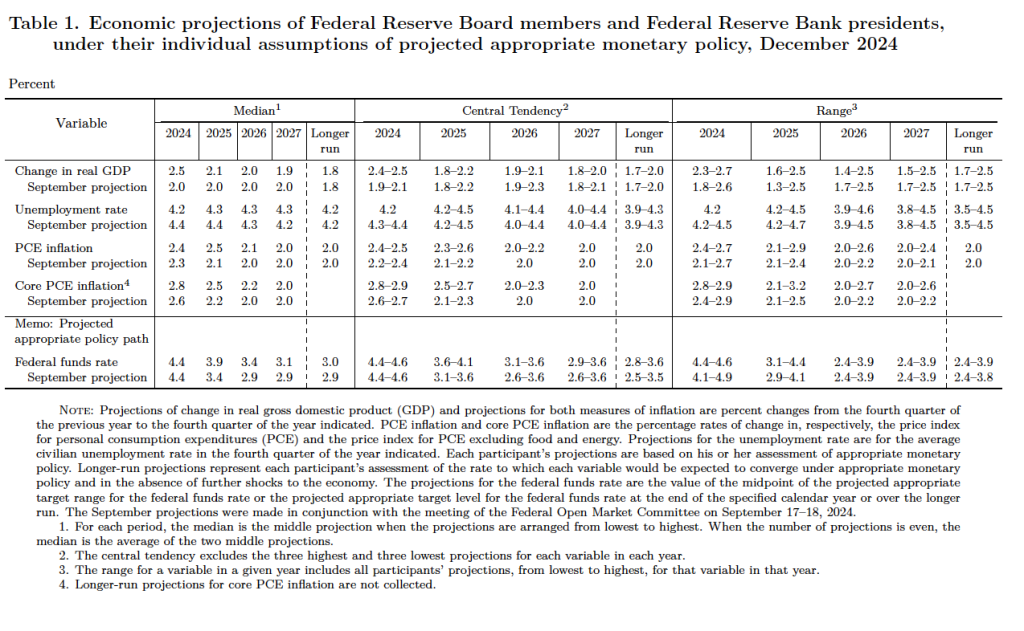
The Fed hasn’t been persuaded by Taylor’s arguments, preferring its current data-driven approach. In setting monetary policy, the members of the FOMC believe in the importance of being forward looking, attempting to take into account the future paths of inflation and unemployment. But committee members can struggle to accurately forecast inflation and unemployment. For instance, at the time of the June 2021 meeting of the FOMC, inflation had already risen above 4%. Nevertheless, committee members forecast that inflation in 2022 would be 2.1%. Inflation in 2022 turned out to be much higher—6.6%.
To succeed with a data-driven approach to policy, members of the FOMC must be able to correctly interpret the importance of new data on economic variables as it becomes available and also accurately forecast the effects of policy changes on key variables, particularly unemployment and inflation. How do the committee members approach these tasks? To some extent they rely on formal economic models, such as those developed by the economists on the committee’s staff. But, judging by their speeches and media interviews, committee members also rely on qualitative analysis in interpreting new data and in forming their expectations of how monetary policy will affect the economy.
In recent years, generative artificial intelligence (AI) and machine learning (ML) programs have made great strides in analyzing large data sets. Should the Fed rely more heavily on these programs in conducting monetary policy? The Fed is currently only in the beginning stages of incorporating AI into its operations. In 2024, the Fed appointed a Chief Artificial Intelligence Officer (CAIO) to coordinate its AI initiatives. Initially, the Fed has used AI primarily in the areas of supervising the payment system and promoting financial stability. AI has the ability to quickly analyze millions of financial transactions to identify those that may be fraudulent or may not be in compliance with financial and banking regulations. How households, firms, and investors respond to Fed policies is an important part of how effective the policies will be. The Fed staff has used AI to analyze how financial markets are likely to react to FOMC policy announcements.
The Central Bank of Canada has gone further than the Fed in using AI. According to Tiff Macklem, the Governor of the Bank of Canada, AI is used to:
• forecast inflation, economic activity and demand for bank notes
• track sentiment in key sectors of the economy
• clean and verify regulatory data
• improve efficiency and de-risk operations
Will central banks begin to use AI to carry out the key activity of setting policy interest rates, such as the federal funds rate in the United States? AI has the potential to adjust the federal funds rate more promptly than the members of the FOMC are able to do in their eight yearly meetings. Will it happen? At this point, generative AI and ML models are not capable of taking on that responsibility. In addition, as noted earlier, Taylor and other supporters of rules-based policies have argued that simple rules are necessary for the public to understand Fed policy. AI generated rules are likely to be too complex to be readily understood by non-specialists.
It’s too early in the process of central banks adopting AI in their operations to know the eventual outcome. But AI is likely to have a significant effect on central banks, just as it is already affecting many businesses.