Image generated by ChatGPT.
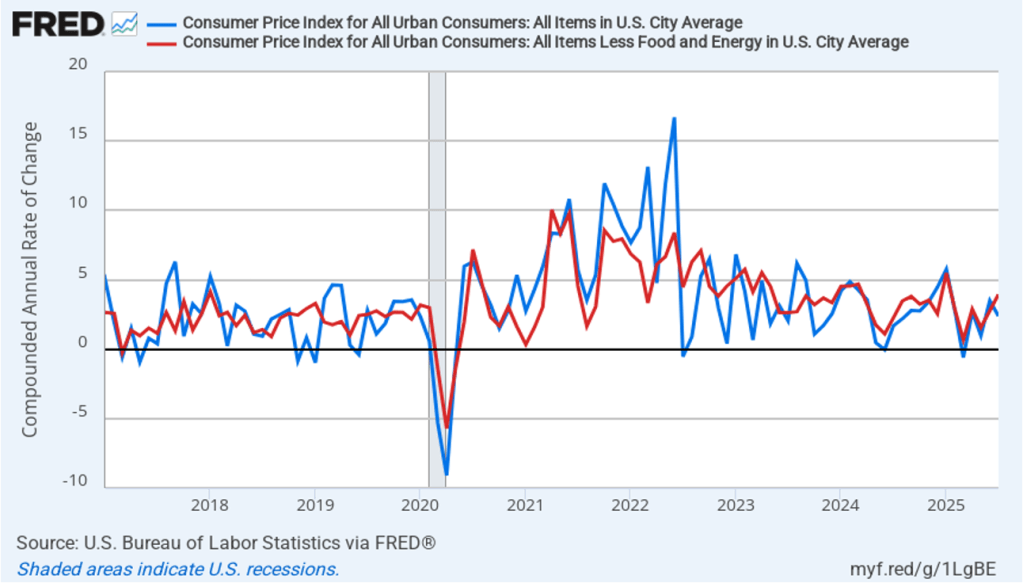
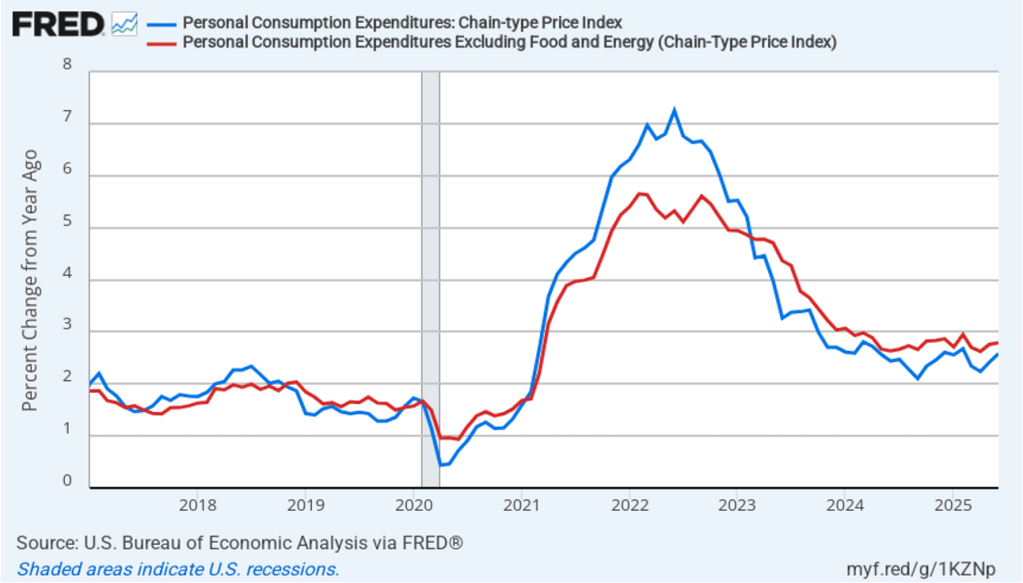
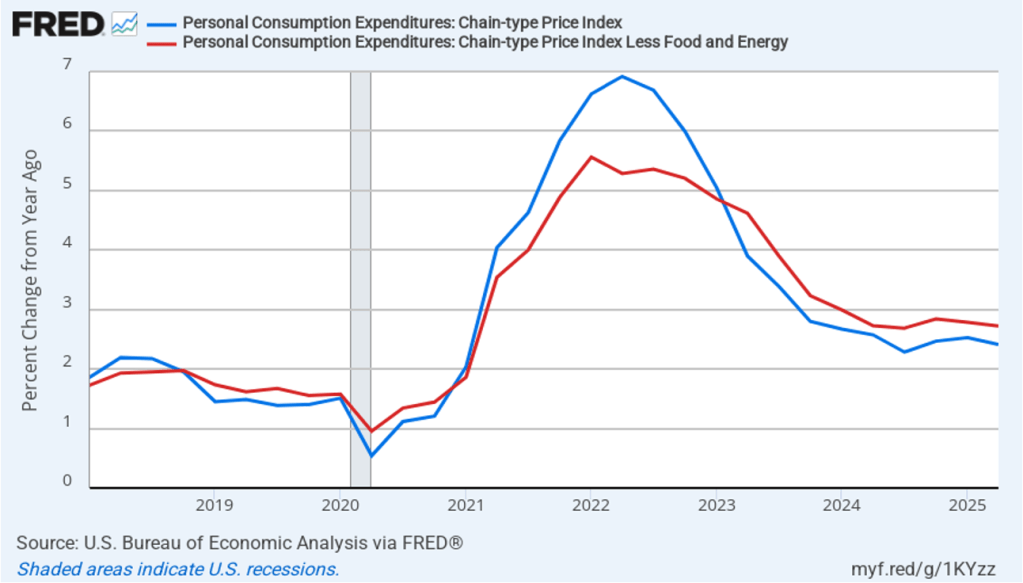
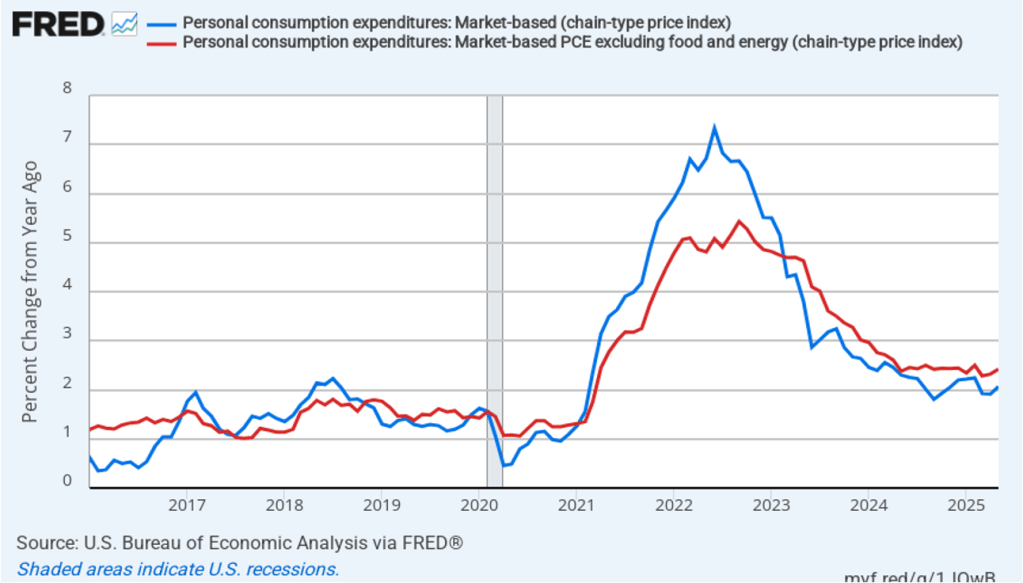
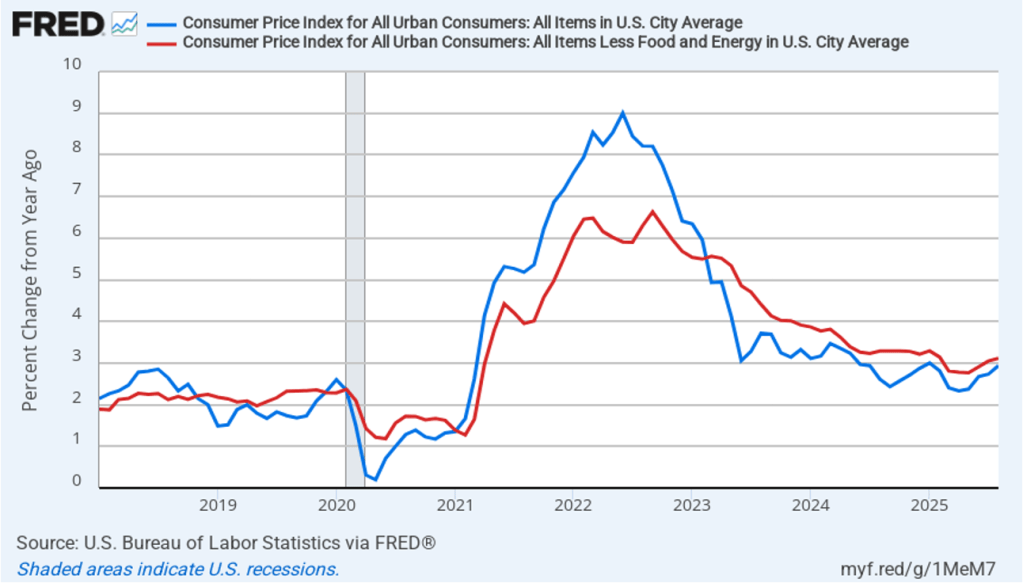
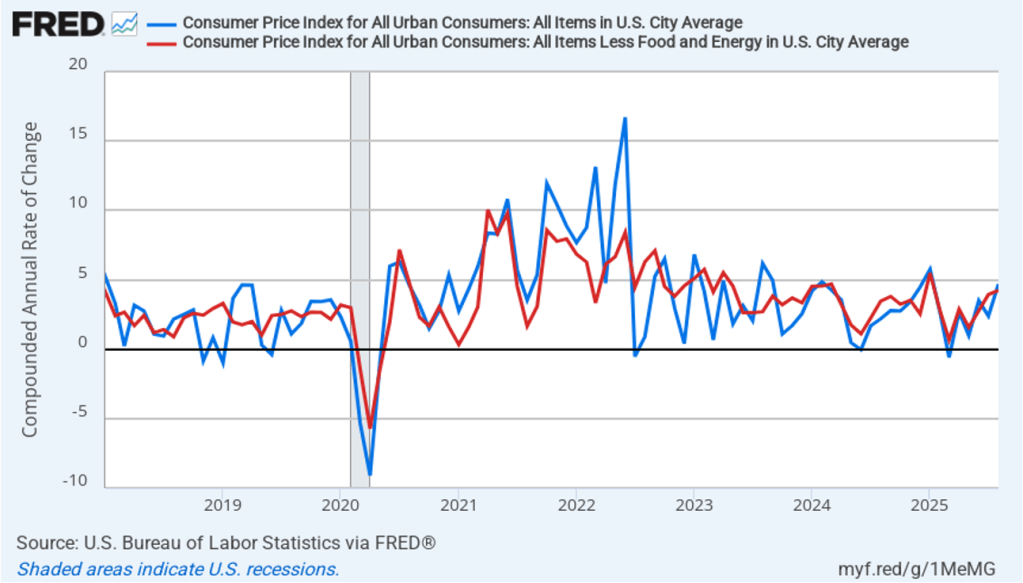
Today (September 11), the Bureau of Labor Statistics (BLS) released its report on the consumer price index (CPI) for August. The following figure compares headline CPI inflation (the blue line) and core CPI inflation (the red line).
- The headline inflation rate, which is measured by the percentage change in the CPI from the same month in the previous year, was 2.9 percent in August, up from 2.7 in July.
- The core inflation rate, which excludes the prices of food and energy, was 3.1 percent in August, up slightly from 3.0 percent in July.
Headline inflation and core inflation were both the same as economists surveyed had expected.
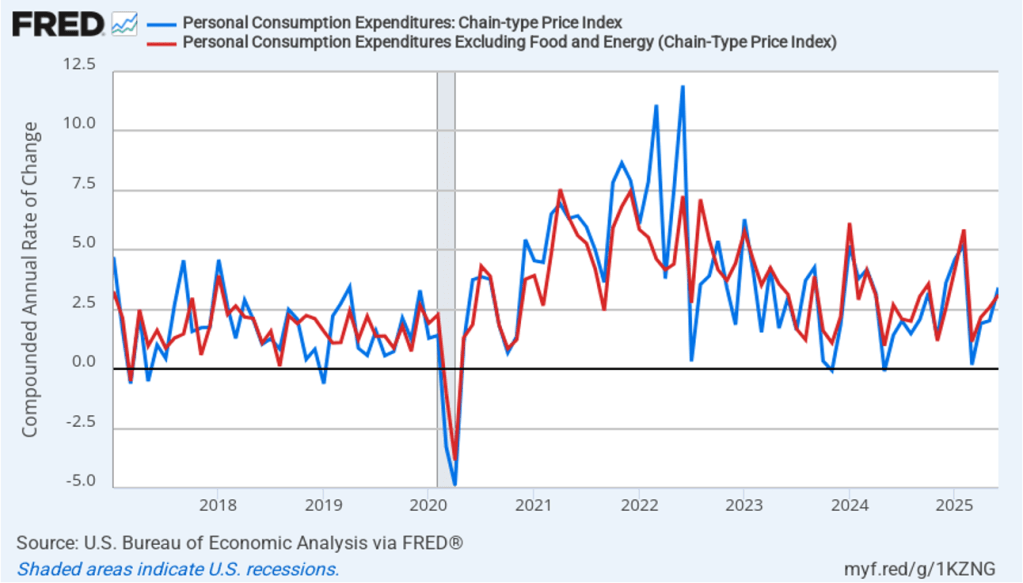
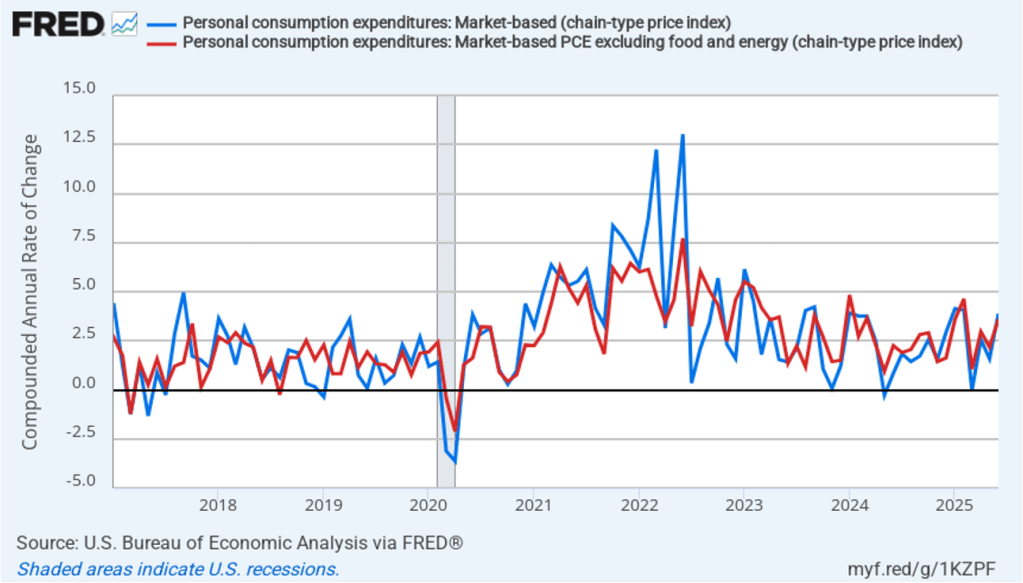
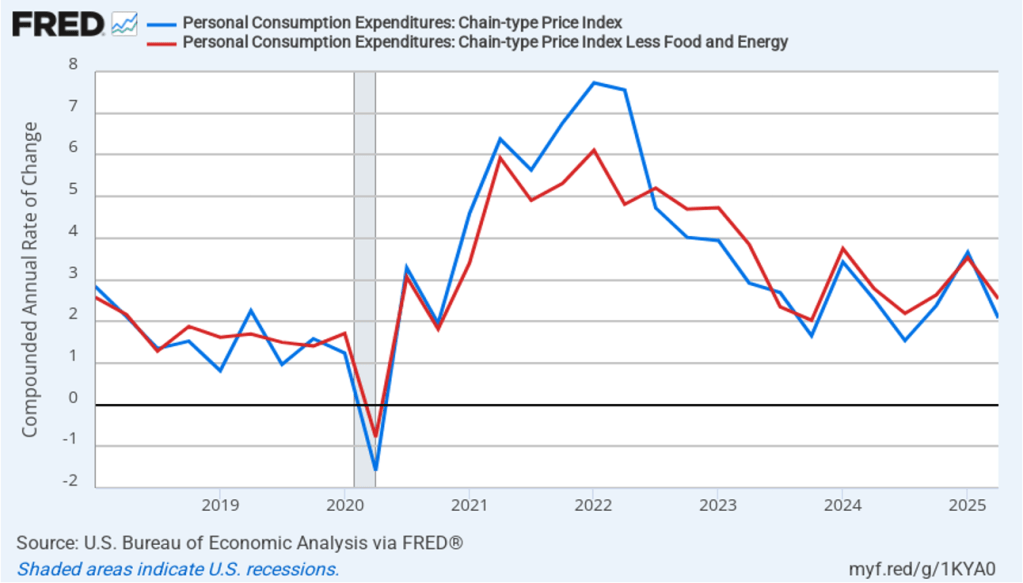
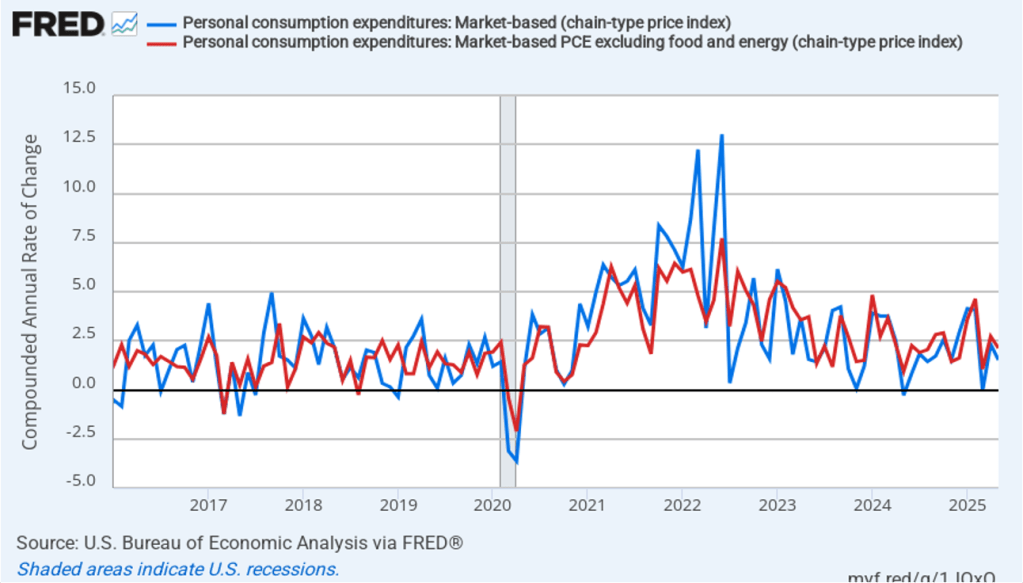
In the following figure, we look at the 1-month inflation rate for headline and core inflation—that is the annual inflation rate calculated by compounding the current month’s rate over an entire year. Calculated as the 1-month inflation rate, headline inflation (the blue line) jumped from 2.4 percent in July to 4.7 percent in August. Core inflation (the red line) increased from 3.9 percent in July to 4.2 percent in August.
The 1-month and 12-month inflation rates are both indicating that inflation accelerated in August. Core inflation—which is often a good indicator of future inflation—in particular has been running well above the Fed’s 2 percent inflation target during the last two months.
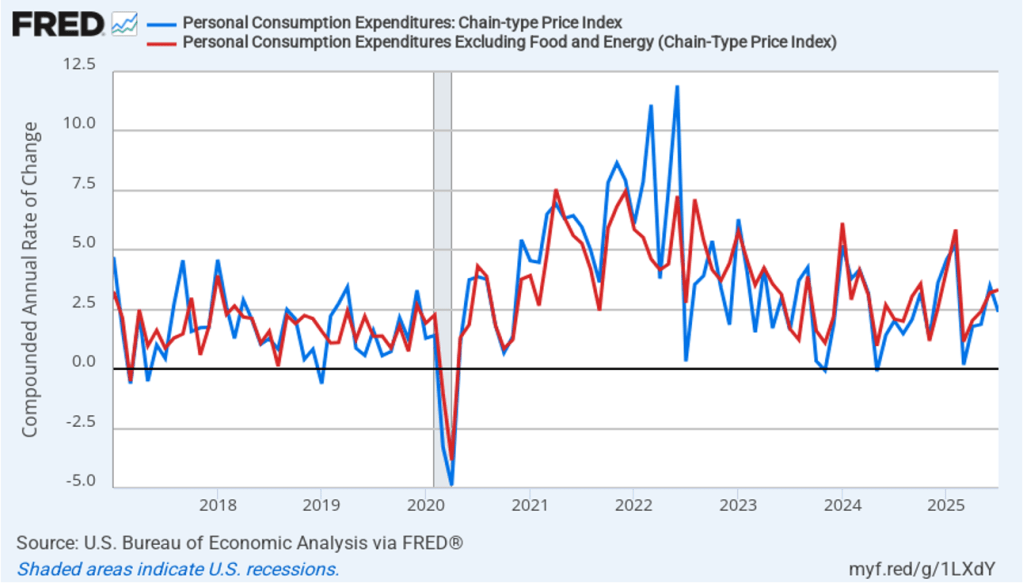
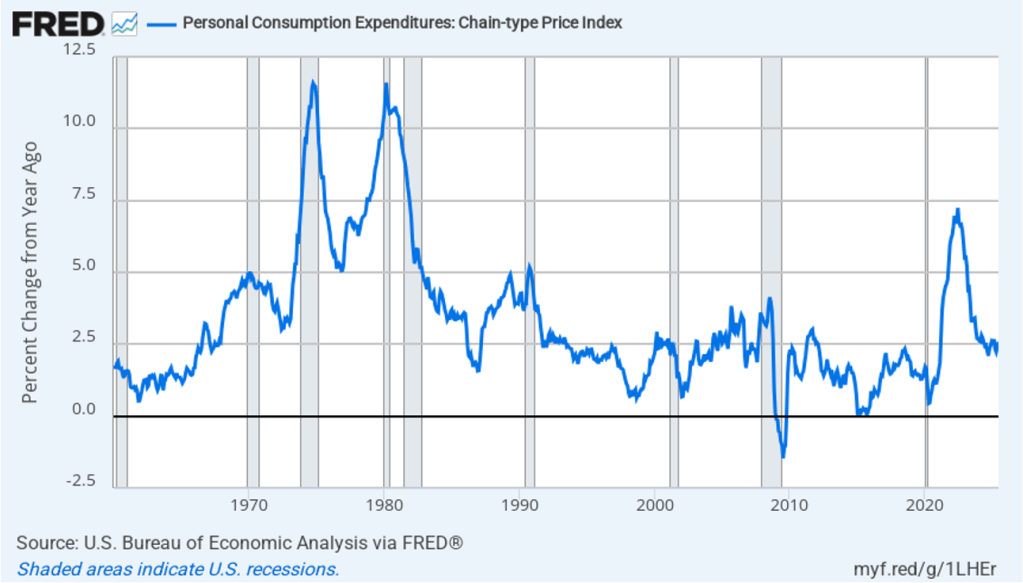
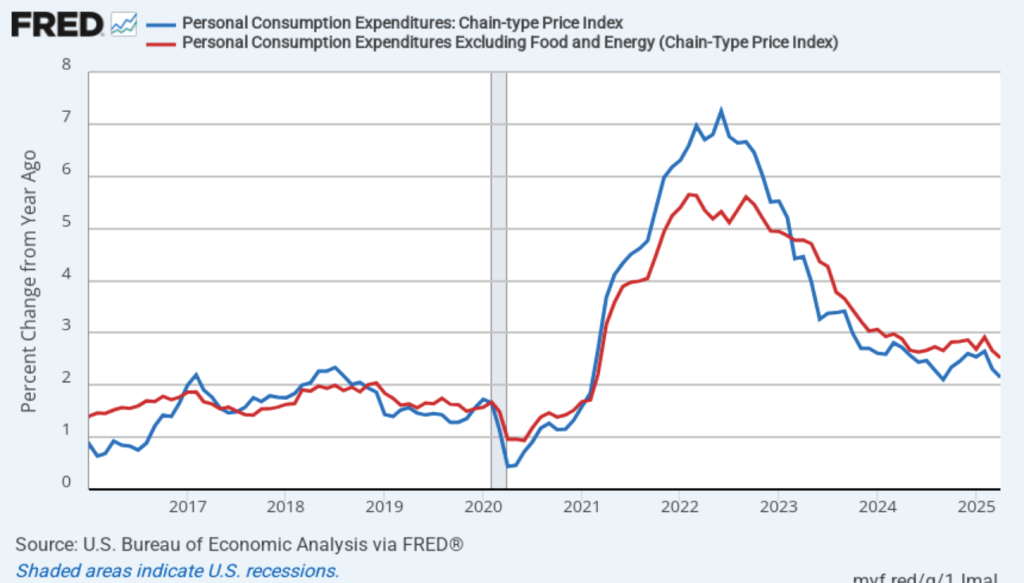
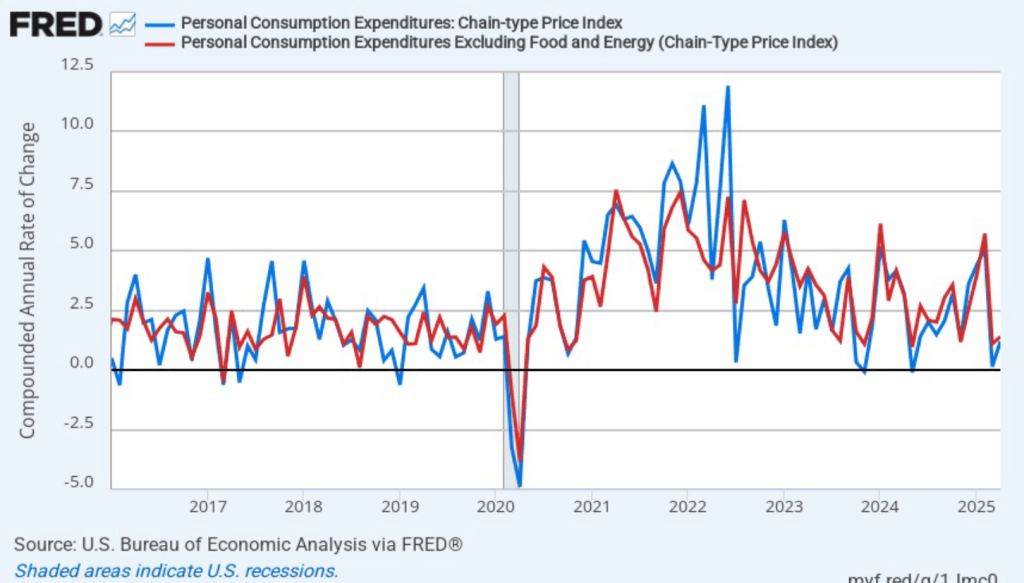
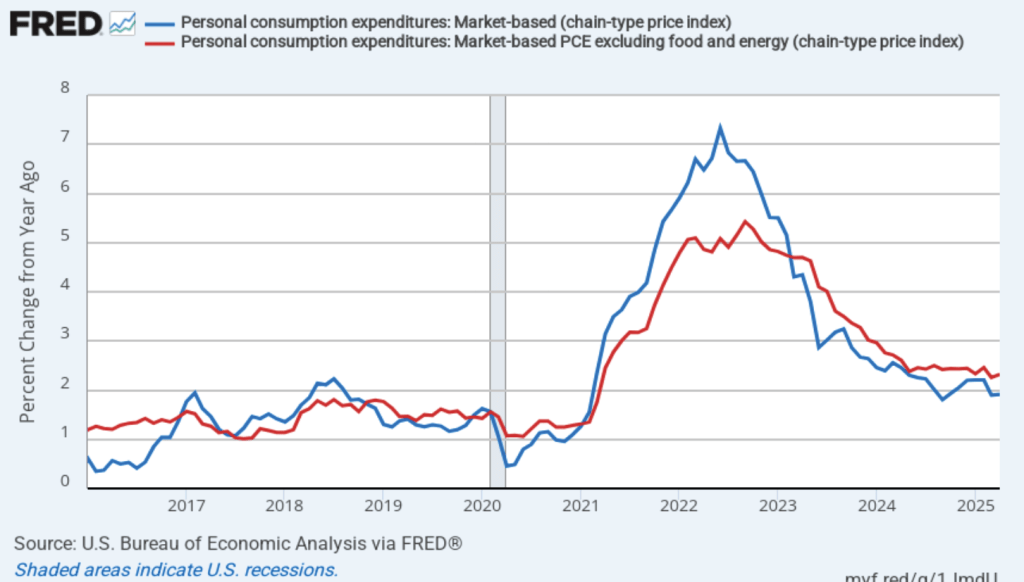
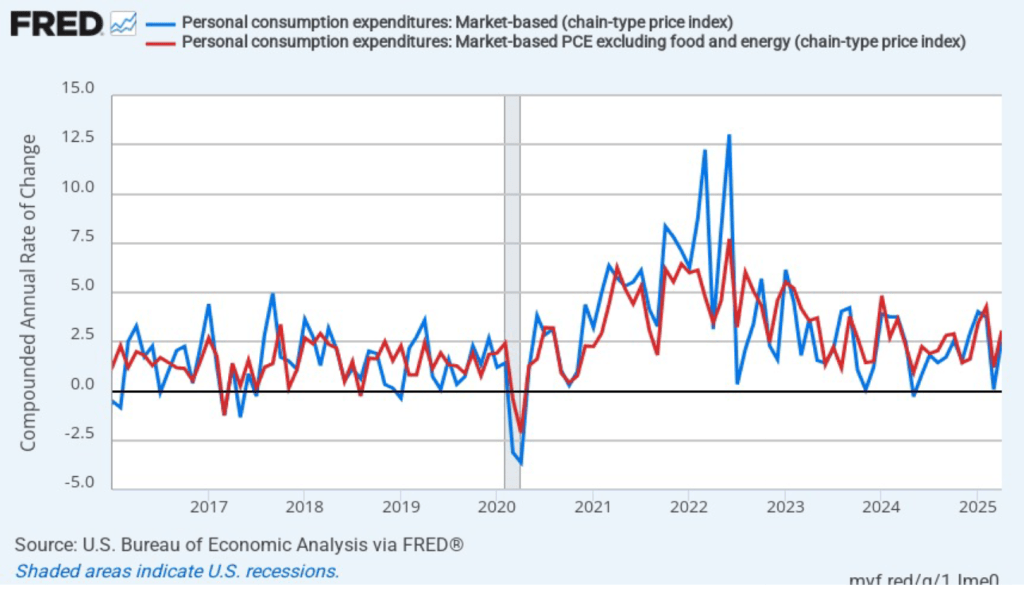
Of course, it’s important not to overinterpret the data from a single month. The figure shows that the 1-month inflation rate is particularly volatile. Also note that the Fed uses the personal consumption expenditures (PCE) price index, rather than the CPI, to evaluate whether it is hitting its 2 percent annual inflation target.
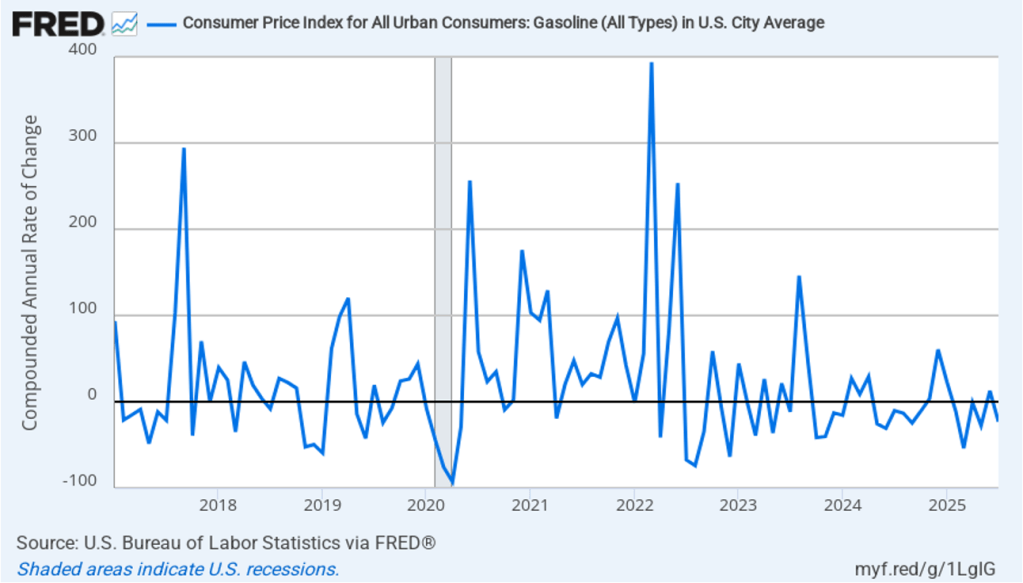
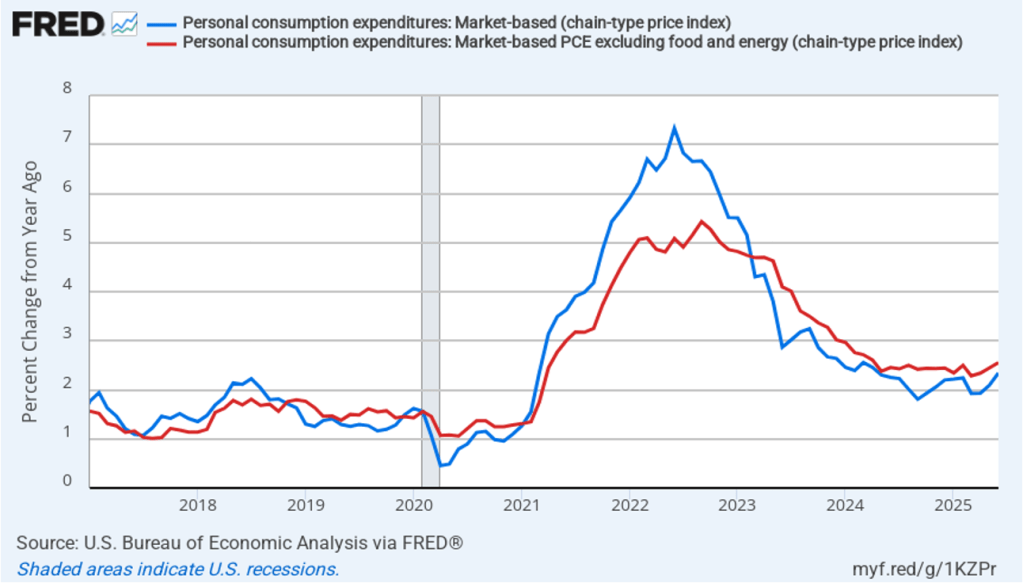
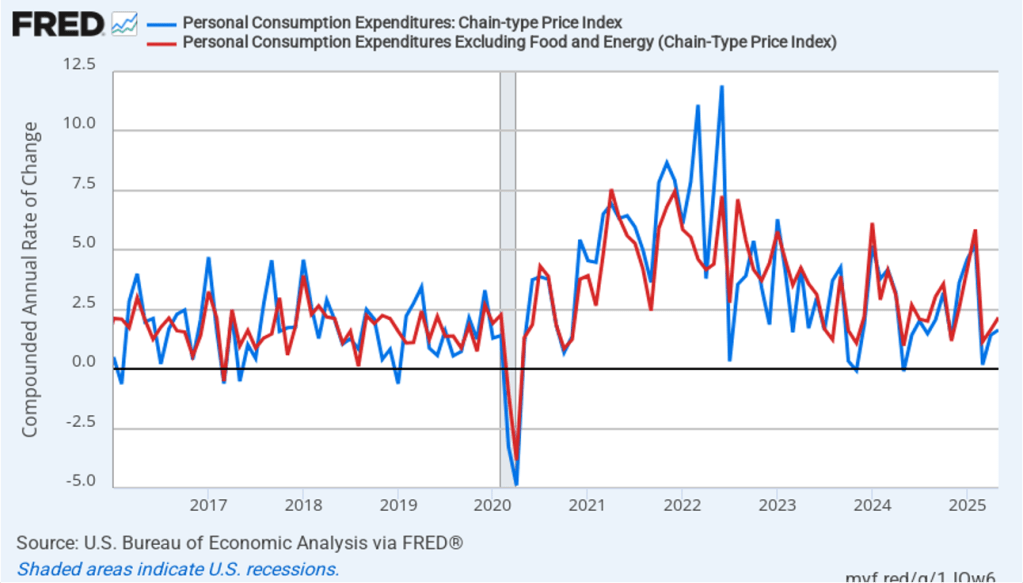
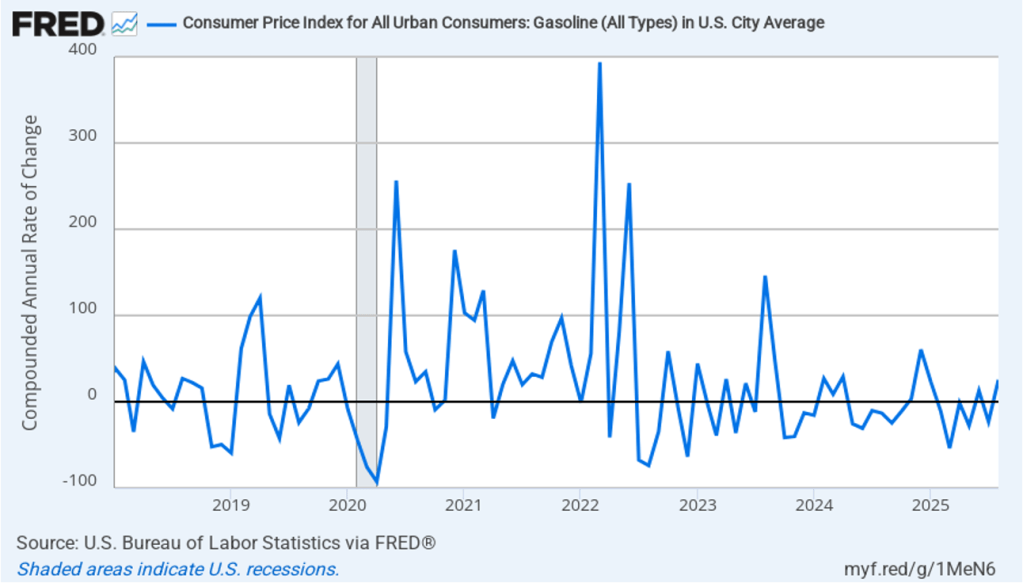
Core inflation had been running significantly higher than headline inflation in the past few months because gasoline prices had generally been falling since February. Gasoline prices turned around in August, however, increasing at a 25.5 percent annual rate. As shown in the following figure, 1-month inflation in gasoline prices moves erratically—which is the main reason that gasoline prices aren’t included in core inflation.
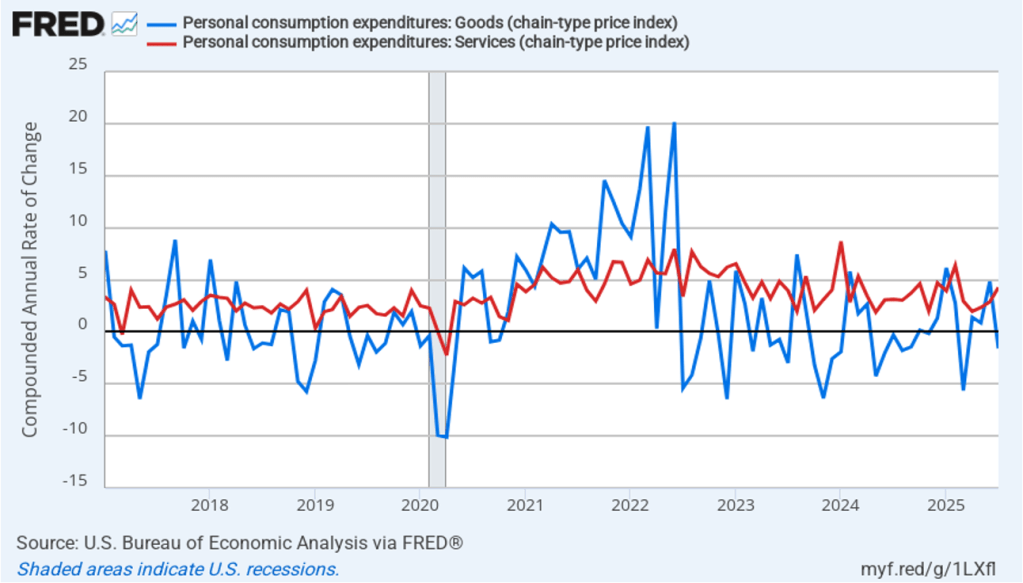
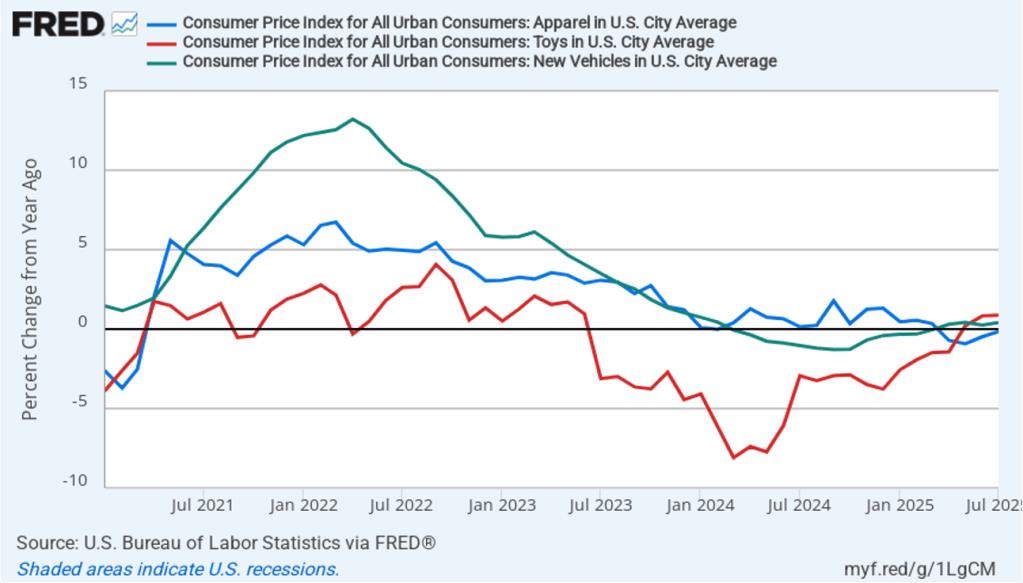
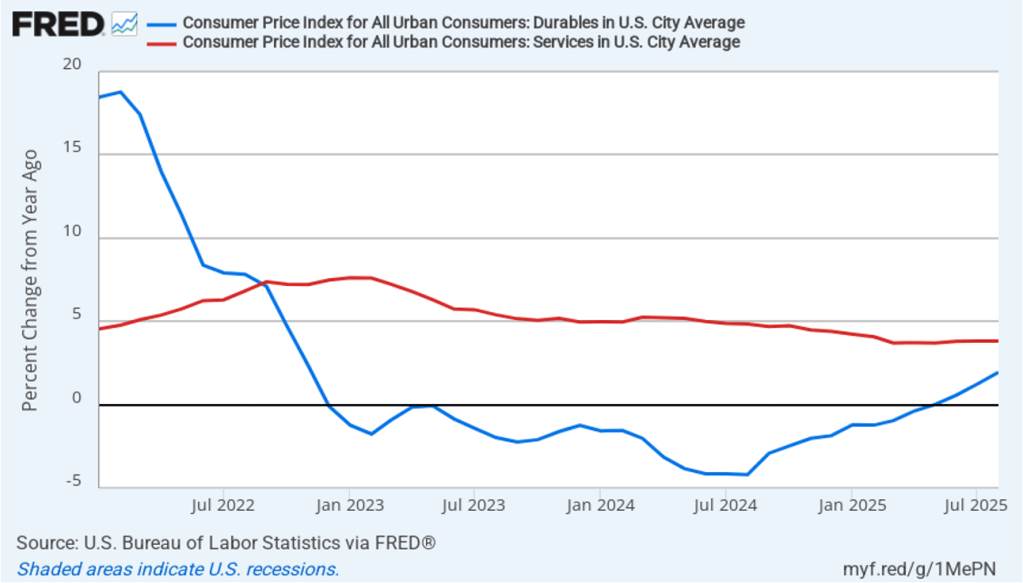
Does the increase in inflation represent the effects of the increases in tariffs that the Trump administration announced on April 2? (Note that many of the tariff increases announced on April 2 have since been reduced) The following figure shows 12-month inflation in durable goods—such as furniture, appliances, and cars—which are likely to be affected directly by tariffs, and services, which are less likely to be affected by tariffs.. To make recent changes clearer, we look only at the months since January 2022. In August, inflation in durable goods increased to 1.9 percent from 1.2 percent in July. Inflation in services in August was 3.8 percent, unchanged from July.
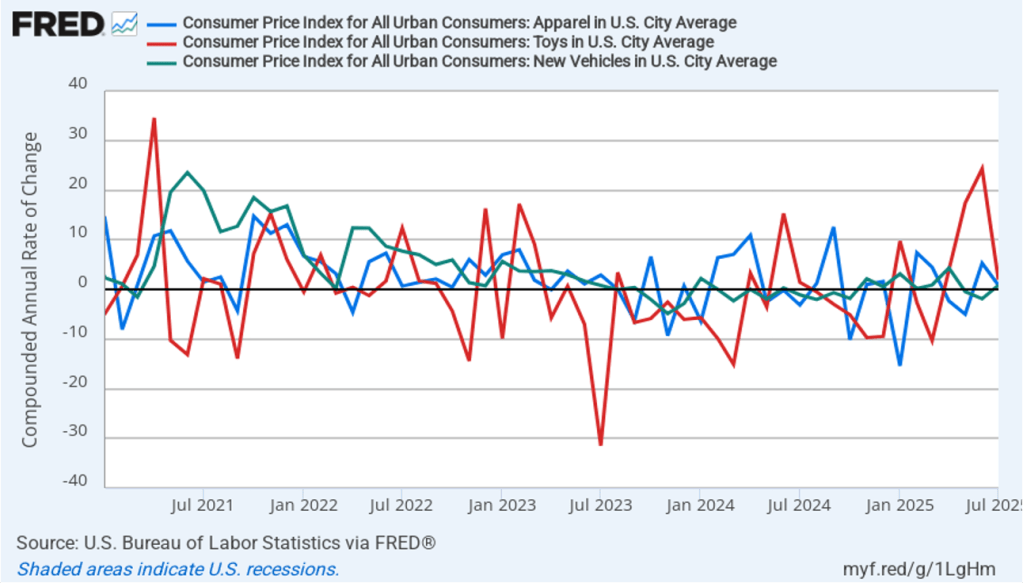
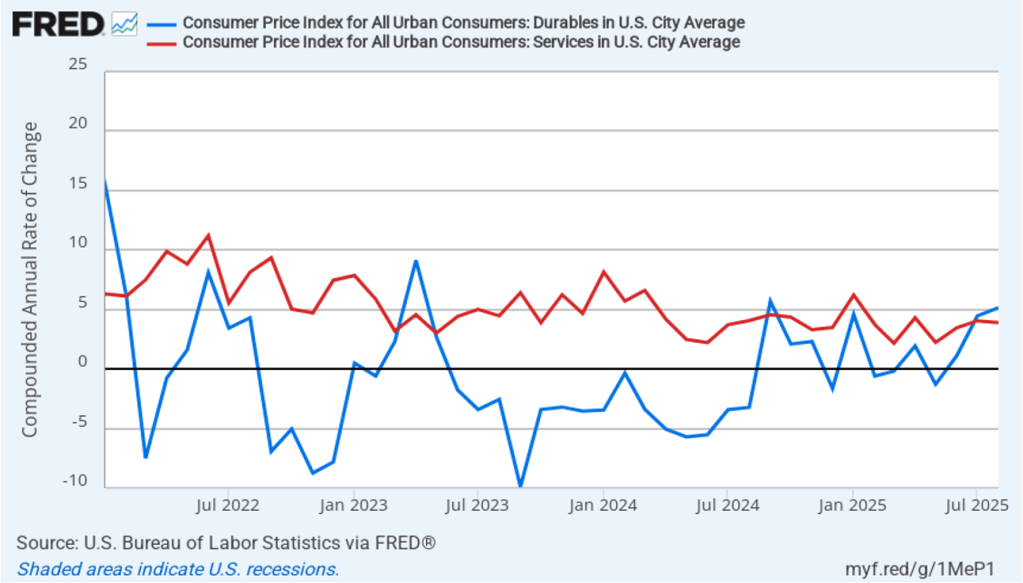
The following figure shows 1-month inflation in the prices of these products, which may make the effects of tariffs clearer. In August, durable goods inflation was 5.1 percent up from 4.5 percent in July. Service inflation was 3.9 percent in August, down slightly from 4.0 percent in July. Inflation in goods and services both running well above 2 percent is not good news for inflation falling back to the Fed’s 2 percent target in the near future.
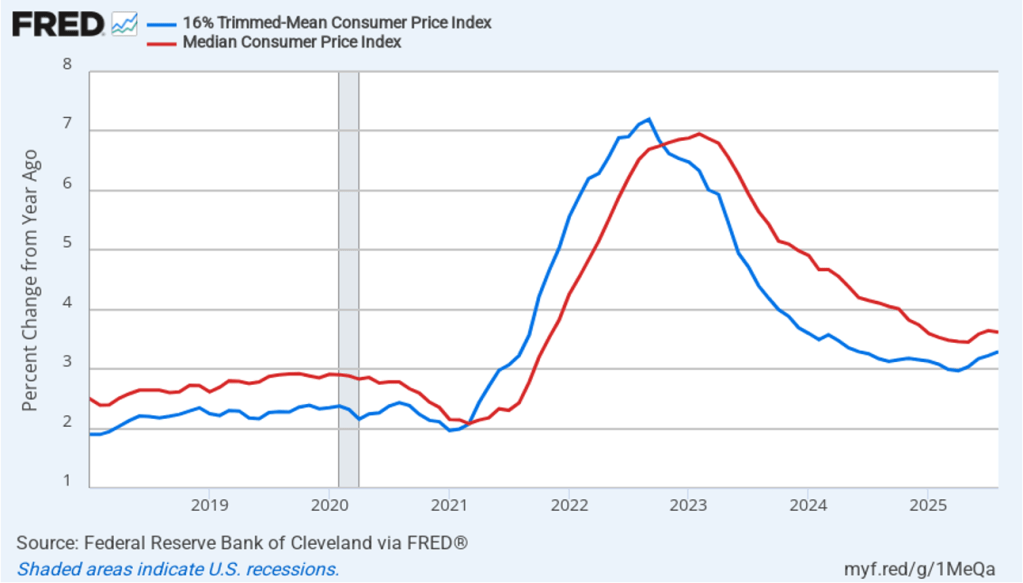
To better estimate the underlying trend in inflation, some economists look at median inflation and trimmed mean inflation.
- Median inflation is calculated by economists at the Federal Reserve Bank of Cleveland and Ohio State University. If we listed the inflation rate in each individual good or service in the CPI, median inflation is the inflation rate of the good or service that is in the middle of the list—that is, the inflation rate in the price of the good or service that has an equal number of higher and lower inflation rates.
- Trimmed-mean inflation drops the 8 percent of goods and services with the highest inflation rates and the 8 percent of goods and services with the lowest inflation rates.
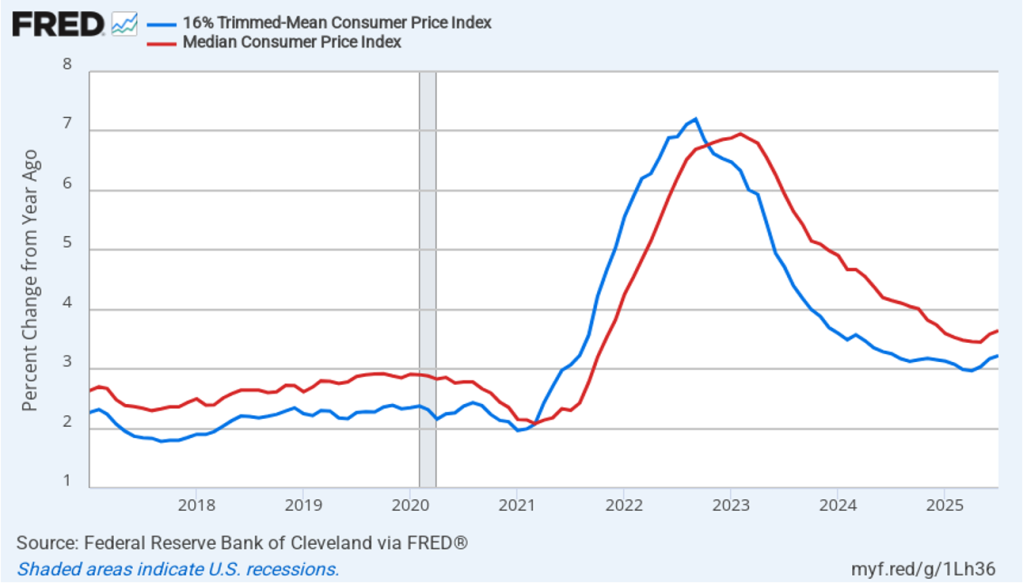
The following figure shows that 12-month trimmed-mean inflation (the blue line) was 3.3 percent in August, up slightly from 3.2 July. Twelve-month median inflation (the red line) 3.6 percent in August, unchanged from July.
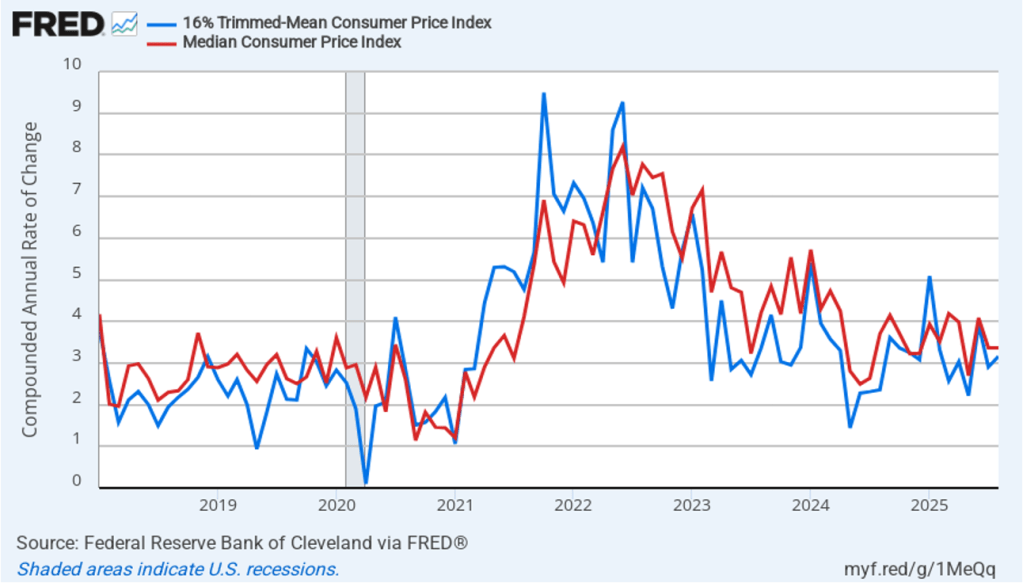
The following figure shows 1-month trimmed-mean and median inflation. One-month trimmed-mean inflation rose from 2.9 percent in July to 3.2 percent in August. One-month median inflation remained unchanged at 3.4 percent in August. These data are consistent with the view that inflation is running above the Fed’s 2 percent target.
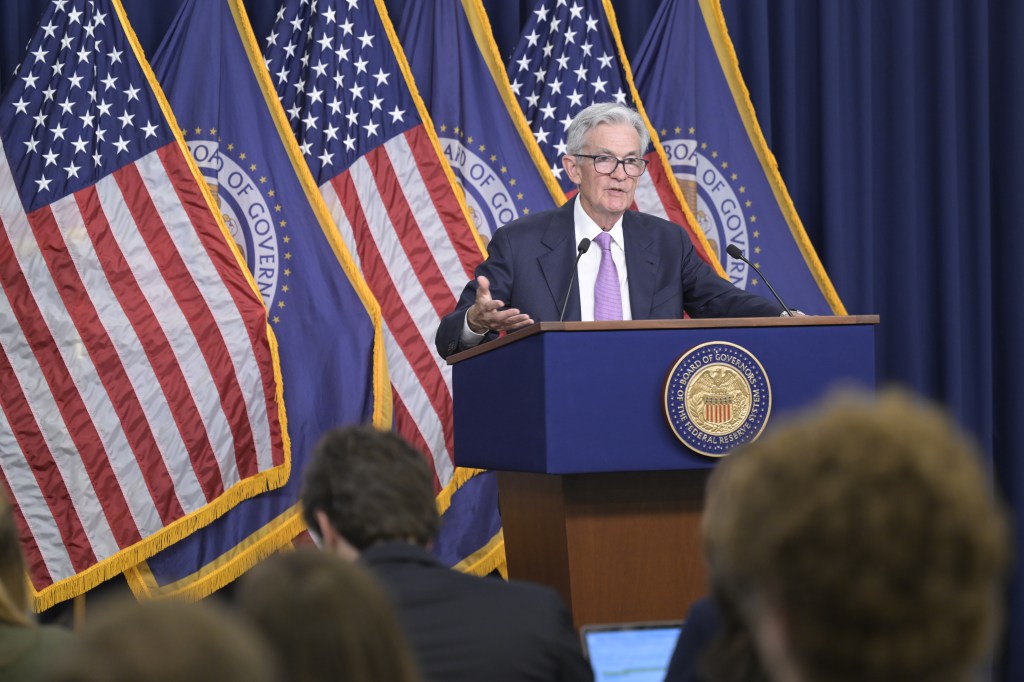
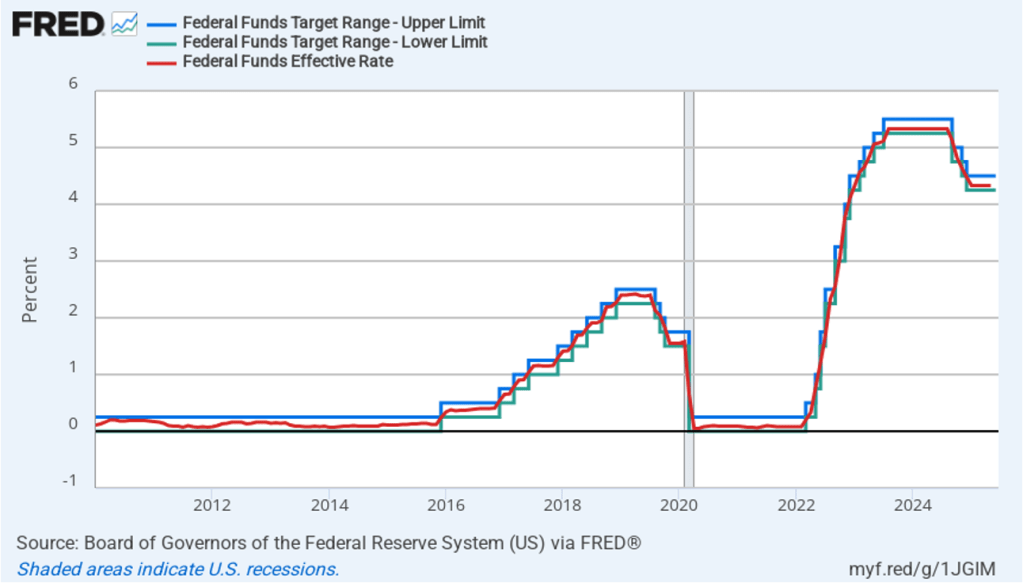
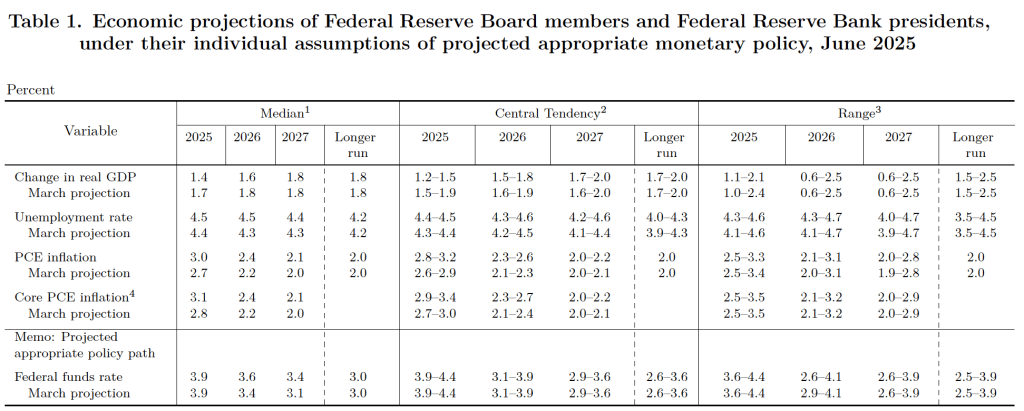
The CPI inflation data combined with the recent jobs data (which we discuss here and here), indicate that the U.S. economy may be entering a period of stagflation—a combination of rising inflation with falling, or stagnating, output. Stagflation poses a policy dilemma for the Fed’s policymaking Federal Open Market Committee (FOMC) because cutting its target for the federal funds rate to increase economic growth and employment may worsen inflation. At this point, it seems likely that the FOMC will “look through” this month’s rising inflation because it may be largely due to one-time price increases caused by tariffs. Committee members have signaled that they are likely to cut their target for the federal funds rate by 0.25 percent (25 basis points) at the conclusion of their meeting on September 16–17 and again at the conclusion of the following meeting on October 28–29.