Key Macro Data Series during the Time Since the Arrival of Covid–19 in the United States

A bookstore in New York City closed during Covid. (Photo from the New York Times)

Four years ago, in mid-March 2020, Covid–19 began to significantly affect the U.S. economy, with hospitalizations rising and many state and local governments closing schools and some businesses. In this blog post we review what’s happened to key macro variables during the past four years. Each monthly series starts in February 2020 and the quarterly series start in the fourth quarter of 2019.

Production

Real GDP declined by 5.8 percent from the fourth quarter of 2019 to the first quarter of 2020 and by an additional 28.0 percent from the first quarter of 2020 to the second quarter. This decline was by far the largest in such a short period in the history of the United States. From the second quarter to the third quarter of 2020, as businesses began to reopen, real GDP increased by 34.8 percent, which was by far the largest increase in a single quarter in U.S. history.

Industrial production followed a similar—although less dramatic—path to real GDP, declining by 16.8 percent from February 2020 to April 2020 before increasing by 12.3 percent from April 2020 to June 2020. Industrial production did not regain its February 2020 level until March 2022. The swings in industrial production were smaller than the swings in GDP because industrial production doesn’t include the output of the service sector, which includes firms like restaurants, movie theaters, and gyms that were largely shutdown in some areas. (Industrial production measures the real output of the U.S. manufacturing, mining, and electric and gas utilities industries. The data are issued by the Federal Reserve and discussed here.)

Employment

Nonfarm payroll employment, collected by the Bureau of Labor Statistics (BLS) in its establishment survey, followed a path very similar to the path of production. Between February and April 2020, employment declined by an astouding 22 million workers, or by 14.4 percent. This decline was by far the largest in U.S. history over such a short period. Employment increased rapidly beginning in April but didn’t regain its February 2020 level until June 2022.

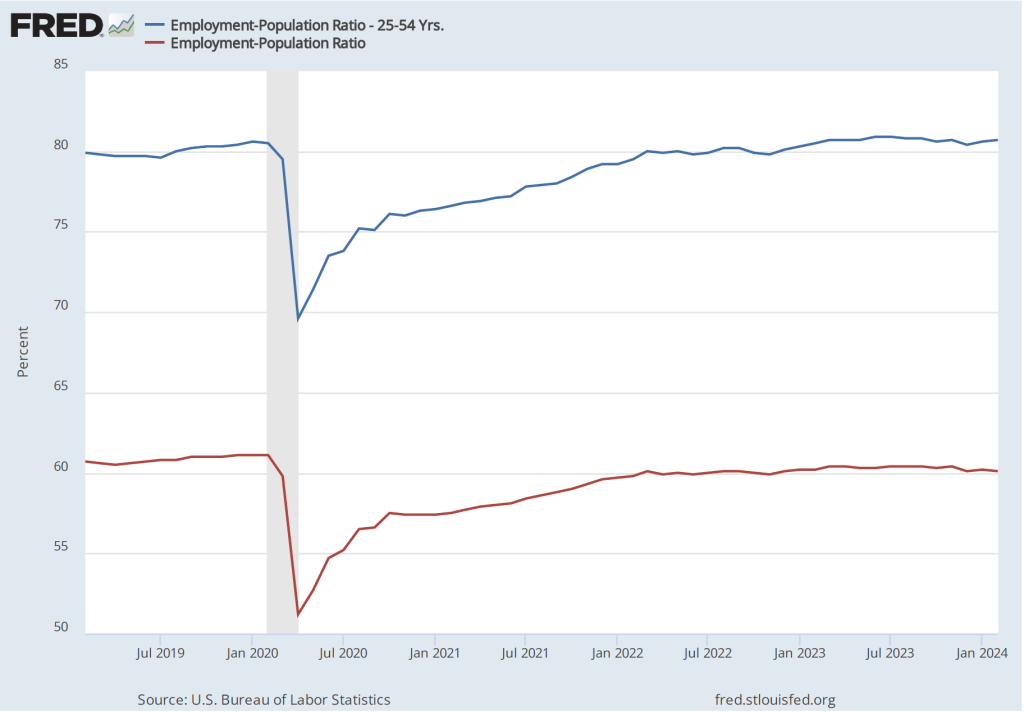
The employment-population ratio measures the percentage of the working-age population that is employed. It provides a more comprehensive measure of an economy’s utilization of available labor than does the total number of people employed. In the following figure, the blue line shows the employment-population ratio for the whole working-age population and the red line shows the employment-population ratio for “prime age workers,” those aged 25 to 54.

For both groups, the employment-population ratio plunged as a result of Covid and then slowly recovered as the production began increasing after April 2020. The employment-population ratio for prime age workers didn’t regain its February 2020 value until February 2023, an indication of how long it took the labor market to fully overcome the effects of the pandemic. As of February 2024, the employment-population ratio for all people of working age hasn’t returned to its February 2020 value, largely because of the aging of the U.S. population.
Average weekly hours worked followed an unusual pattern, declining during March 2020 but then increasing to beyond its February 2020 level to a peak in April 2021. This increase reflects firms attempting to deal with a shortage of workers by increasing the hours of those people they were able to hire. By April 2023, average weekly hours worked had returned to its February 2020 level.

Income

Real average hourly earnings surged by more than six percent between February and April 2020—a very large increase over a two-month period. But some of the increase represented a composition effect—as workers with lower incomes in services industries such as restaurants were more likely to be out of work during this period—rather than an actual increase in the real wages received by people employed during both months. (Real average hourly earnings are calculated by dividing nominal average hourly earnings by the consumer price index (CPI) and multiplying by 100.)

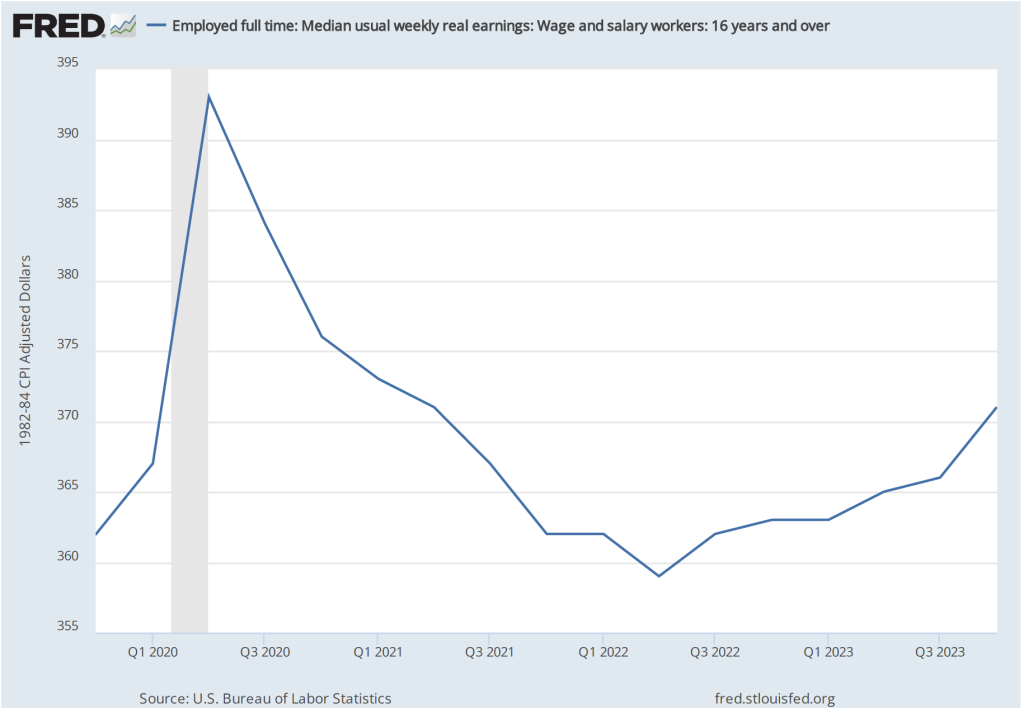
Median weekly real earnings, because it is calculated as a median rather than as an average (or mean), is less subject to composition effects than is real average hourly earnings. Median weekly real earnings increased sharply between February and April of 2020 before declining through June 2022. Earnings then gradually increased. In February 2024 they were 2.5 percent higher than in February 2020.
Inflation

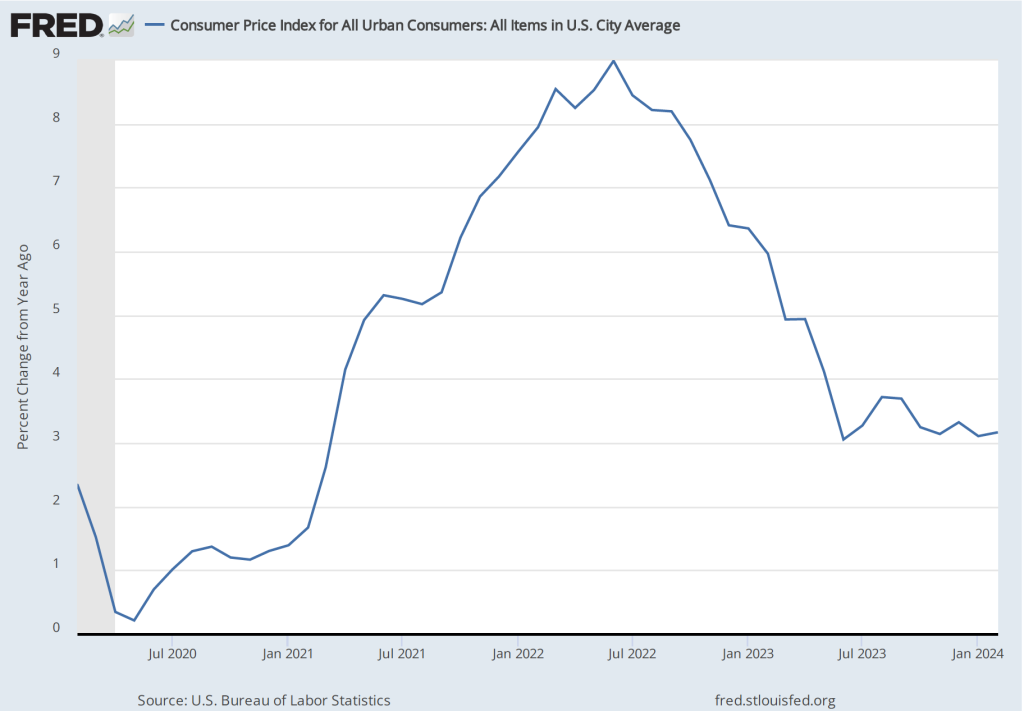
The inflation rate most commonly mentioned in media reports is the percentage change in the CPI from the same month in the previous year. The following figure shows that inflation declined from February to May 2020. Inflation then began to rise slowly before rising rapidly beginning in the spring of 2021, reaching a peak in June 2022 at 9.0 percent. That inflation rate was the highest since November 1981. Inflation then declined steadily through June 2023. Since that time it has fluctuated while remaining above 3 percent.
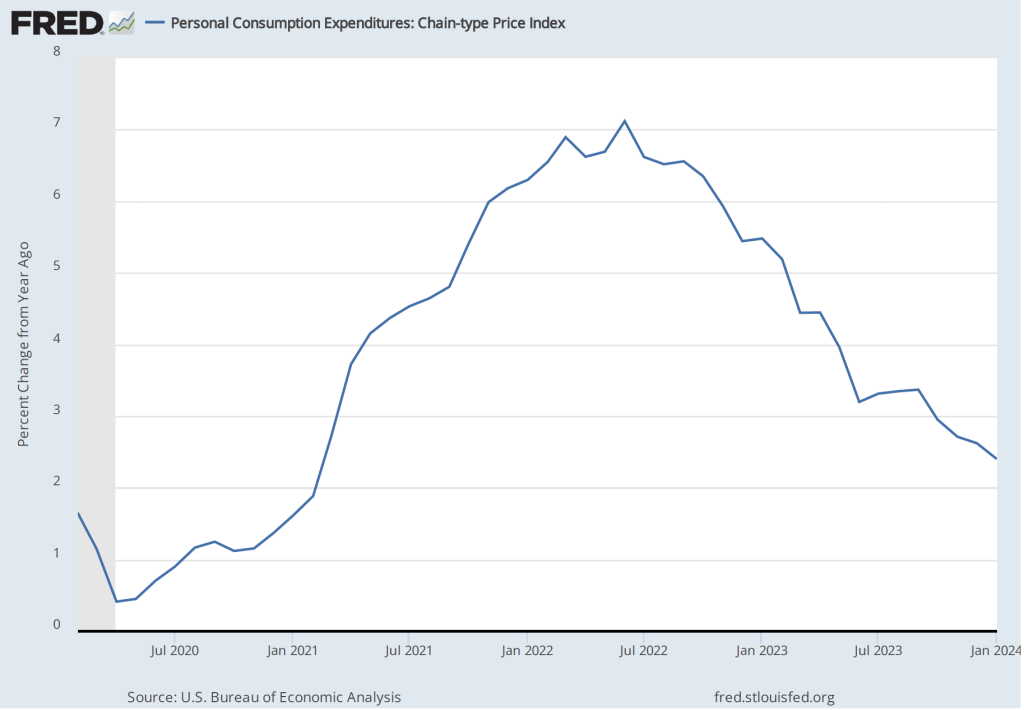
As we discuss in Macroeconomics, Chapter 15, Section 15.5 (Economics, Chapter 25, Section 25.5), the Federal Reserve gauges its success in meeting its goal of an inflation rate of 2 percent using the personal consumption expenditures (PCE) price index. The following figure shows that PCE inflation followed roughly the same path as CPI inflation, although it reached a lower peak and had declined below 3 percent by November 2023. (A more detailed discussion of recent inflation data can be found in this post and in this post.)
Monetary Policy

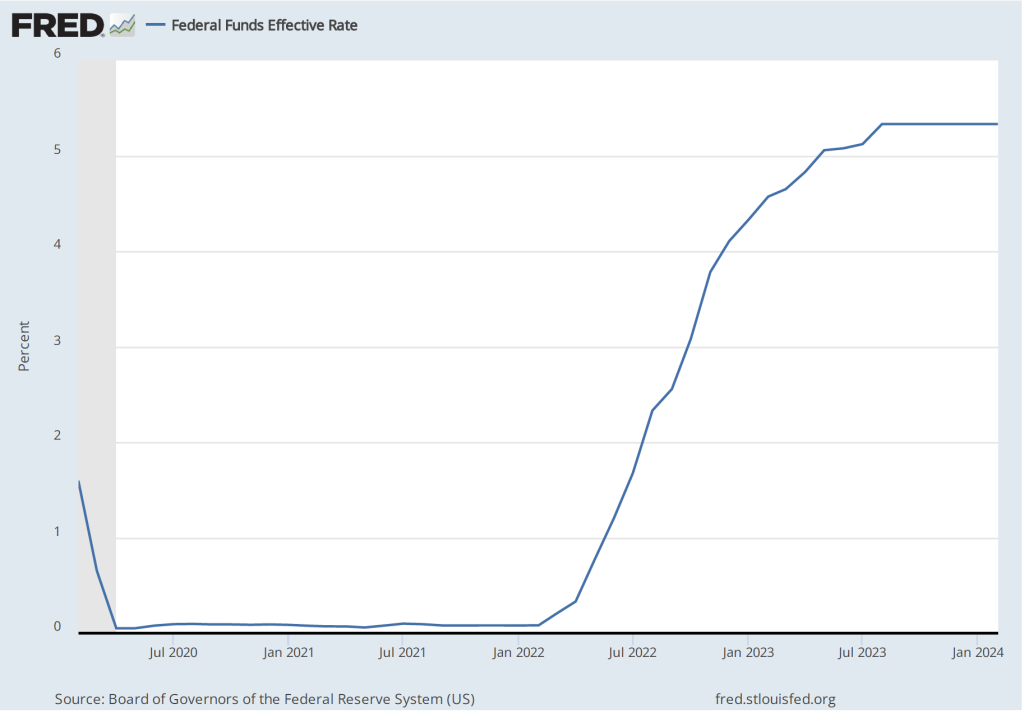
The following figure shows the effective federal funds rate, which is the rate—nearly always within the upper and lower bounds of the Fed’s target range—that prevails during a particular period in the federal funds market. In March 2020, the Fed cut its target range to 0 to 0.25 percent in response to the economic disruptions caused by the pandemic. It kept the target unchanged until March 2022 despite the sharp increase in inflation that had begun a year earlier. The members of the Federal Reserve’s Federal Open Market Committee (FOMC) had initially hoped that the surge in inflation was largely caused by disuptions to supply chains and would be transitory, falling as supply chains returned to normal. Beginning in March 2022, the FOMC rapidly increased its target range in response to continuing high rates of inflation. The targer range reached 5.25 to 5.50 percent in July 2023 where it has remained through March 2024.
 

Although the money supply is no longer the focus of monetary policy, some economists have noted that the rate of growth in the M2 measure of the money supply increased very rapidly just before the inflation rate began to accelerate in the spring of 2021 and then declined—eventually becoming negative—during the period in which the inflation rate declined.

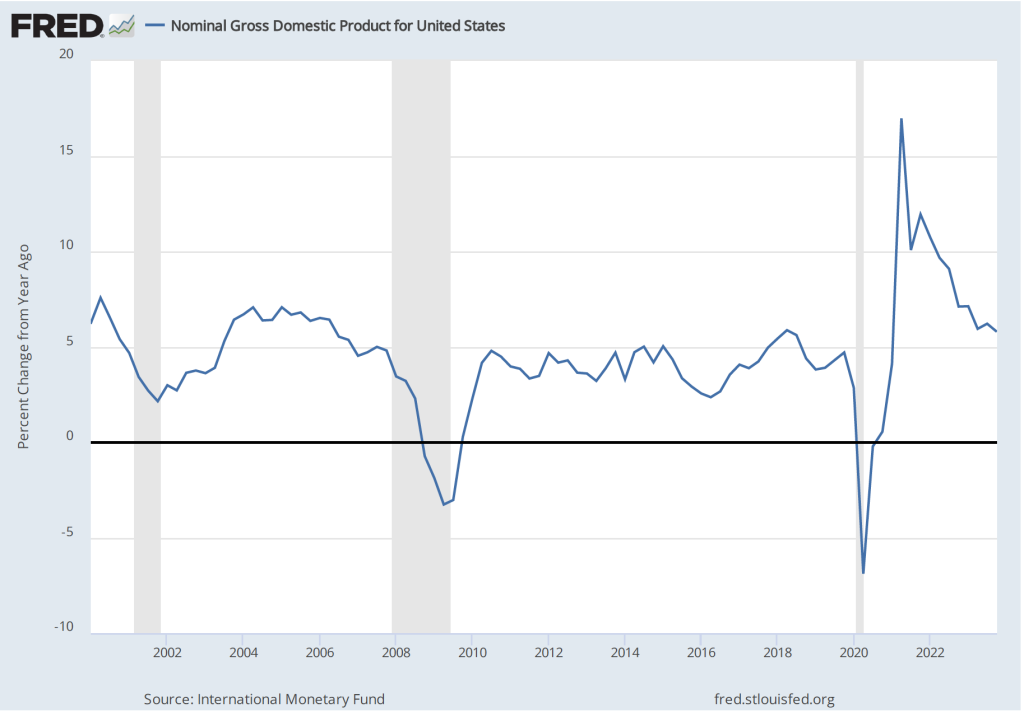
As we discuss in the new 9th edition of Macroeconomics, Chapter 15, Section 15.5 (Economics, Chapter 25, Section 25.5), some economists believe that the FOMC should engage in nominal GDP targeting. They argue that this approach has the best chance of stabilizing the growth rate of real GDP while keeping the inflation rate close to the Fed’s 2 percent target. The following figure shows the economy experienced very high rates of inflation during the period when nominal GDP was increasing at an annual rate of greater than 10 percent and that inflation declined as the rate of nominal GDP growth declined toward 5 percent, which is closer to the growth rates seen during the 2000s. (This figure begins in the first quarter of 2000 to put the high growth rates in nominal GDP of 2021 and 2022 in context.)
Fiscal Policy

As we discuss in the new 9th edition of Macroeconomics, Chapter 15 (Economics, Chapter 25), in response to the Covid pandemic Congress and Presidents Trump and Biden implemented the largest discretionary fiscal policy actions in U.S. history. The resulting increases in spending are reflected in the two spikes in federal government expenditures shown in the following figure.

The initial fiscal policy actions resulted in an extraordinary increase in federal expenditures of $3.69 trillion, or 81.3 percent, from the first quarter to the second quarter of 2020. This was followed by an increase in federal expenditures of $2.31 trillion, or 39.4 percent, from the fourth quarter of 2020 to the first quarter of 2021. As we recount in the text, there was a lively debate among economists about whether these increases in spending were necessary to offest the negative economic effects of the pandemic or whether they were greater than what was needed and contributed substantially to the sharp increase in inflation that began in the spring of 2021.

Saving

As a result of the fiscal policy actions of 2020 and 2021, many households received checks from the federal government. In total, the federal government distributed about $80o billion directly to households. As the figure shows, one result was to markedly increase the personal saving rate—measured as personal saving as a percentage of disposable personal income—from 6.4 percent in December 2019 to 22.0 in April 2020. (The figure begins in January 2020 to put the size of the spike in the saving rate in perspective.) 
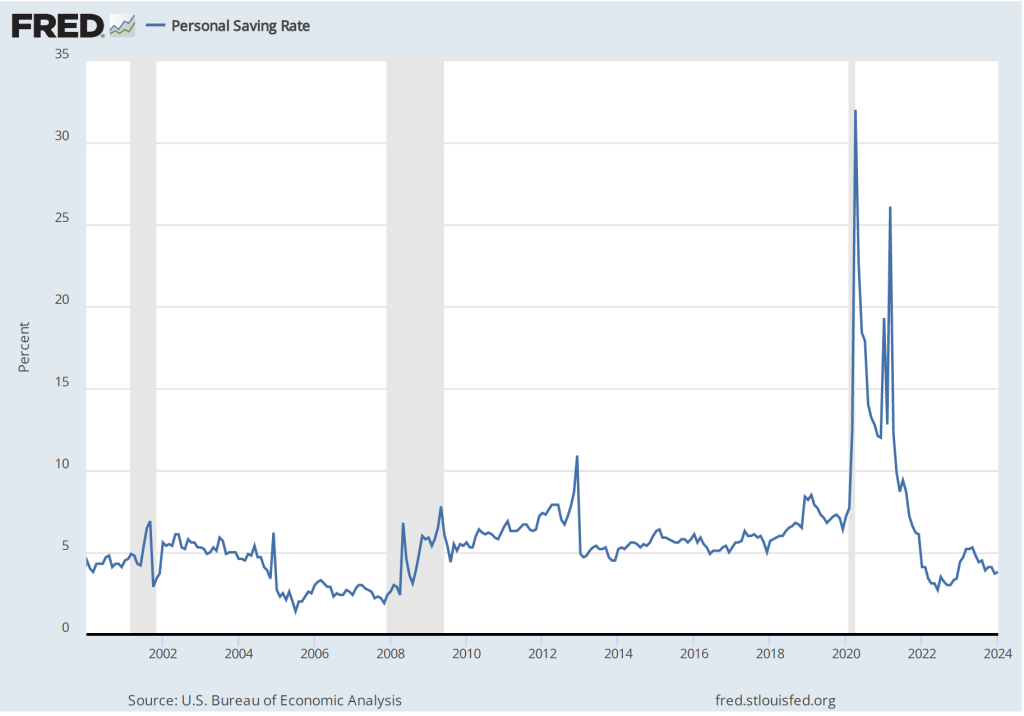
The rise in the saving rate helped households maintain high levels of consumption spending, particularly on consumer durables such as automobiles. The first of the following figure shows real personal consumption expenditures and the second figure shows real personal consumption expenditures on durable goods.

Taken together, these data provide an overview of the momentous macroeconomic events of the past four years.

Another Mixed Inflation Report

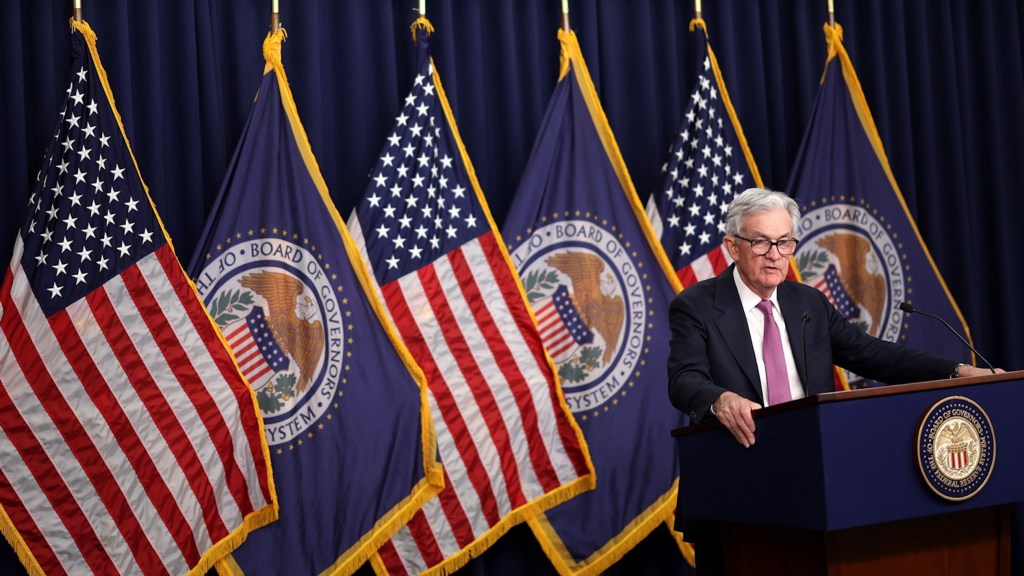
Fed Chair Jerome Powell and Fed Vice-Chair Philip Jefferson this summer at the Fed conference in Jackson Hole, Wyoming. (Photo from the AP via the Washington Post.)

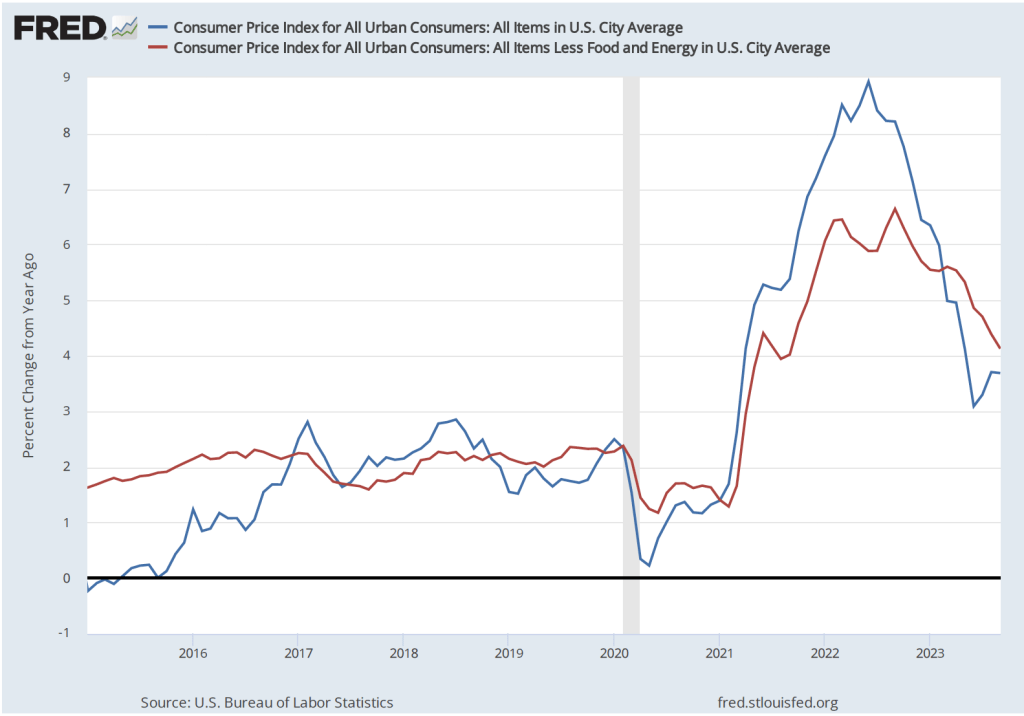
This morning, the Bureau of Labor Statistics (BLS) released its report on the consumer price index (CPI) for September. (The full report can be found here.) The report was consistent with other recent data showing that inflation has declined markedly from its summer 2022 highs, but appears, at least for now, to be stuck in the 3 percent to 4 percent range—well above the Fed’s 2 percent inflation target. 

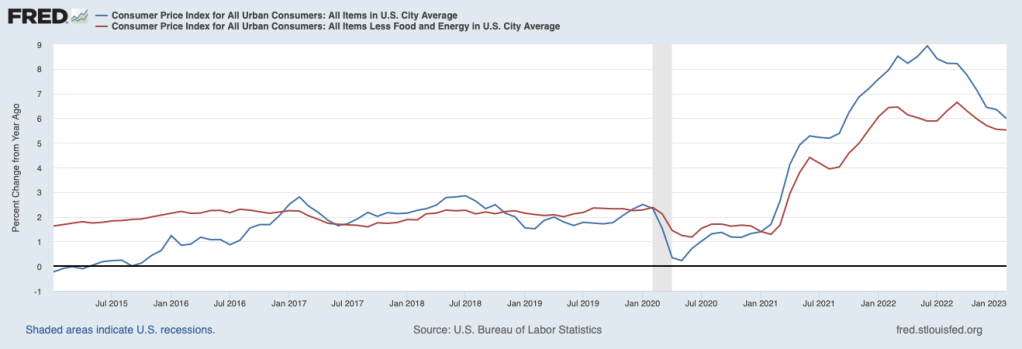
The report indicated that the CPI rose by 0.4 percent in September, which was down from 0.6 percent in August. Measured by the percentage change from the same month in the previous year, the inflation rate was 3.7 percent, the same as in August. Core CPI, which excludes the prices of food and energy, increased by 4.1 percent in September, down from 4.4 percent in August. The following figure shows inflation since 2015 measured by CPI and core CPI.

Reporters Gabriel Rubin and Nick Timiraos, writing in the Wall Street Journal summarized the prevailing interpretation of this report:

“The latest inflation data highlight the risk that without a further slowdown in the economy, inflation might settle around 3%—well below the alarming rates that prompted a series of rapid Federal Reserve rate increases last year but still above the 2% inflation rate that the central bank has set as its target.”

As we discuss in this blog post, some economists and policymakers have argued that the Fed should now declare victory over the high inflation rates of 2022 and accept a 3 percent inflation rate as consistent with Congress’s mandate that the Fed achieve price stability. It seems unlikely that the Fed will follow that course, however. Fed Chair Jerome Powell ruled it out in a speech in August: “It is the Fed’s job to bring inflation down to our 2 percent goal, and we will do so.”

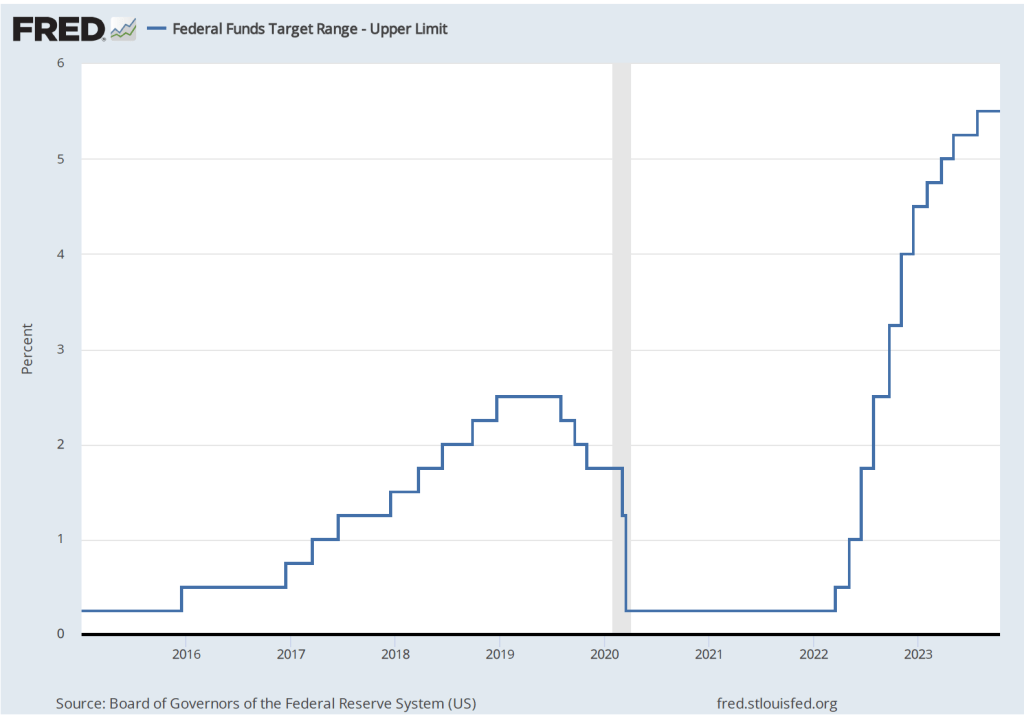
To achieve its goal of bringing inflation back to its 2 percent targer, it seems likely that economic growth in the United States will have to slow, thereby reducing upward pressure on wages and prices. Will this slowing require another increase in the Federal Open Market Committe’s target range for the federal funds rate, which is currently 5.25 to 5.50 percent? The following figure shows changes in the upper bound for the FOMC’s target range since 2015.

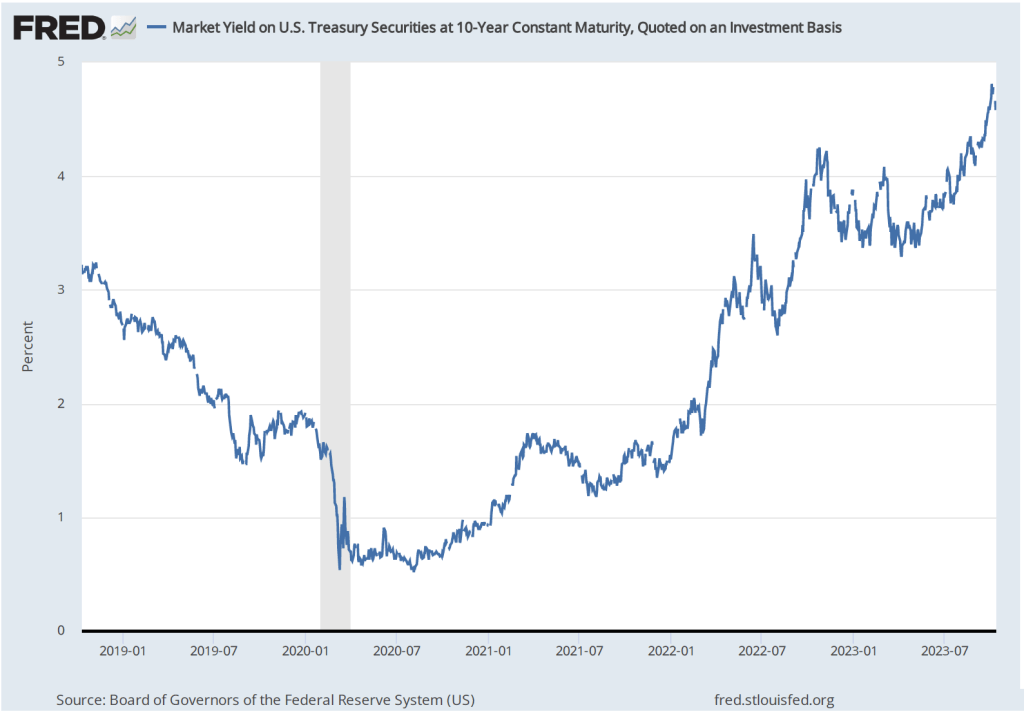
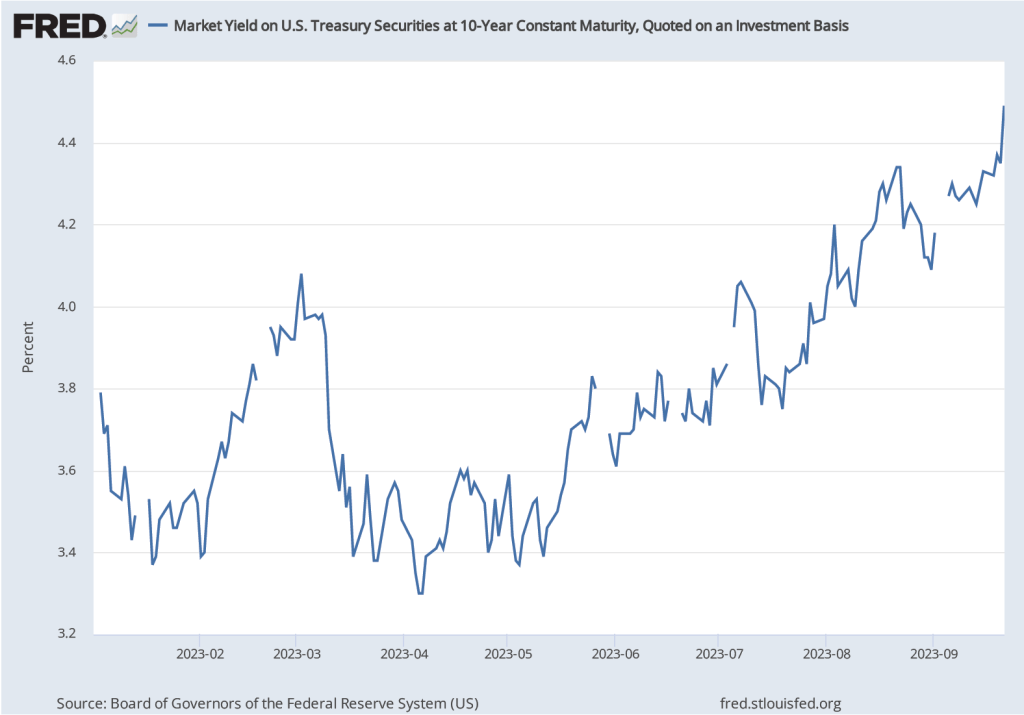
Several members of the FOMC have raised the possibility that financial markets may have already effectively achieved the same degree of policy tightening that would result from raising the target for the federal funds rate. The interest rate on the 10-year Treasury note has been steadily increasing as shown in the following figure. The 10-year Treasury note plays an important role in the financial system, influencing interest rates on mortgages and corporate bonds. In fact, the main way in which monetary policy works is for the FOMC’s increases or decreases in its target for the federal funds rate to result in increases or decreases in long-run interest rates. Higher long-run interest rates typically result in a decline in spending by consumrs on new housing and by businesses on new equipment, factories computers, and software.

Federal Reserve Bank of Dallas President Lorie Logan, who serves on the FOMC, noted in a speech that “If long-term interest rates remain elevated … there may be less need to raise the fed funds rate.” Similarly, Fed Vice-Chair Philip Jefferson stated in a speech that: “I will remain cognizant of the tightening in financial conditions through higher bond yields and will keep that in mind as I assess the future path of policy.”

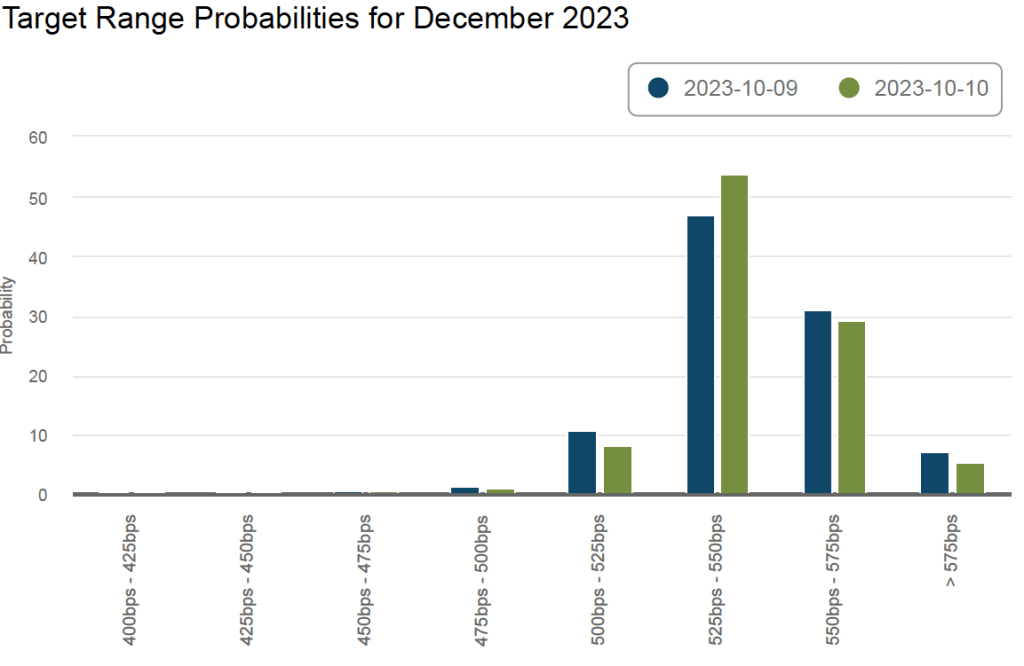
The FOMC has two more meetings scheduled for 2023: One on October 31-November 1 and one on December 12-13. The following figure from the web site of the Federal Reserve Bank of Atlanta shows financial market expectations of the FOMC’s target range for the federal funds rate in December. According to this estimate, financial markets assign a 35 percent probability to the FOMC raising its target for the federal funds rate by 0.25 or more. Following the release of the CPI report, that probability declined from about 38 percent. That change reflects the general expectation that the report didn’t substantially affect the likelihood of the FOMC raising its target for the federal funds rate again by the end of the year.

The Fed Throws Wall Street a Curveball

A trader on the New York Stock Exchange listtening to Fed Chair Jerome Powell (from Reuters via the New York Times)

Accounting for movements in the market prices of stocks and bonds is not an exact exercise. Accounts in the Wall Street Journal and on other business web sites often attribute movements in stock and bond prices to the Fed having acted in a way that investors didn’t expect. 

The decision by the Fed’s Federal Open Market Committee (FOMC) at its meeting on September 20-21, 2023 to hold its target for the federal funds rate constant at a range of 5.25 percent to 5.50 percent wasn’t a surprise. Fed Chair Jerome Powell had signaled during his press conference on July 26 following the FOMC’s previous meeting that the FOMC was likely to pause further increases in the federal funds rate target. (A transcript of Powell’s July 26 press conference can be found here.)

In advance of the September meeting, some other members of the FOMC had also signaled that the committee was unlikely to increase its target. For instance, an article in the Wall Street Journal quoted Susan Collins, president of the Federal Reserve Bank of Boston, as stating that: “The risk of inflation staying higher for longer must now be weighed against the risk that an overly restrictive stance of monetary policy will lead to a greater slowdown than is needed to restore price stability.” And in a speech in August, Raphael Bostic, president of the Federal Reserve Bank of Atlanta, explained his position on future rate increases: “Based on current dynamics in the macroeconomy, I feel policy is appropriately restrictive. I think we should be cautious and patient and let the restrictive policy continue to influence the economy, lest we risk tightening too much and inflicting unnecessary economic pain.”

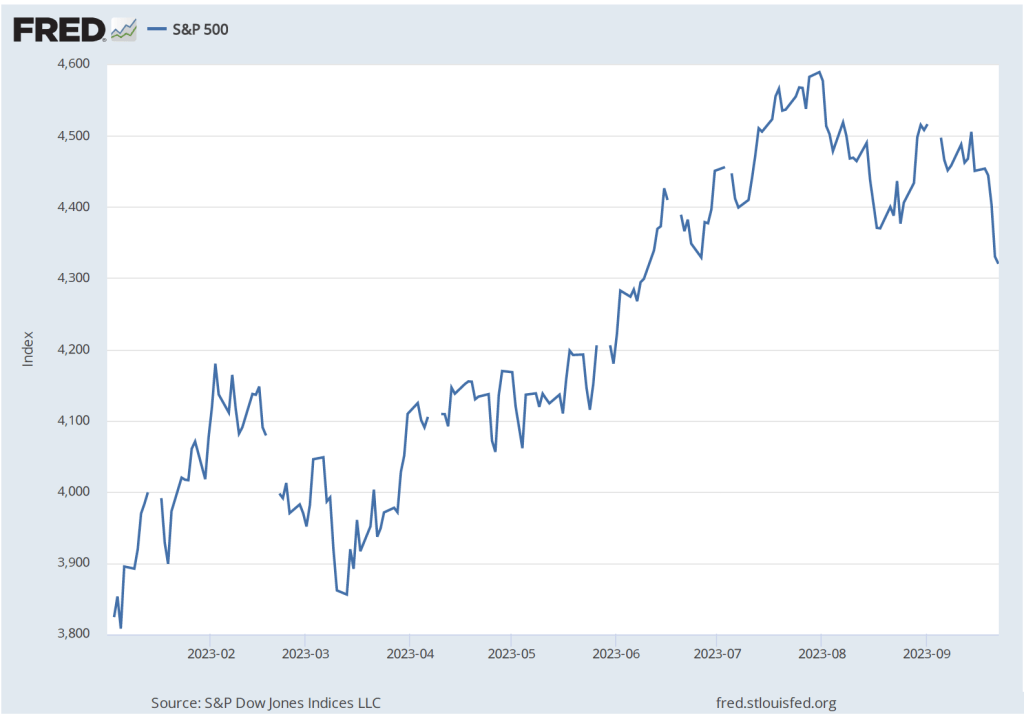
Although it wasn’t a surprise that the FOMCdecided to hold its target for the federal funds rate constant, after the decision was announced, stock and bond prices declined. The following figure shows the S&P 500 index of stock prices. The index declined 2.8 percent from September 19—the day before the FOMC meeting—to September 22—two days after the meeting. (We discuss indexes of stock prices in Macroeconomics, Chapter 6, Section 6.2; Economics, Chapter 8, Section 8.2; and Essentials of Economics, Chapter 8, Section 8.2.)

We see a similar pattern in the bond market. Recall that when the price of bonds declines in the bond market, the interest rates—or yields—on the bonds increase. As the following figure shows, the interest rate on the 10-year Treasury note rose from 4.37 percent on September 19 to 4.49 percent on September 21. The 10-year Treasury note plays an important role in the financial system, influencing interest rates on mortgages and corporate bonds. So, the yield on the 10-year Treasury note increasing from 3.3 percent in the spring of 2023 to 4.5 percent following the FOMC meeting has the effect of increasing long-term interest rates throughout the U.S. economy.

What explains the movements in the prices of stocks and bonds following the September FOMC meeting? Investors seem to have been surprised by: 1) what Chair Powell had to say in his news conference following the meeting; and 2) the committee members’ Summary of Economic Projections (SEP), which was released after the meeting.

Powell’s remarks were interpreted as indicating that the FOMC was likely to increase its target for the federal funds rate at least once more in 2023 and was unlikely to cut its target before late 2024. For instance, in response to a question Powell said: “We need policy to be restrictive so that we can get inflation down to target. Okay. And we’re going to need that to remain to be the case for some time.” Investors often disagree in their interpretations of what a Fed chair says. Fed chairs don’t act unilaterally because the 12 voting members of the FOMC decide on the target for the federal funds rate. So chairs tend to speak cautiously about future policy. Still, their seemed to be a consensus among investors that Powell was indicating that Fed policy would be more restrictive (or contractionary) than had been anticipated prior to the meeting.

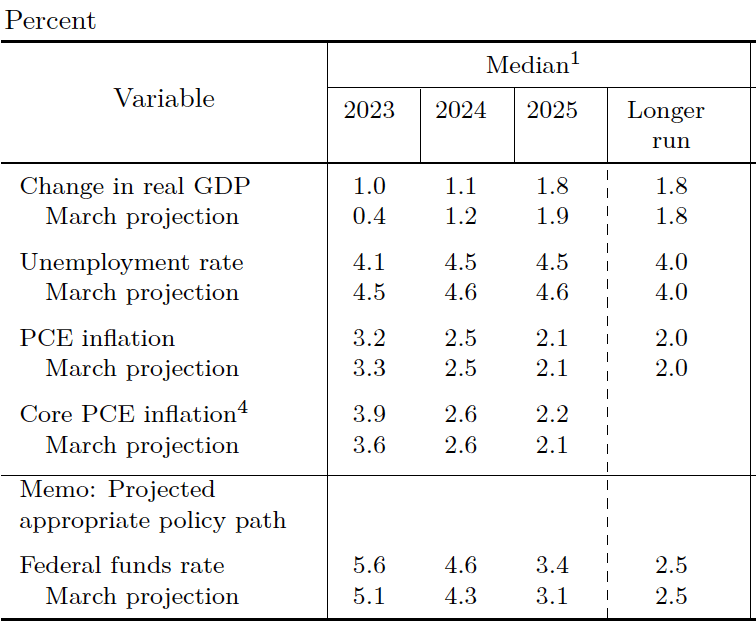
The FOMC releases the SEP four times per year. The most recent SEP before the September meeting was from the June meeting. The table below shows the median of the projections, or forecasts, of key economic variables made by the members of the FOMC at the June meeting. Note the second row from the bottom, which shows members’ median forecast of the federal funds rate.

The following table shows the median values of members’ forecast at the September meeting. Look again at the next to last row. The members’ forecast of the federal funds rate at the end of 2023 was unchanged. But their forecasts for the federal funds rate at the end of 2024 and 2025 were both 0.50 percent higher.

Why were members of the FOMC signaling that they expected to hold their target for the federal funds rate higher for a longer period? The other economic projections in the tables provide a clue. In September, the members expected that real GDP growth would be higher and the unemployment rate would be lower than they had expected in June. Stronger economic growth and a tighter labor market seemed likely to require them to maintain a contractionary monetary policy for a longer period if the inflation rate was to return to their 2.0 percent target. Note that the members didn’t expect that the inflation rate would return to their target until 2026.

Is a Soft Landing More Likely Now?

Photo from the Wall Street Journal.

The Federal Reserve’s goal has been to end the current period of high inflation by bringing the economy in for a soft landing—reducing the inflation rate to closer to the Fed’s 2 percent target while avoiding a recession. Although Fed Chair Jerome Powell has said repeatedly during the last year that he expected the Fed would achieve a soft landing, many economists have been much more doubtful.

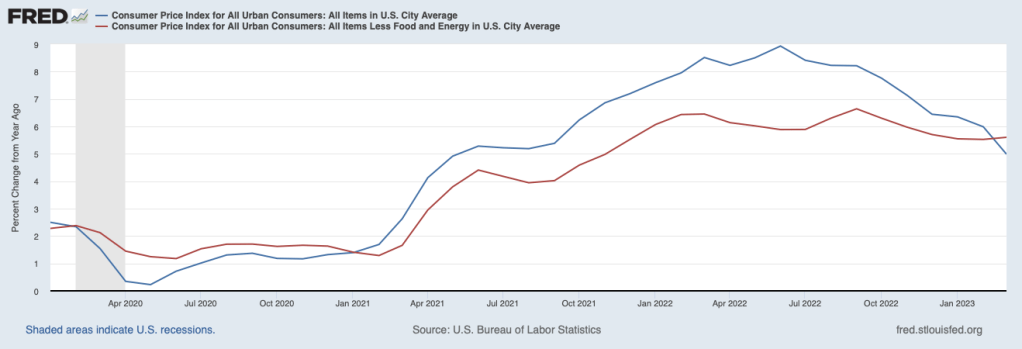
It’s possible to read recent economic data as indicating that it’s more likely that the economy is approaching a soft landing, but there is clearly still a great deal of uncertainty. On April 12, the Bureau of Labor Statistics released the latest CPI data. The figure below shows the inflation rate as measured by the CPI (blue line) and by core CPI—which excludes the prices of food and fuel (red line). In both cases the inflation rate is the percentage change from the same month in the previous year. 

The inflation rate as measured by the CPI has been trending down since it hit a peak of 8.9 percent in June 2022. The inflation rate as measured by core CPI has been trending down more gradually since it reached a peak of 6.6 percent in September 2022. In March, it was up slightly to 5.6 percent from 5.5 percent in February.

As the following figure shows, payroll employment while still increasing, has been increasing more slowly during the past three months—bearing in mind that the payroll employment data are often subject to substantial revisions. The slowing growth in payroll employment is what we would expect with a slowing economy. The goal of the Fed in slowing the economy is, of course, to bring down the inflation rate. That payroll employment is still growing indicates that the economy is likely not yet in a recession.

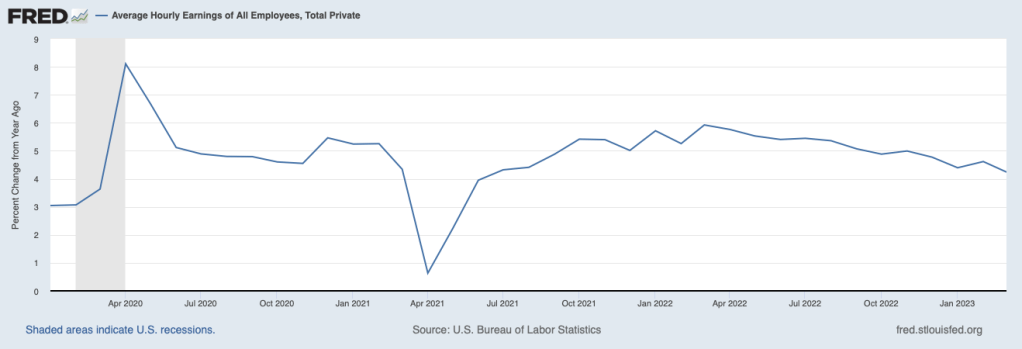
The slowing in employment growth has been matched by slowing wage growth, as measured by the percentage change in average hourly earnings. As the following figure shows, the rate of increase in average hourly earnings has declined from 5.9 percent in March 2022 to 4.2 percent in March 2023. This decline indicates that businesses are experiencing somewhat lower increases in their labor costs, which may pass through to lower increases in prices.

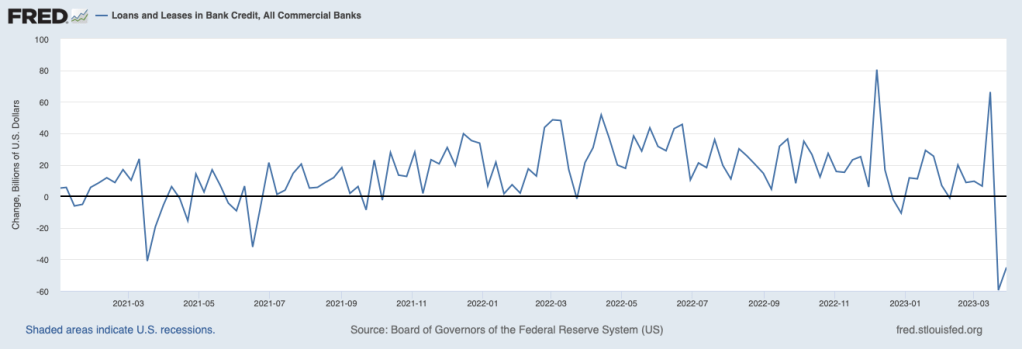
Credit conditions also indicate a slowing economy As the following figure shows, bank lending to businesses and consumers has declined sharply, partly because banks have experienced an outflow of deposits following the failure of Silicon Valley and Signature Banks and partly because some banks have raised their requirements for households and firms to qualify for loans in anticipation of the economy slowing. In a slowing economy, households and firms are more likely to default on loans. To the extent that consumers and businesses also anticipate the possibility of a recession, they may have reduced their demand for loans.

But such a sharp decline in bank lending may also be an indication that the economy is not just slowing, on its way to a making a soft landing, but is on the verge of a recession. The minutes of the March meeting of the Federal Open Market Committee (FOMC) included the information that the FOMC’s staff economists forceast “at the time of the March meeting included a mild recession starting later this year, with a recovery over the subsequent two years.” (The minutes can be found here.) The increased chance of a recession was attributed largely to “banking and financial conditions.”

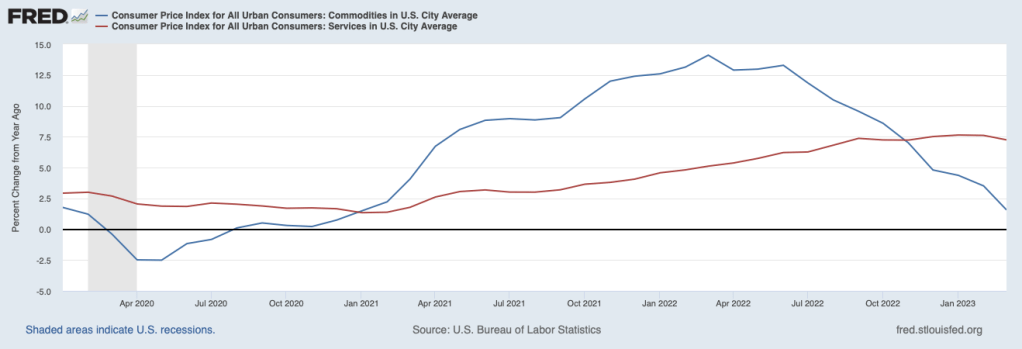
At its next meeting in May, the FOMC will have to decide whether to once more increase its target range for the federal funds rate. The target range is currently 4.75 percent to 5.00 percent. The FOMC will have to decide whether inflation is on a course to fall back to the Fed’s 2 percent target or whether the FOMC needs to further slow the economy by increasing its target range for the federal funds rate. One factor likely to be considered by the FOMC is, as the following figure shows, the sharp difference between the inflation rate in prices of goods (blue line) and the inflation rate in prices of services (red line).

During the period from January 2021 to November 2022, inflation in goods was higher—often much higher—than inflation in services. The high rates of inflation in goods were partly the result of disruptions to supply chains resulting from the Covid-19 pandemic and partly due to a surge in demand for goods as a result of very expansionary fiscal and monetary policies. Since November 2022, inflation in the prices of services has remained high, while inflation in the prices of goods has continued to decline. In March, goods inflation was only 1.6 percent, while services inflation was 7.2 percent. In his press conference following the last FOMC meeting, Fed Chair Jerome Powell stated that as long as services inflation remains high “it would be very premature to declare victory [over inflation] or to think that we’ve really got this.” (The transcript of Powell’s news conference can be found here.) This statement coupled with the latest data on service inflation would seem to indicate that Powell will be in favor of another 0.25 percentage point increase in the federal funds rate target range.

The Fed’s inflation target is stated in terms of the personal consumption expenditure (PCE) price index, not the CPI. The Bureau of Economic Analysis will release the March PCE on April 28, before the next FOMC meeting. If the Fed is as closely divided as it appears to be over whether additional increases in the federal funds rate target range are necessary, the latest PCE data may prove to have a significan effect on their decision.

So—as usual!—the macroeconomic picture is murky. The economy appears to be slowing and inflation seems to be declining but it’s still difficult to determine whether the Fed will be able to bring inflation back to its 2 percent target without causing a recession.

The Fed’s Latest Dilemma: The Link between Monetary Policy and Financial Stability

AP photo from the Wall Street Journal

Congress has given the Federal Reserve a dual mandate of high employment and price stability. In addition, though, as we discuss in Macroeconomics, Chapter 15, Section 15.1 (Economics, Chapter 25, Section 25.1) and at greater length in Money, Banking, and the Financial System, Chapter 15, Section 15.1, the Fed has other goals, including the stability of financial markets and institutions. 

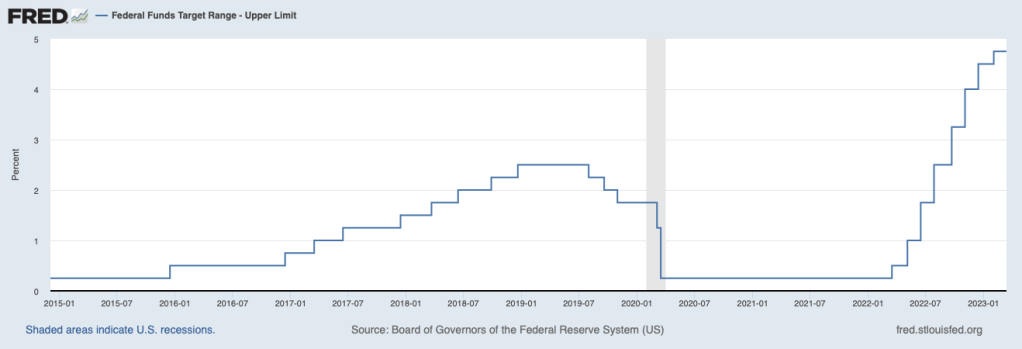
Since March 2022, the Fed has been rapidly increasing its target for the federal funds rate in order to slow the growth in aggregate demand and bring down the inflation rate, which has been well above the Fed’s target of 2 percent. (We discuss monetary policy in a number of earlier blog posts, including here and here, and in podcasts, the most recent of which (from February) can be found here.) The target federal funds rate has increased from a range of 0 percent to 0.25 percent in March 2022 to a range of 4.5 percent to 4.75 percent. The following figure shows the upper range of the target for the federal funds rate from January 2015 through March 14, 2023.

This morning (Tuesday, March 14, 2023), the Bureau of Labor Statistics (BLS) released its data on the consumer price index for February. The following figure show inflation as measured by the percentage change in the CPI from the same month in the previous year (which is the inflation measurement we use most places in the text) and as the percentage change in core CPI, which excludes prices of food and energy. (The inflation rate computed by the percentage change in the CPI is sometimes referred to as headline inflation.) The figure shows that although inflation has slowed somewhat it is still well above the Fed’s 2 percent target. (Note that, formally, the Fed assesses whether it has achieved its inflation target using changes in the personal consumption expenditures (PCE) price index rather than using changes in the CPI. We discuss issues in measuring inflation in several blog posts, including here and here.)

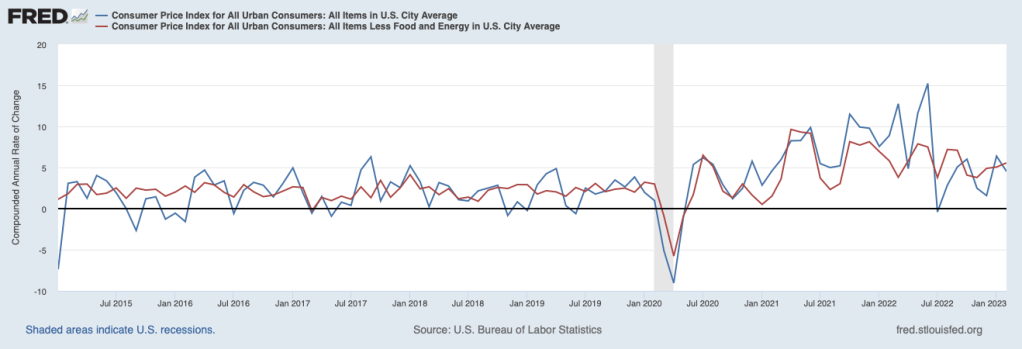
One drawback to using the percentage change in the CPI from the same month in the previous year is that it reduces the weight of the most recent observations. In the figure below, we show the inflation rate measured by the compounded annual rate of change, which is the value we would get for the inflation rate if that month’s percentage change continued for the following 12 months. Calculated this way, we get a somewhat different picture of inflation. Although headline inflation declines from January to February, core inflation is actually increasing each month from November 2022 when, it equaled 3.8 percent, through February 2023, when it equaled 5.6 percent. Core inflation is generally seen as a better indicator of future inflation than is headline inflation.

The February CPI data are consistent with recent data on PCE inflation, employment growth, and growth in consumer spending in that they show that the Fed’s increases in the target for the federal funds rate haven’t yet caused a slowing of the growth in aggregate demand sufficient to bring the inflation back to the Fed’s target of 2 percent. Until last week, many economists and Wall Street analysts had been expecting that at the next meeting of the Fed’s Federal Open Market Committee (FOMC) on March 21 and 22, the FOMC would raise its target for the federal funds rate by 0.5 percentage points to a range of 5.0 percent to 5.25 percent.

Then on Friday, the Federal Deposit Insurance Corporation (FDIC) was forced to close the Silicon Valley Bank (SVB). As the headline on a column in the Wall Street Journal put it “Fed’s Tightening Plans Collide With SVB Fallout.” That is, the Fed’s focus on price stability would lead it to continue its increases in the target for the federal funds rate. But, as we discuss in this post from Sunday, increases in the federal funds rate lead to increases in other interest rates, including the interests rates on the Treasury securities, mortgage-backed securities, and other securities that most banks own. As interest rates rise, the prices of long-term securities decline. The run on SVB was triggered in part by the bank taking a loss on the Treasury securities it sold to raise the funds needed to cover deposit withdrawals.

Further increases in the target for the federal funds rate could lead to further declines in the prices of long-term securities that banks own, which might make it difficult for banks to meet deposit withdrawals without taking losses on the securities–losses that have the potential to make the banks insolvent, which would cause the FDIC to seize them as it did SVB. The FOMC’s dilemma is whether to keep the target for the federal funds rate unchanged at its next meeting on March 21 and 22, thereby keeping banks from suffering further losses on their bond holdings, or to continue raising the target in pursuit of its mandate to restore price stability.

Some economists were urging the FOMC to pause its increases in the target federal funds rate, others suggested that the FOMC increase the target by only 0.25 percent points rather than by 0.50 percentage points, while others argued that the FOMC should implement a 0.50 increase in order to make further progress toward its mandate of price stability.

Forecasting monetary policy is a risky business, but as of Tuesday afternoon, the likeliest outcome was that the FOMC would opt for a 0.25 percentage point increase. Although on Monday the prices of the stocks of many regional banks had fallen, during Tuesday the prices had rebounded as investors appeared to be concluding that those banks were not likely to experience runs like the one that led to SVB’s closure. Most of these regional banks have many more retail deposits–deposits made be households and small local businesses–than did SVB. Retail depositors are less likely to withdraw funds if they become worried about the solvency of a bank because the depositors have much less than $250,000 in their accounts, which is the maximum covered by the FDIC’s deposit insurance. In addition, on Sunday, the Fed established the Bank Term Funding Program (BTFP), which allows banks to borrow against the holdings of Treasury and mortgage-back securities. The program allows banks to meet deposit withdrawals by borrowing against these securities rather than by having to sell them–as SVB did–and experience losses.

On March 22, we’ll find out how the Fed reacts to the latest dilemma facing monetary policy.