New Census Data Highlights the Aging of the U.S. Population

Image generated by ChatGPT 5

In June, the U.S. Census Bureau released its population estimates for 2024. Included was the following graphic showing the change in the U.S. population pyramid from 2004 to 2024. As the graphic shows, people 65 years and older have increased as a fraction of the total population, while children have decreased as a fraction of the total population. (The Census considers everyone 17 and younger to be a child.) Between 2004 and 2024, people 65 and older increased from 12.4 percent of the population to 18.0 percent. People younger than 18 fell from 25.0 percent of the population in 2004 to 21.5 percent in 2024.

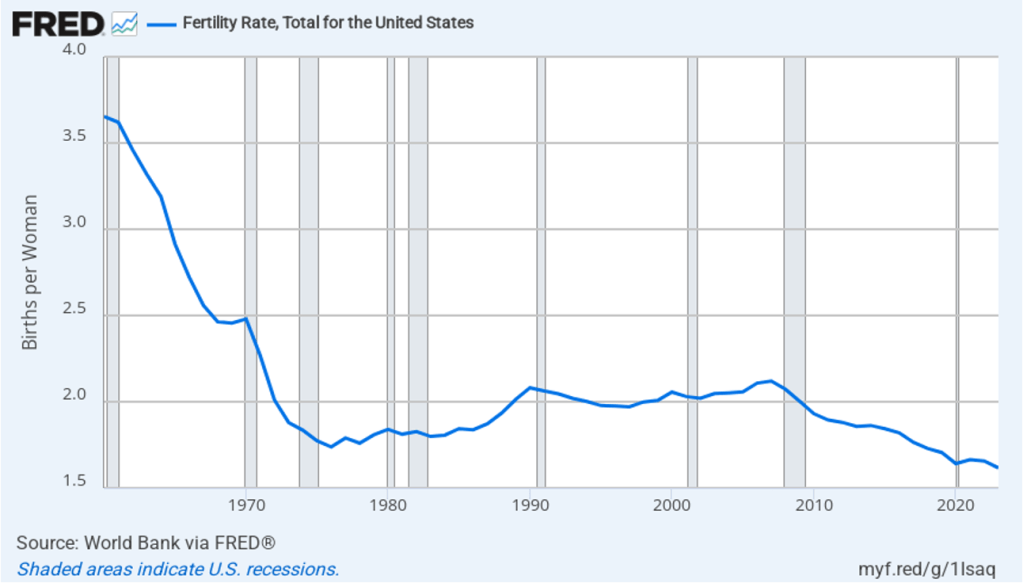
The aging of the U.S. population reflects falling birth rates. Demographers and economists typically measure birth rates as the total fertility rate (TFR), which is defined by the World Bank as: “The number of children that would be born to a woman if she were to live to the end of her childbearing years and bear children in accordance with age-specific fertility rates currently observed.” The TFR has the advantage over the simple birth rate—which is the number of live births per thousand people—because the TFR corrects for the age structure of a country’s female population. Leaving aside the effects of immigration and emigration, a TFR of 2.1 is necessary to keep a country’s population stable. Stated another way, a country needs a TFR of 2.1 to achieve replacement level fertility. A country with a TFR above 2.1 experiences long-run population growth, while a country with a TFR of less than 2.1 experiences long-run population decline.

The following figure shows the TFR for the United States for each year between 1960 and 2023. Since 1971, the TFR has been below 2.1 in every year except for 2006 and 2007. Immigration has helped to offset the effects on population growth of a TFR below 2.1.

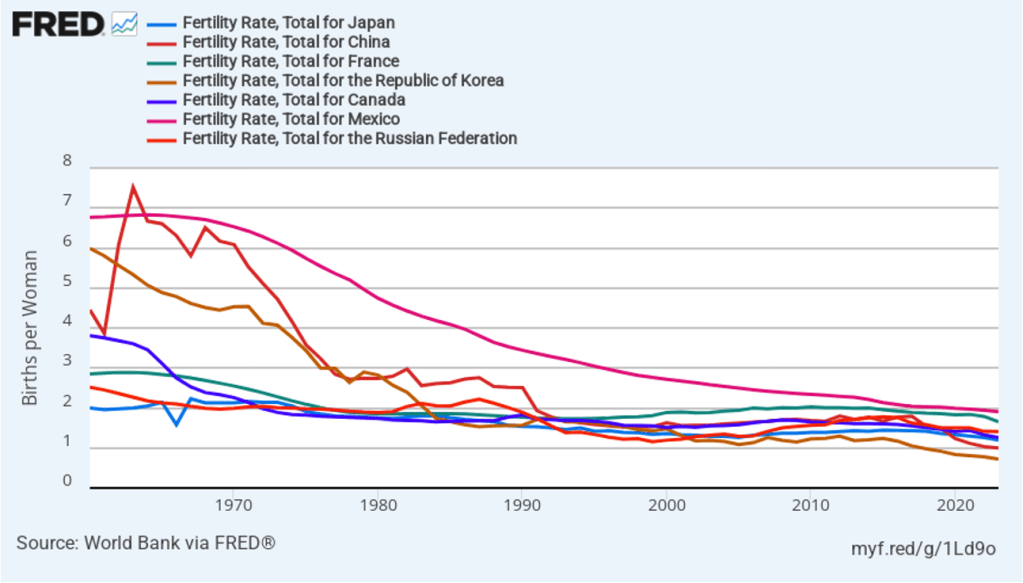
The United States is not alone in experiencing a sharp decline in its TFR since the 1960s. The following figure shows some other countries that currently have below replacement level fertility, including some countries—such as China, Japan, Korea, and Mexico—in  which TFRs were well above 5 in the 1960s. In fact, only a relatively few countries, such as Israel and some countries in sub-Saharan Africa are still experiencing above replacement level fertility.

An aging population raises the number of retired people relative to the number of workers, making it difficult for governments to finance pensions and health care for older people. We discuss this problem with respect to the U.S. Social Security and Medicare programs in an Apply the Concept in Macroeconomics, Chapter 16 (Economics, Chapter 26 and Essentials of Economics, Chapter 18). Countries experiencing a declining population typically also experience lower rates of economic growth than do countries with growing populations. Finally, as we discuss in an Apply the Concept in Microeconomics, Chapter 3, different generations often differ in the mix of products they buy. For instance, a declining number of children results in declining demand for diapers, strollers, and toys.

Data on the Economics Major

Image generated by ChatGTP-4o.

How does the number of people who majored in economics in college compare with the number of people who pursued other majors? How do the earnings of economics majors compare with the earnings of other majors? Recent data released by the Census Bureau provides some interesting answers to these and other questions about the economics major.

Each year the Census Bureau conducts the American Community Survey (ACS) by mailing a questionnaire to about 3.5 million households. The questionnaire contains 100 questions that ask about, among other things, the race, sex, age, educational attainment, employment, earnings, and health status of each person in the household.  Responses are collected online, by mail, by telephone, or by a personal visit from a census employee.

Although the Census Bureau releases some data about 1 year after the data is collected, it typically takes longer to publish detailed studies of specific topics. The ACS report on Field of Bachelor’s Degree in the United States: 2022 was released this month, although it’s based on data collected during 2022. Anyone interested in the subject will find the whole report to be worthwhile reading, but we can summarize a few of the results.

According to the census, in 2022, there were 81.9 million people in the United States aged 25 and older who had graduated from college with a bachelor’s degree. The report includes economics, along with several other social sciences—psychology, political science, and sociology—in the category of “Engineering and Science Degrees.” The following figure shows the leading majors in this category ranked by the percentage of all holders of a bachelor’s degree. (Sociology is included for comparison with the other three social sciences listed.) Psychology has the largest share of majors at 4.6 percent. Economics accounts for 2.0 percent of majors.

We can conclude that among social science majors, economics is less than half as popular as psychology, slightly less popular than political science, and significantly more popular than sociology.

Economics departments are sometimes located in undergraduate business colleges. The following figure compares economics to other majors listed in the “Business Degrees” category of the report. At nearly 6 percent of all majors, “business management and administration” is the most popular of business majors, followed by general business and accounting. “Other business,” marketing, finance, and economics are all about equally popular with around 2 percent of all majors.

The figure below shows the median annual earnings for people aged 25 years to 64 years—prime-age workers—who majored in each of fields used in the first figure above, as well as for all holders of a bachelor’s degree. People who majored in economics earn significantly more than people who majored in the other social sciences listed and 35 percent more than people in all majors.

 The next figure shows median annual earnings for economics majors compared with majors in other business fields. Perhaps surprisingly—although not to people who know the many benefits from majoring in economics!—economics majors earn more on average than do majors in other business fields.

The following figure shows how many people with bacherlor’s degrees in economics majors fall into each age group. People aged 25 years to 34 years make up 22 percent of all economics majors, the most of any of the age groups. This result indicates that the economics major has gained in popularity (although note that the age groups don’t have equal numbers of people in them).

Finally, we can look at the demographic characteristics of economics majors. The next figure shows the percentage of degree holders in some popular majors who are women. Although women hold 53 percent of all bachelor’s degrees, they hold only 33 percent of bachelor’s degrees in economics. The share for economics is lower than for the other social sciences shown, the same as for finance majors, and more than for computer science and mechanical engineering majors.

The next figure shows bachelor’s degrees in economics by race and Hispanic origin. Non-Hispanic whites and non-Hispanic Asians are overrepresented among economics majors compared with the percentages they make up of all bachelor’s degree holders. Non-Hispanic Blacks and Hispanics are underrepresented among economics majors compared with the percentages they make up of all bachelor’s degree holders. People who are multiracial or of another race hold the same percentage of economics degrees as of degrees in other subjects.

The Strikingly Large Role of Foreign-Born Workers in the Growth of the U.S. Labor Force

As we noted in a recent post on the latest jobs report, the Bureau of Labor Statistics (BLS) has updated the population estimates in its household employment survey to reflect the revised population estimates from the Census Bureau. The census now estimates that the civilian noninstitutional population was about 2.9 million larger in December 2024 than it had previously estimated. The original undercount was significantly driven by an underestimate of the increase in the immigrant population.

The following figure shows the more rapid growth of foreign-born workers in recent years in comparison with the growth in native-born workers. In the figure, we set the number of native-born workers and the number of foreign-born workers both equal to 100 in January 2007. Between January 2007 and January 2025, the number of foreign-born workers increased by 40 percent, while the number of native-born workers increased by only 6 percent.

As the following figure shows, although foreign-born workers are an increasingly larger percentage of the total labor force, native-born workers are still a large majority of the labor force. Foreign-born workers were 15.3 percent of the labor force in January 2007 and 19.5 percent of the labor force in January 2025. Foreign-born workers accounted for about 56 percent of the increase in the total labor force over the period from January 2007 to January 2025.

H/T to Jason Furman for pointing us to the BLS data.

Glenn Joins other Economists Who Have Served on the CEA in Calling for More Funding for the BLS

Image generated by GTP-4o of the U.S. Department of Labor building

The Census Bureau and the Bureau of Labor Statistics (BLS) jointly conduct the monthly Current Population Survey (CPS). As we discuss in Macroeconomics, Chapter 9, Section 9.1 (Economics, Chapter 19, Section 19.1), the BLS uses the data gathered by the CPS to calculate a number of important labor market statistics including the unemployment rate, the labor force participation rate, and the employment-population ratio.

Unfortunately, over the years Congress has not increased its appropriations for the BLS enough to cover the increasing costs of surveying 60,000 households each month. As a result, the BLS has announced that beginning in January 2025, it will be surveying fewer households in each month’s CPS.

Glenn has joined 120 other economists who have served over the years on the President’s Council of Economic Advisers (CEA) in writing a letter to Congress urging that the BLS be given sufficient funds to maintain the current size of the CPS sample and to begin steps to modernize the collection of the sample.

The letter notes that: “Reducing the CPS sample size will make its statistics less reliable…. will also hinder accurate analysis of states and local areas and subpopulations, including teenagers, seniors, veterans, people with disabilities, the self-employed, people who identify as Asian, Hispanic or Latino ethnicity, and Black or African Americans.”

The whole text of the letter can be read here.

The Continuing Mystery of the Slow Growth in Gross Domestic Income

A fundamental point in macroeconomics is that the value of income and the value of output or production are the same. The Bureau of Economic Analysis (BEA) measures the value of the U.S. economy’s production with gross domestic product (GDP) and the value of total income with gross domestic income (GDI). The two numbers are designed to be equal but because they are compiled from different data, the numbers can diverge. (We discuss GDP and GDI in the Apply the Connection “Was There a Recession during 2022? Gross Domestic Product versus Gross Domestic Income” in Macroeconomics, Chapter 8, Section 8.4 (Economics Chapter 18, Section 18.4).)

The figure above shows that in the past two years the growth rate of real GDP (the green line in the figure) has been significantly different—significantly higher—than the growth rate of GDI (the blue line). Both growth rates are measured as the percentage change from the same quarter in the previous year. Until the fourth quarter of 2022, the two growth rates were roughly similar over the period shown. But for the four quarters beginning in the fourth quarter of 2022, real GDI was flat with a growth rate of 0.0 percent, while real GDP grew at an average annual rate of 1.9 percent during that period. From the fourth quarter of 2023 through the second quarter of 2024, real GDI grew, but at an average annual rate of 1.8 percent, while real GDP was growing at a rate of 3.1 percent. (Some economists prefer to average the growth rates of GDP and GDI, which we show with the red line in the figure.)

In other words, judging by growth in real GDI, the U.S. economy was experiencing something between stagnation and moderate growth, while judging by growth in real GDP, the U.S. economy experiencing moderate to strong growth. There can be differences between GDP and GDI because (1) the BEA uses data on wages, profits, and other types of income to measure GDI, and (2) the errors in these data can differ from the errors in data on production and spending used to estimate GDP.

Jason Furman, chair of the Council of Economic Advisers under President Barack Obama, has suggested that a surge in immigration may explain why GDI growth has lagged GDP growth. As we discuss in this blog post, the Census Bureau may have been underestimating the number of immigrants who have entered the United States in recent years. The Congressional Budget Office (CBO) estimates that there are actually 6 million more people living in the United States in 2024 than the Census Bureau estimates because the bureau has underestimated the number of immigrants.

Compared to the native-born population, immigrants are disproportionately in the prime working ages of 25 to 54 and are therefore more likely to be in the labor force. It seems plausible—although so far as we know, the point hasn’t been documented—that the value of production resulting from the work of uncounted (in the census estimates) immigrants is more likely to be included in GDP than the income they are paid is to be counted in GDI. The result could explain at least part of the discrepancy between GDP and GDI that we’ve seen in the past two years. But while this factor affects the levels of GDP and GDI, it’s not clear that it affects the growth rates of GDP and GDI. The number of uncounted immigrants would have to be increasing over time for the growth rate of GDI to be reduced relative to the growth rate of GDP.

This episode may demonstrate the need for Congress to provide the BEA staff with resources they would need to do the work required to reconcile GDP estimates with GDI estimates.

How Should the Fed Interpret the Monthly Employment Reports?

Jerome Powell arriving to testify before Congress. (Photo from Bloomberg News via the Wall Street Journal.)

Each month the Bureau of Labor Statistics (BLS) releases its “Employment Situation” report. As we’ve discussed in previous blog posts, discussions of the report in the media, on Wall Street, and among policymakers center on the estimate of the net increase in employment that the BLS calculates from the establishment survey.  

How should the members of the Fed’s policy-making Federal Open Market Committee interpret these data? For instance, the BLS reported that the net increases in employment in June was 206,000. (Always worth bearing in mind that the monthly data are subject to—sometimes substantial—revisions.) Does a net increase of employment of that size indicate that the labor market is still running hot—with the quantity of labor demanded by businesses being greater than the quantity of labor workers are supplying—or that the market is becoming balanced with the quantity of labor demanded roughly equal to the quantity of labor supplied?

On July 9, in testimony before the Senate Banking Committee indicated that his interpretation of labor market data indicate that: “The labor market appears to be fully back in balance.”  One interpretation of the labor market being in balance is that the number of net new jobs the economy creates is enough to keep up with population growth. In recent years, that number has been estimated to be 70,000 to 100,000. The number is difficult to estimate with precision for two main reasons:

  1. There is some uncertainty about the number of older workers who will retire. The more workers who retire, the fewer net new jobs the economy needs to create to accommodate population growth. 
  2. More importantly, estimates of population growth are uncertain, largely because of disagreements among economists and demographers over the number of immigrants who have entered the United States in recent years.

In calculating the unemployment rate and the size of the labor force, the BLS relies on estimates of population from the Census Bureau. In a January report, the Congressional Budget Office (CBO) argued that the Census Bureau’s estimate of the population of the United States is too low by about 6 million people. As the following figure from the CBO report indicates, the CBO believes that the Census Bureau has underestimated how much immigration has occurred and what the level of immigration is likely to be over the next few years. (In the figure, SSA refers to the Social Security Administration, which also makes forecasts of population growth.)

Some economists and policymakers have been surprised that low levels of unemployment and large monthly increases in employment have not resulted in greater upward pressure on wages. If the CBO’s estimates are correct, the supply of labor has been increasing more rapidly than is indicated by census data, which may account for the relative lack of upward pressure on wages. If the CBO’s estimates of population growth are correct, a net increase in employment of 200,000, as occured in June, may be about the number necessary to accommodate growth in the labor force. In other words, Chair Powell would be correct that the labor market was in balance in June.

In a recent publication, economists Nicolas Petrosky-Nadeau and Stephanie A. Stewart of the Federal Reserve Bank of San Francisco look at a related concept: breakeven employment growth—the rate of employment growth required to keep the unemployment rate unchanged. They estimate that high rates of immigration during the past few years have raised the rate of breakeven employment growth from 70,000 to 90,000 jobs per month to 230,000 jobs per month. This analysis would be consistent with the fact that as net employment increases have averaged 177,000 over the past three months—somewhat below their estimate of breakeven employment growth—the unemployment rate has increased from 3.8 percent to 4.1 percent.

Another Surprisingly Strong Employment Report

Photo from Reuters via the Wall Street Journal.

On Friday, April 5—the first Friday of the month—the Bureau of labor Statistics (BLS) released its “Employment Situation” report with data on the state of the labor market in March. The BLS reported a net increase in employment during March of 303,000, which was well above the increase that economists had been expecting. The previous estimates of employment in January and February were revised upward by 22,000 jobs. (We also discuss the employment report in this podcast.)

Employment increases during the second half of 2023 had slowed compared with the first half of the year. But, as the following figure from the BLS report shows, since December 2023, employment has increased by more than 250,000 in each month. These increases are far above the estimated increases of 70,000 to 100,000 new jobs needed to keep up with population growth. (But note our later discussion of this point.)

The unemployment rate had been expected to stay steady at 3.9 percent, but declined slightly to 3.8 percent. As the following figure shows, the unemployment rate has been remarkably stable for more than two years and has been below 4.0 percent each month since December 2021. The members of the Federal Open Market Committee (FOMC) expect that the unemployment rate for 2024 will be 4.0 percent, a forcast that is beginning to seem too high.

The monthly employment number most commonly reported in media accounts is from the establishment survey (sometimes referred to as the payroll survey), whereas the unemployment rate is taken from the household survey. The results of both surveys are included in the BLS’s monthly “Employment Situation” report. As we discuss in Macroeconomics, Chapter 9, Section 9.1 (Economics, Chapter 19, Section 19.1), many economists and policymakers at the Federal Reserve believe that employment data from the establishment survey provides a more accurate indicator of the state of the labor market than do either the employment data or the unemployment data from the household survey.

As we noted in a previous post, whereas employment as measured by the establishment survey has been increasing each month, employment as measured by the household surve declined each month from December 2023 through February 2024. But, as the following figure shows, this trend was reversed in March, with employment as measured by the household survey increasing 498,000—far more than the 303,000 increase in employment in establishment survey. This reversal may be another indication of the underlying strength of the labor market.

As the following figure shows, despite the substantial increases in employment, wages, as measured by the percentage change in average hourly earnings from the same month in the previous year, have been trending down. The increase in average hourly earnings declined from 4.3 percent February in to 4.1 percent in March.

The following figure shows wage inflation calculated by compounding the current month’s rate over an entire year. (The figure above shows what is sometimes called 12-month wage inflation, whereas this figure shows 1-month wage inflation.) One-month wage inflation is much more volatile than 12-month inflation—note the very large swings in 1-month wage inflation in April and May 2020 during the business closures caused by the Covid pandemic.

Wages increased by 6.1 percent in January 2024, 2.1 percent in February, and 4.2 percent in March. So, the 1-month rate of wage inflation did show an increase in March, although it’s unclear whether the increase was a result of the strength of the labor market or reflected the greater volatility in wage inflation when calculated this way.

Some economists and policymakers are surprised that low levels of unemployment and large monthly increases in employment have not resulted in greater upward pressure on wages. One possibility is that the supply of labor has been increasing more rapidly than is indicated by census data. In a January report, the Congressional Budget Office (CBO) argued that the Census Bureau’s estimate of the population of the United States is too low by about 6 million people. This undercount is attributable, according to the CBO, largely the Census Bureau having underestimated the amount of immigration that has occurred. If the CBO is correct, then the economy may need to generate about 200,000 net new jobs each month to accommodate the growth of the labor force, rather than the 80,000 to 100,000 we mentioned earlier in this post.

Federal Reserve Chair Jerome Powell noted in a press conference following the most recent meeing of the FOMC that: “Strong job creation has been accompanied by an increase in the supply of workers, reflecting increases in participation among individuals aged 25 to 54 years and a continued strong pace of immigration.” As a result:

“what you would have is potentially kind of what you had last year, which is a bigger economy where inflationary pressures are not increasing. In fact, they were decreasing. So you can have that if you have a continued supply-side activity that we had last year with—both with supply chains and also with, with growth in the size of the labor force.”

If Powell is correct, in the coming months the U.S. economy may be able to sustain rapid increases in employment without those increases leading to an increase in the rate of inflation.