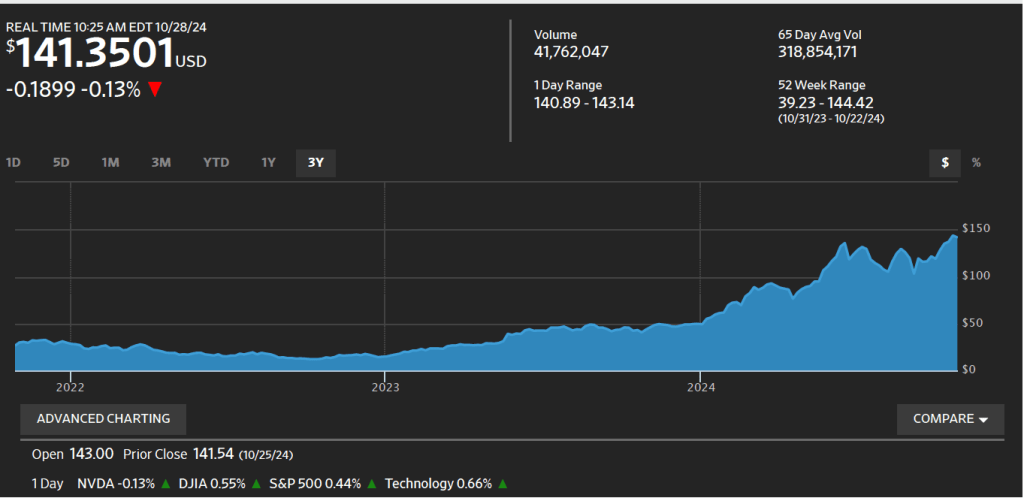
At the close of stock trading on Friday, January 24 at 4 pm EST, Nvidia’s stock had a price of $142.62 per share. When trading reopened at 9:30 am on Monday, January 27, Nvidia’s stock price plunged to $127.51. The total value of all Nvidia’s stock (the firm’s market capitalization or market cap) dropped by $589 billion—the largest one day drop in market cap in history. The following figure from the Wall Street Journal shows movements in Nvidia’s stock price over the past six months.

What happened to cause should a dramatic decline in Nvidia’s stock price? As we discuss in Macroeconomics, Chapter 6 (Economics, Chapter 8, and Money, Banking, and the Financial System, Chapter 6), Nividia’s price of $142.62 at the close of trading on January 24—like the price of any publicly traded stock—reflected all the information available to investors about the company. For the company’s stock to have declined so sharply at the beginning of the next trading day, important new information must have become available—which is exactly what happened.
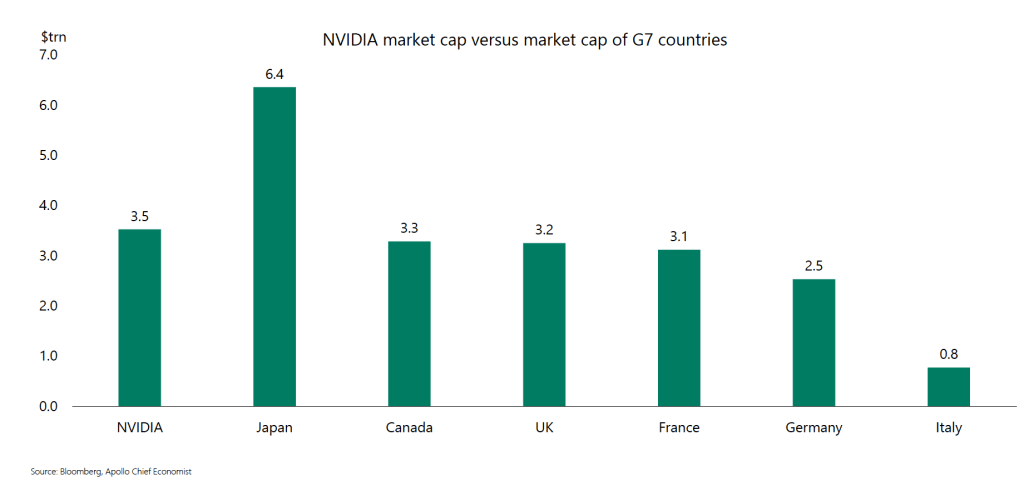
As we discussed in this blog post from last October, Nvidia has been very successful in producing state-of-the-art computer chips that power the most advanced generative artificial intelligence (AI) software. Even after Monday’s plunge in the value of its stock, Nvidia still had a market cap of nearly $3.5 trillion at the end of the day. It wasn’t news that DeepSeek, a Chinese AI company had produced AI software called R1 that was similar to ChatGTP and other AI software produced by U.S. companies. The news was that R1—the latest version of the software is called V3—appeared to be comparable in many ways to the AI software produced by U.S. firms, but had been produced by DeepSeek despite not using the state-of-the-art Nvidia chips used in those AI programs.
The Biden administration had barred export to China of the newest Navidia chips to keep Chinese firms from surging ahead of U.S. firms in developing AI. DeepSeek claimed to have developed its software using less advanced chips and have trained its software at a much lower cost than U.S. firms have been incurring to train their software. (“Training” refers to the process by which engineers teach software to be able to accurately solve problems and answer questions.) Because DeepSeek’s costs are lower, the company charges less than U.S. AI firms do to use its computer infrastructure to handle business tasks like responding to consumer inquiries.
If the claims regarding DeepSeek’s software are accurate, then AI firms may no longer require the latest Nvidia chips and may be forced to reduce the prices they can charge firms for licensing their software. The demand for electricity generation may also decline if it turns out that the demand for AI data centers, which use very large amounts of power, will be lower than expected.
But on Monday it wasn’t yet clear whether the claims being made about DeepSeek’s software were accurate. Some industry observers speculated that, despite the U.S. prohibition on exporting the latest Nvidia chips to China, DeepSeek had managed to obtain them but was reluctant to admit that it had. There were also questions about whether DeepSeek had actually spent as little as it claimed in training its software.
What happens to the price of Nvidia’s stock during the rest of the week will indicate how investors are evaluating the claims DeepSeek made about its AI software.