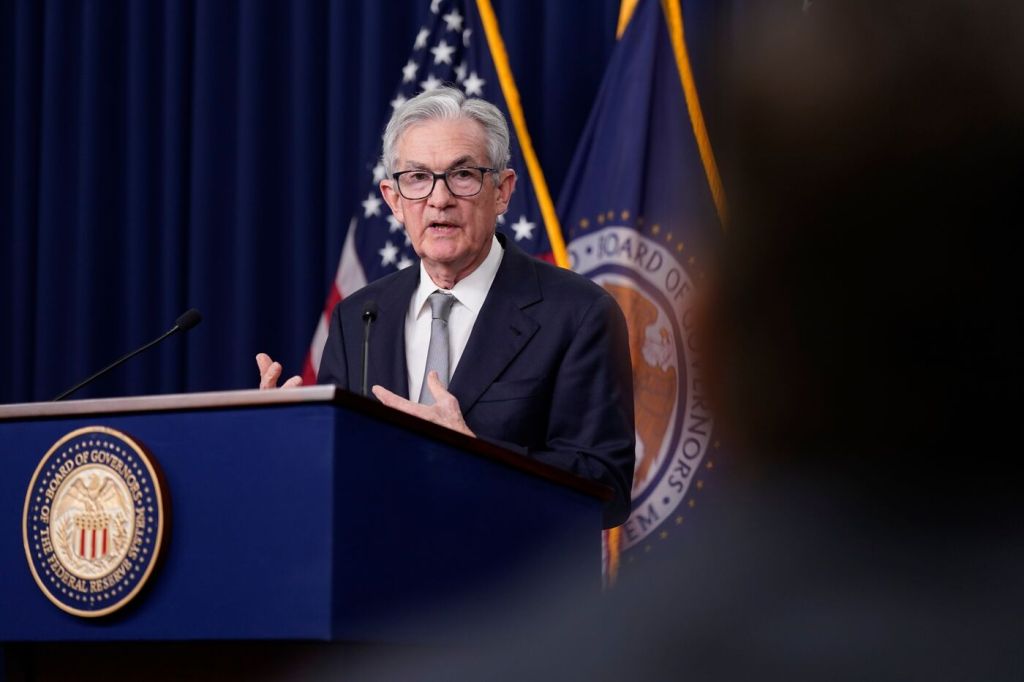
Federal Reserve Chair Jerome Powell (photo from bloomberg.com)
In a blog post from February of this year, we discussed three possible outcomes of the contractionary monetary policy that the Federal Reserve has been pursuing since March 2022, when the Federal Open Market Committee (FOMC) began raising its target range for the federal funds rate:
- A soft landing. The Fed’s preferred outcome; inflation returns to the Fed’s target of 2 percent without the economy falling into recession.
- A hard landing. Inflation returns to the Fed’s 2 percent target, but the economy falls into a recession.
- No landing. At the beginning of 2023, the unemployment remained very low and inflation, as measured by the percentage change in the personal consumption expenditures (PCE) price index from the same month in the previous year, was still above 5 percent. So, some observers, particularly in Wall Street financial firms, began discussing the possibility that low unemployment and high inflation might persist indefinitely, resulting an outcome of no landing.
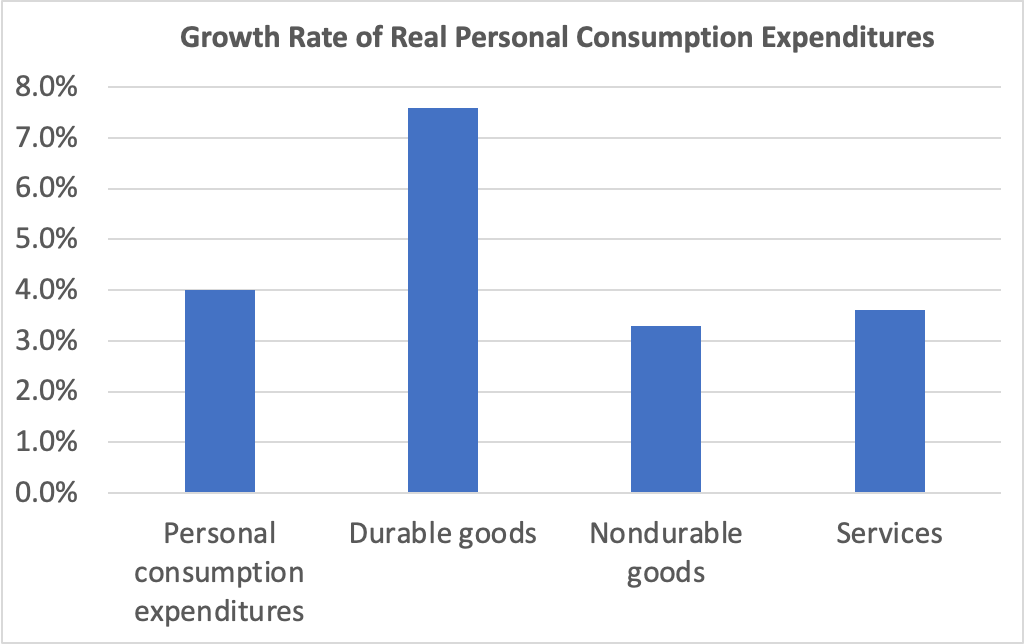
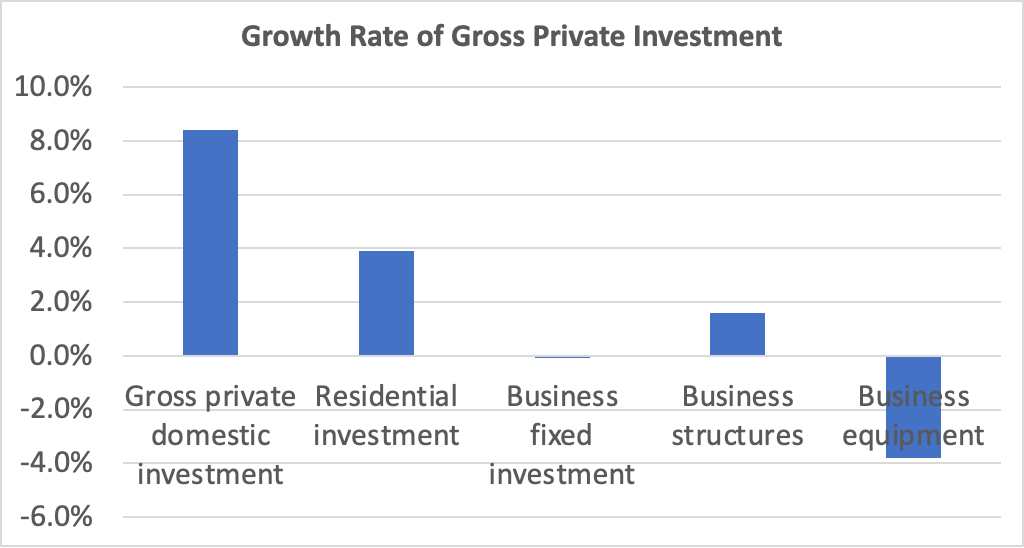
At the end of 2023, the economy appears to be slowing: Retail sales declined in October; real disposable personal income increased in October, but it has been trending down, as have real personal consumption expenditures; while the increase in third quarter real GDP was recently revised upward from 4.9 percent to 5.2 percent, forecasts of growth in real GDP during the fourth quarter show a marked slowing—for instance, GDPNow, compiled by the Atlanta Fed, estimates fourth quarter growth at 2.1 percent; and while employment continues to expand, average weekly hours have been slowly declining and initial claims for unemployment insurance have been increasing.
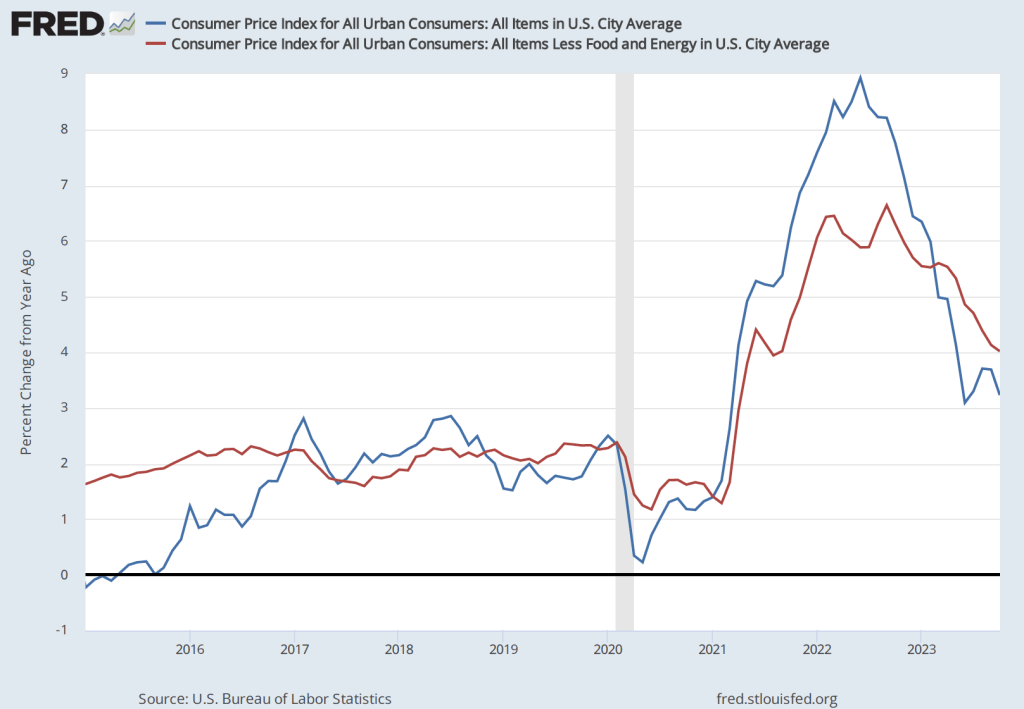
The slowing in the growth of output, income, and employment are reflected in a falling inflation rate. The following figure show the percentage change since the same month in the previous year in PCE price index, which is the measure the Fed uses to gauge whether it is hitting its 2 percent inflation target. (We discuss the reasons for the Fed preferring the PCE price index to the consumer price index (CPI) in Macroeconomics, Chapter 15, Section 15.5 and Economics, Chapter 25, Section 25.5.) The figure also shows core PCE, which excludes the prices of food and energy. Core PCE inflation typically gives a better measure of the underlying inflation rate than does PCE inflation.
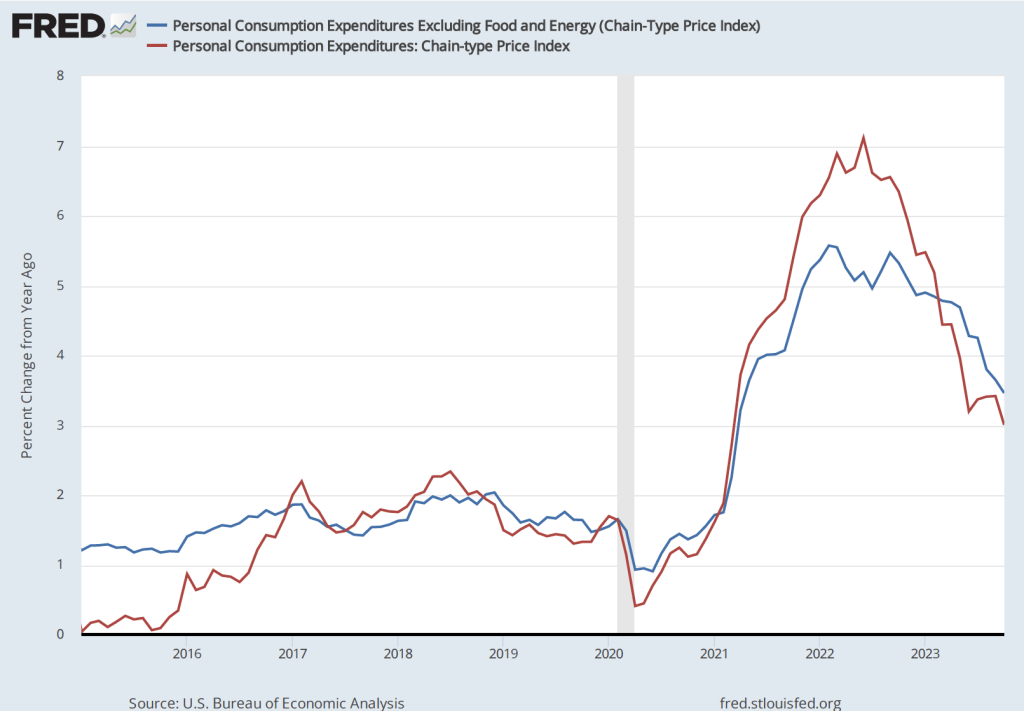
PCE inflation declined from 3.4 percent in September to 3.0 percent in October. Core PCE inlation declined from 3.8 percent in September to 3.5 percent in September. Although inflation has been declining from its peak in mid-2022, both of these measures of inflation remain above the Fed’s 2 percent target.
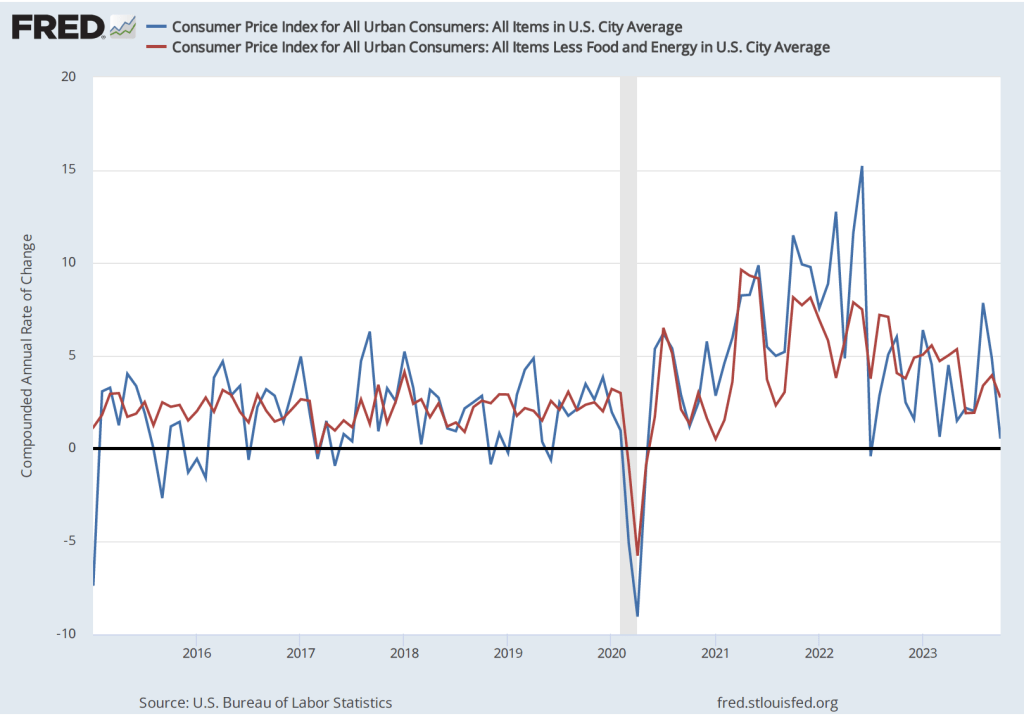
But if we look at the 1-month inflation rate—that is the annual inflation rate calculated by compounding the current month’s rate over an entire year—we see a much sharper decline in inflation, as the following figure shows.

The 1-month inflation rate is naturally more volatile than the 12-month inflation rate. In this case, the 1-month rate shows a sharp decline in PCE inflation from 3.8 percent in September to 0.6 percent in October. Core PCE inflation declined less sharply from 3.9 percent in September to 2.0 percent in October.
The continuing decline in inflation has caused some economists and Wall Street analysts to predict that the FOMC will not implement further increases in its target for the federal funds rate and will likely begin cutting its target by mid-2024.
On December 1 in a speech at Spelman College in Atlanta, Fed Chair Jerome Powell urged caution in assuming that the Fed has succeeded in putting inflation on a course back to its 2 percent target:
“The FOMC is strongly committed to bringing inflation down to 2 percent over time, and to keeping policy restrictive until we are confident that inflation is on a path to that objective. It would be premature to conclude with confidence that we have achieved a sufficiently restrictive stance, or to speculate on when policy might ease. We are prepared to tighten policy further if it becomes appropriate to do so.”
In terms of the three policy outcomes listed at the beginning of this post, the third—no landing, with the unemployment rate remaining very low while the inflation rate remains above the Fed’s 2 percent target—now seems unlikely. The labor market appears to be weakening, which will likely result in increases in the unemployment rate. The next “Employment Report” from the Bureau of Labor Statistics, which will be released on December 8, will provide additional data on the state of the labor market.
Although we can’t entirely rule out the possibility of a no landing outcome, it seems more likely that the economy will either make a soft landing—if output and employment continue to increase, although at a slower rate, while inflation continues to decline—or a hard landing—if output and employment begin to fall as the economy enters a recession. Although a consensus seems to be building among economists, policymakers, and Wall Street analysts that a soft landing is the likeliest outcome, Powell has provided a reminder that that outcome is far from certain.