Another Middling Inflation Report

Photo courtsey of Lena Buonanno.

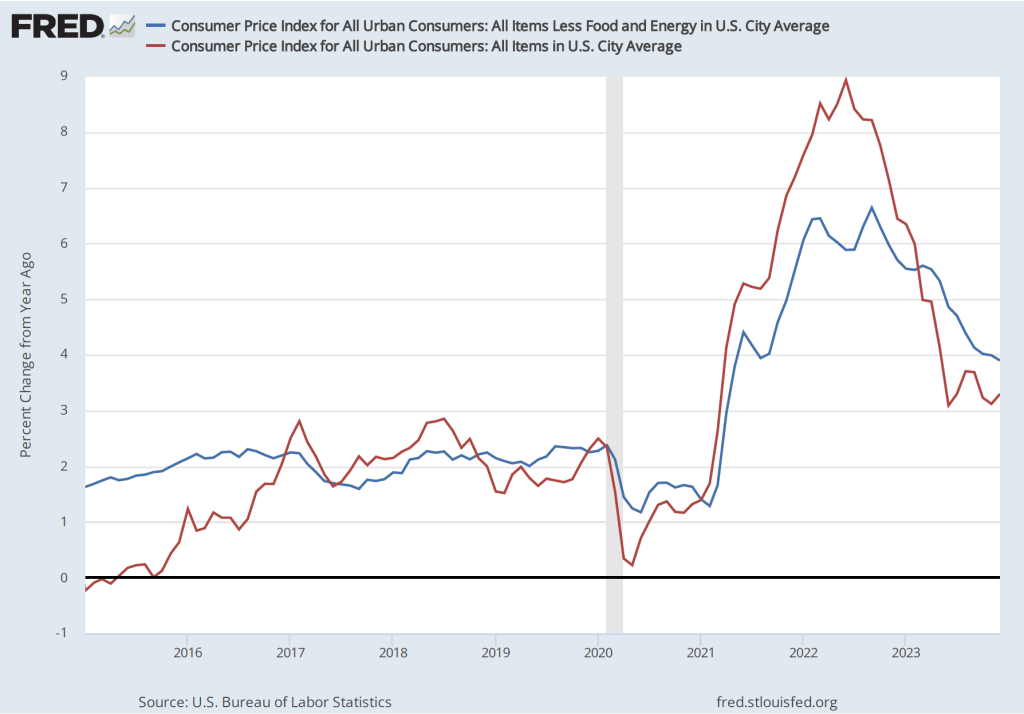
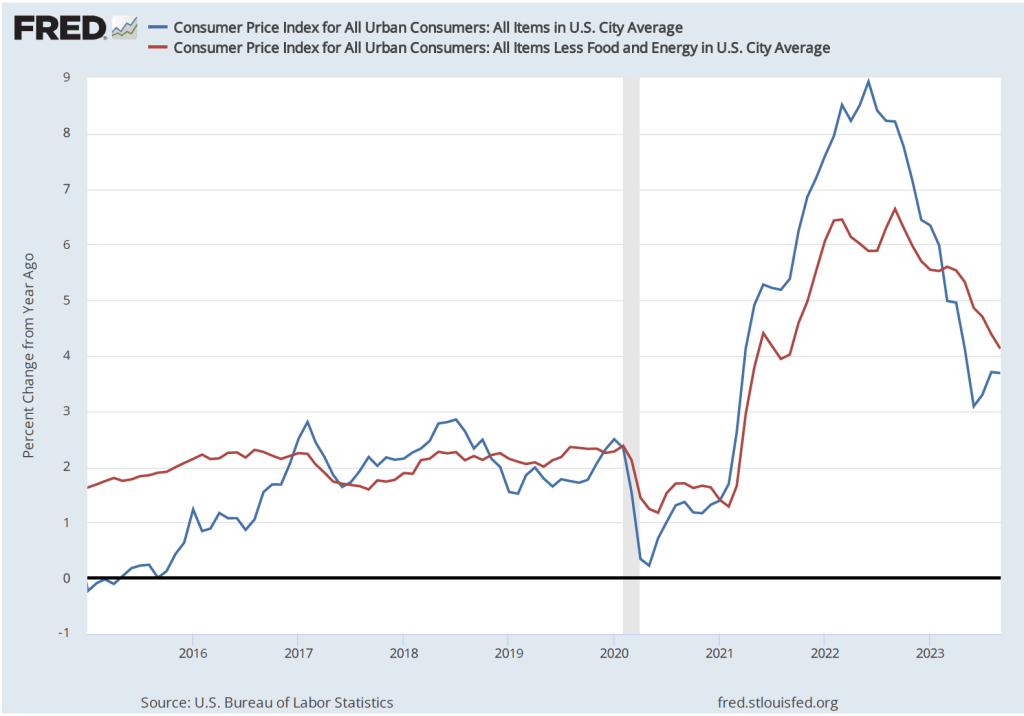
On the morning of January 11, 2024, the Bureau of Labor Statistics released its report on changes in consumer prices during December 2023. The report indicated that over the period from December 2022 to December 2023, the Consumer Price Index (CPI) increased by 3.4 percent (often referred to as year-over-year inflation). “Core” CPI, which excludes prices for food and energy, increased by 3.9 percent. The following figure shows the year-over-year inflation rate since Januar 2015, as measured using the CPI and core CPI.

This report was consistent with other recent reports on the CPI and on the personal consumption expenditures (PCE) price index—the measure the Fed uses to gauge whether it is achieving its target of 2 percent annual inflation—in showing that inflation has declined substantially from its peak in mid-2022 but is still above the Fed’s target.

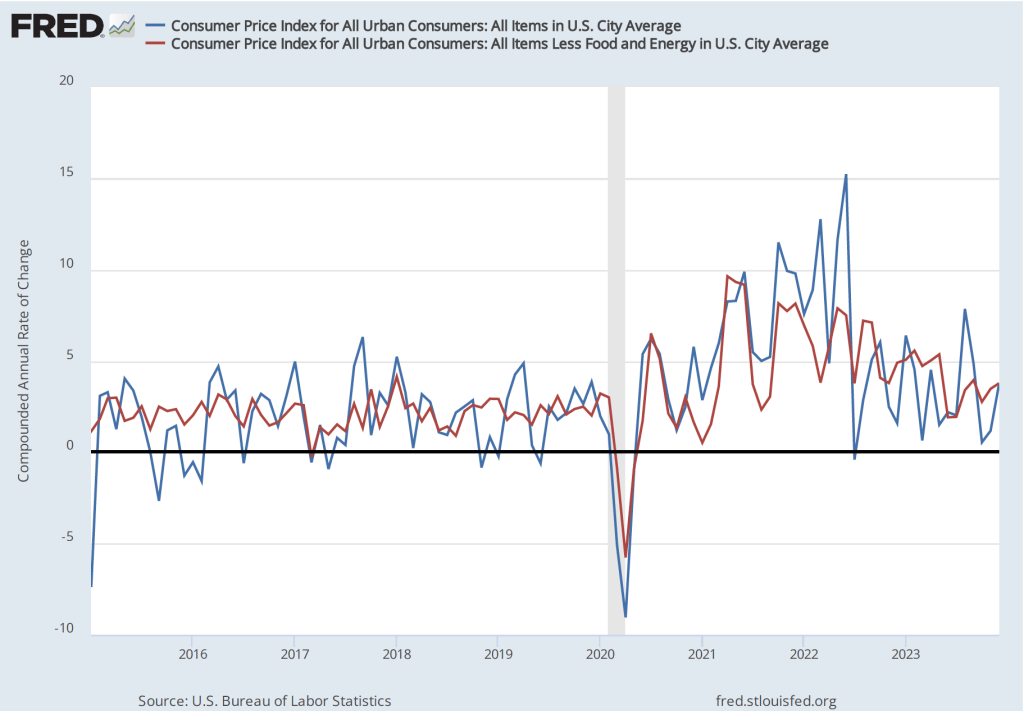
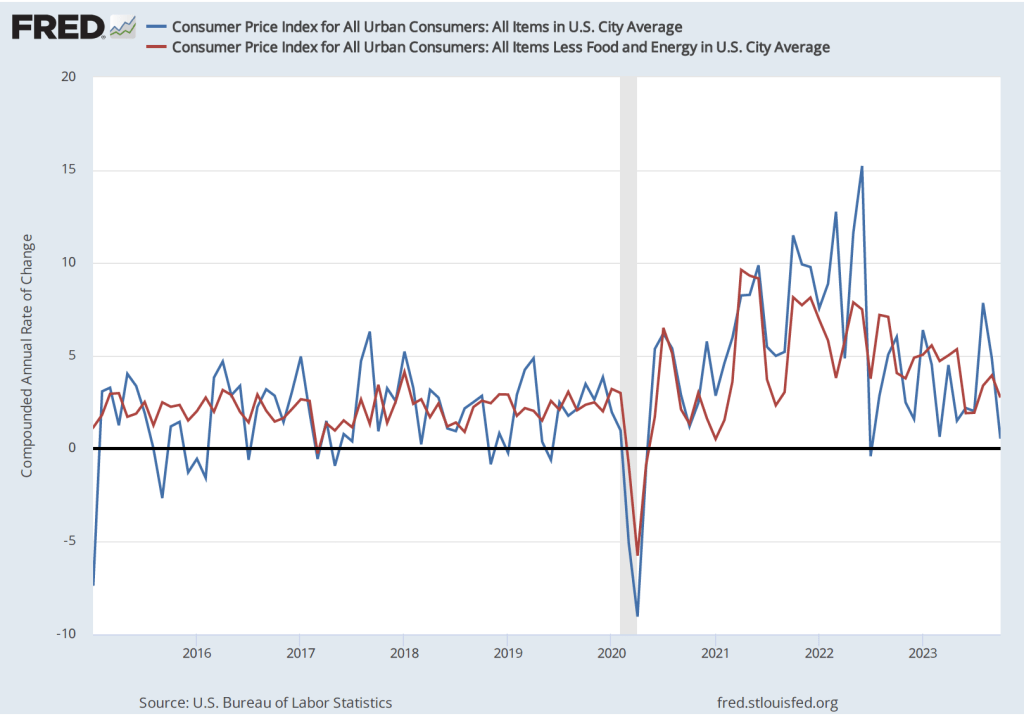
We get a similar result if we look at the 1-month inflation rate—that is the annual inflation rate calculated by compounding the current month’s rate over an entire year—as the following figure shows. The 1-month CPI inflation rate has moved erratically but has generally trended down. The 1-month core CPi inflation rate has moved less erratically, making the downward trend since mid-2022 clearer.

The headline on the Wall Street Journal article discussing this BLS report was: “Inflation Edged Up in December After Rapid Cooling Most of 2023.” The headline reflected the reaction of Wall Street investors who had hoped that the report would unambiguously show further slowing in inflation.

Overall, the report was middling: It didn’t show a significant acceleration in inflation at the end of 2023 but neither did it show a signficant slowing of inflation. At its next meeting on January 30-31, the Fed’s Federal Open Market Committee (FOMC) is expected to keep its target for the federal funds rate unchanged. There doesn’t appear to be anything in this inflation report that would be likely to affect the committee’s decision.

Economists vs. the Market in Predicting the First Cut in the Federal Funds Rate

The meeting room of the FOMC in the Federal Reserve building in Washington, DC.

As we’ve noted in several recent posts, the inflation rate has fallen significantly from its peak in mid-2022, as U.S. economic growth has been slowing and the labor market appears to be less tight, slowing the growth of wages. Some economists and policymakers now believe that by early 2024, inflation will approach the Fed Reserve’s 2 percent inflation target. At that point, the Fed’s Federal Open Market Committee (FOMC) is likely to turn its attention from inflation to making sure that the U.S. economy doesn’t slip into a recession.

Accordingly, both economists and financial market participants have begun to anticipate the point at which the FOMC will begin to cut its target for the federal funds rate. (One note of caution: Fed Chair Jerome Powell has made clear that the FOMC stands ready to further increase its target for the federal funds rate if the inflation rate shows signs of increasing. He made this point most recently on December 1 in a speech at Spelman College in Atlanta.)  There is currently an interesting disagreement between economists and investors over when the FOMC is likely to cut interest rates and by how much. We can see the views of investors reflected in the futures market for federal funds.

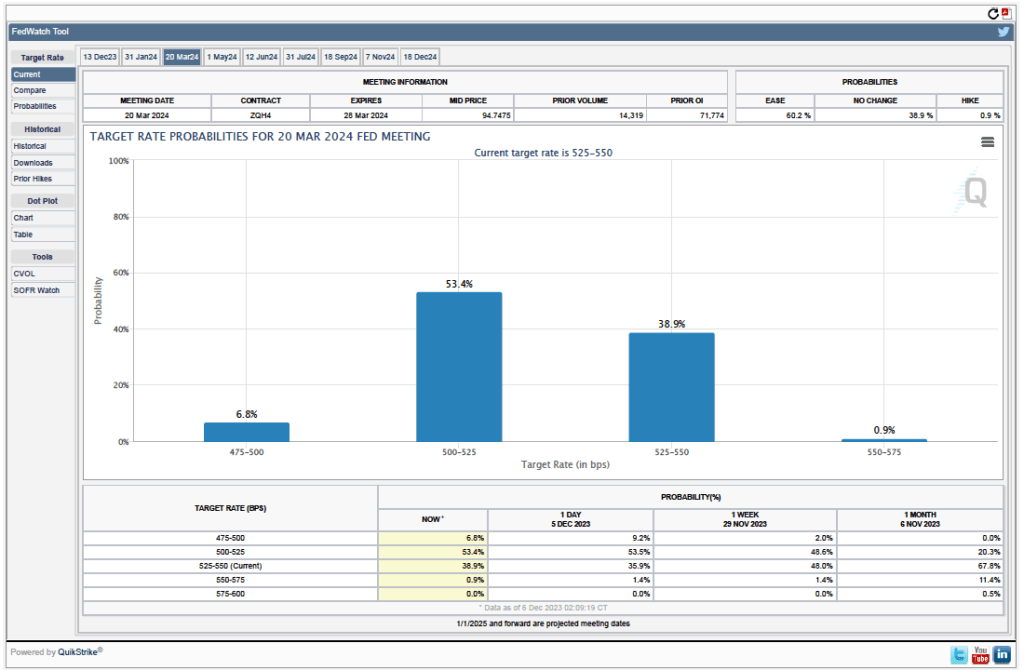
Futures markets allow investors to buy and sell futures contracts on commodities–such as wheat and oil–and on financial assets. Investors can use futures contracts both to hedge against risk—such as a sudden increase in oil prices or in interest rates—and to speculate by, in effect, betting on whether the price of a commodity or financial asset is likely to rise or fall. (We discuss the mechanics of futures markets in Chapter 7, Section 7.3 of Money, Banking, and the Financial System.) The CME Group was formed from several futures markets, including the Chicago Mercantile Exchange, and allows investors to trade federal funds futures contracts. The data that result from trading on the CME indicate what investors in financial markets expect future values of the federal funds rate to be. The following chart from the CME’s FedWatch Tool shows values after trading of federal funds futures on December 5, 2023.

The probabilities in the chart reflects investors’ predictions of what the FOMC’s target for the federal funds rate will be after the committee’s meeting on March 20, 2024. This meeting is the first after which investors currently expect that the target is likely to be lowered. The target range is currently 5.25 percent to 5.50 percent. The chart indicates that investors assign a probability of 60.2 percent to the FOMC making at least a 0.25 percentage cut in the target rate at the March meeting. 

Looking at the values for federal funds futures after the FOMC’s December 18, 2024 meeting, investors assign a 66.3 percent probability of the committee having reduced its target for the federal funds rate to 4.00 to 4.25 percent of lower. In other words, investors expect that during 2024, the FOMC will have cut its target for the federal funds rate by at least 1.25 percentage points.

Interesingly, according to a survey by the Financial Times, economists disagree with investors’ forecasts of the federal funds rate. According to the survey, which was conducted between December 1 and December 4, nearly two-thirds of economists believe that the FOMC won’t cut its target for the federal funds rate until July 2024 or later. Three-quarters of the economists surveyed believe that the FOMC will cut its target by 0.5 percent point or less during 2024. Fewer than 10 percent of the economists surveyed believe that during 2024 the FOMC will cut its target for the federal funds rate by 1.25 percent or more. (The Financial Times article describing the results of the survey can be found here. A subscription may be requred to read the article.)

So, at least among the economists surveyed by the Financial Times, the consensus is that the FOMC will cut its target for the federal funds rate later and by less than financial markets are indicating. What explains the discrepancy? The main explanation is that economists see inflation being persistently above the Fed’s 2 percent target for longer than do financial market participants. The economists surveyed are also more optimistic that the U.S. economy will avoid a recession in 2024. If a recession occurs, the FOMC is more likely to significantly cut its target than if the economy during 2024 experiences moderate growth in real GDP and the unemployment rate remains low.

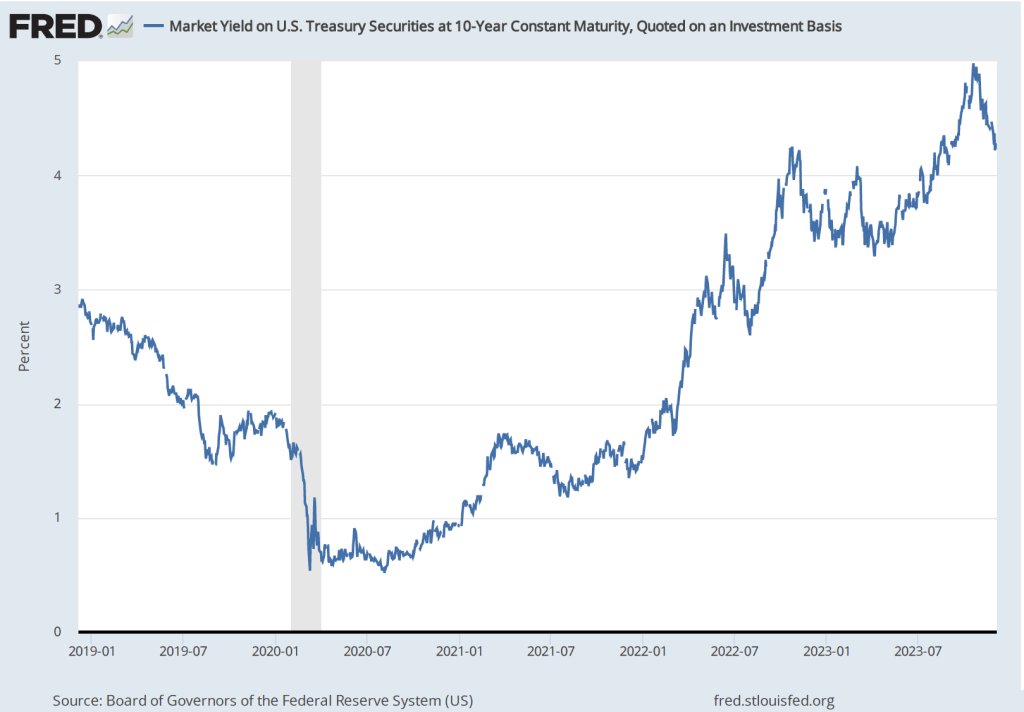
One other indication from financial markets that investors expect that the U.S. economy is likely to slow during 2024 is given by movements in the interest rate on the 10-year U.S. Treasury note. As shown in the following figure, from August to October of this year, the interest rate on the 10-year Treasury note rose from less than 4 percent to nearly 5  percent—an unusually large change in such a short period of time. Since then, most of that increase has been reversed with the interest rate on the 10-year Treasury note having fallen below 4.2 percent in early December

The movements in the interest rate on the 10-year Treasury note typically reflect investors’ expectations of future short-term interest rates. (We discuss the relationship between short-term and long-term interests rates—which economists call the term structure of interest rates—in Money, Banking, and the Financial System, Chapter 5, Section 5.2.) The increase in the 10-year interest rate between August and October reflected investors’ expectation that short-term interest rates were likely to remain persistently high for a considerable period—perhaps several years or more. The decline in the 10-year rate from late October to early December reflects investors changing their expectations toward future short-term interest rates being lower than they had previously thought. Again, as in the data on federal funds rate futures, investors seem to be expecting either slower economic growth or slower inflation than do economists.

One other complication about the interest rate on the 10-year Treasury note should be mentioned. Some of the increase in the rate from August to October may also have represented concern among investors that large federal budget deficit would cause the Treasury to issue more Treasury notes than investors would be willing to buy without the Treasury increasing the interest rate investors would receive on the newly issued notes. This concern may have been reinforced by data showing that foreign investors, particularly in China and Japan, appeared to have slowed or stopped adding to their holdings of Treasury notes. Part of the recent decline in the interest rate on the Treasury note may reflect investors becoming less concerned about these two factors.

Can We Now Rule Out One of the Three Potential Monetary Policy Outcomes?

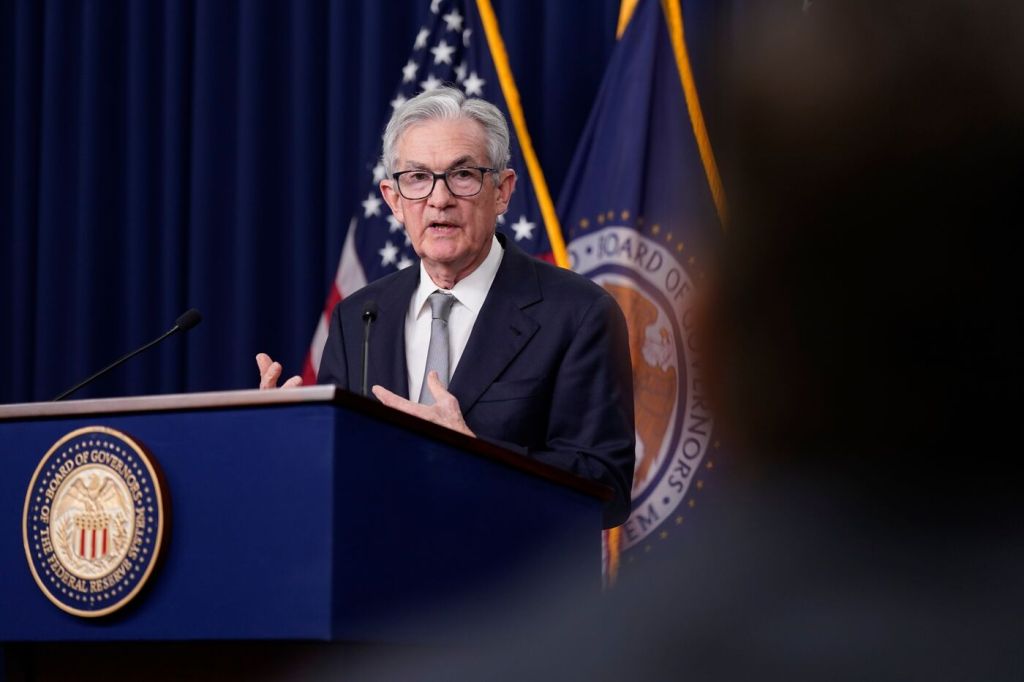
Federal Reserve Chair Jerome Powell (photo from bloomberg.com)

In a blog post from February of this year, we discussed three possible outcomes of the contractionary monetary policy that the Federal Reserve has been pursuing since March 2022, when the Federal Open Market Committee (FOMC) began raising its target range for the federal funds rate:

  1.  A soft landing. The Fed’s preferred outcome; inflation returns to the Fed’s target of 2 percent without the economy falling into recession.
  2. A hard landing. Inflation returns to the Fed’s 2 percent target, but the economy falls into a recession.
  3. No landing. At the beginning of 2023, the unemployment remained very low and inflation, as measured by the percentage change in the personal consumption expenditures (PCE) price index from the same month in the previous year, was still above 5 percent. So, some observers, particularly in Wall Street financial firms, began discussing the possibility that low unemployment and high inflation might persist indefinitely, resulting an outcome of no landing.

At the end of 2023, the economy appears to be slowing: Retail sales declined in October; real disposable personal income increased in October, but it has been trending down, as have real personal consumption expenditures; while the increase in third quarter real GDP was recently revised upward from 4.9 percent to 5.2 percent, forecasts of growth in real GDP during the fourth quarter show a marked slowing—for instance, GDPNow, compiled by the Atlanta Fed, estimates fourth quarter growth at 2.1 percent; and while employment continues to expand, average weekly hours have been slowly declining and initial claims for unemployment insurance have been increasing.

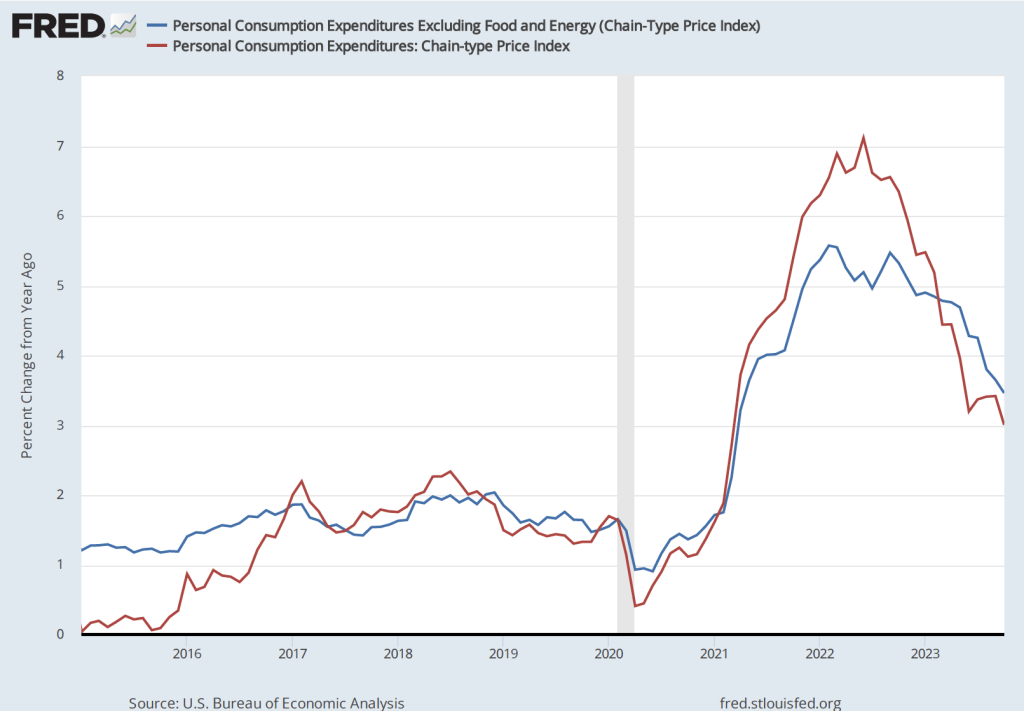
The slowing in the growth of output, income, and employment are reflected in a falling inflation rate. The following figure show the percentage change since the same month in the previous year in PCE price index, which is the measure the Fed uses to gauge whether it is hitting its 2 percent inflation target. (We discuss the reasons for the Fed preferring the PCE price index to the consumer price index (CPI) in Macroeconomics, Chapter 15, Section 15.5 and Economics, Chapter 25, Section 25.5.) The figure also shows core PCE, which excludes the prices of food and energy. Core PCE inflation typically gives a better measure of the underlying inflation rate than does PCE inflation.

PCE inflation declined from 3.4 percent in September to 3.0 percent in October. Core PCE inlation declined from 3.8 percent in September to 3.5 percent in September. Although inflation has been declining from its peak in mid-2022, both of these measures of inflation remain above the Fed’s 2 percent target.

But if we look at the 1-month inflation rate—that is the annual inflation rate calculated by compounding the current month’s rate over an entire year—we see a much sharper decline in inflation, as the following figure shows.

The 1-month inflation rate is naturally more volatile than the 12-month inflation rate. In this case, the 1-month rate shows a sharp decline in PCE inflation from 3.8 percent in September to 0.6 percent in October. Core PCE inflation declined less sharply from 3.9 percent in September to 2.0 percent in October.

The continuing decline in inflation has caused some economists and Wall Street analysts to predict that the FOMC will not implement further increases in its target for the federal funds rate and will likely begin cutting its target by mid-2024.

On December 1 in a speech at Spelman College in Atlanta, Fed Chair Jerome Powell urged caution in assuming that the Fed has succeeded in putting inflation on a course back to its 2 percent target:

“The FOMC is strongly committed to bringing inflation down to 2 percent over time, and to keeping policy restrictive until we are confident that inflation is on a path to that objective. It would be premature to conclude with confidence that we have achieved a sufficiently restrictive stance, or to speculate on when policy might ease. We are prepared to tighten policy further if it becomes appropriate to do so.”

In terms of the three policy outcomes listed at the beginning of this post, the third—no landing, with the unemployment rate remaining very low while the inflation rate remains above the Fed’s 2 percent target—now seems unlikely. The labor market appears to be weakening, which will likely result in increases in the unemployment rate. The next “Employment Report” from the Bureau of Labor Statistics, which will be released on December 8, will provide additional data on the state of the labor market.

Although we can’t entirely rule out the possibility of a no landing outcome, it seems more likely that the economy will either make a soft landing—if output and employment continue to increase, although at a slower rate, while inflation continues to decline—or a hard landing—if output and employment begin to fall as the economy enters a recession.  Although a consensus seems to be building among economists, policymakers, and Wall Street analysts that a soft landing is the likeliest outcome, Powell has provided a reminder that that outcome is far from certain.

In Prison, Sam Bankman-Fried Encounters a Barter Economy

Photo from the Wall Street Journal.

Earlier this month, Sam Bankman-Fried was convicted of fraud connected with the collapse of the FTX cryptocurrency exchange he founded. (We discuss aspects of cryptocurrencies in earlier blog posts here and here.) Bankman-Fried had a reputation for dressing casually and for having bushy, unkempt hair. In preparing for his trial, Bankman-Fried paid another inmate at the Metropolitan Detention Center in New York City to cut his hair short. According to an article in the Wall Street Journal, Bankman-Fried paid the other inmate not with currency but with four packets of mackerels—like the ones shown in the photo above—to cut his hair.

Although using packets of mackerels to buy and sell services may seem strange, in fact, packets of mackerel seem to be widely used in place of currency in the U.S. prison system. We explained the situation in an Apply the Concept in an earlier edition of our principles textbook. We reproduce that feature here. Note that the inmate quoted indicates that the price of a haircut at that time was only two mackerel packets rather than the four that Bankman-Fried paid. (Question to consider: Would we expect that prices of services in terms of mackerel packets would be the same across prisons at a given time or in the same prison over time?)

The Mackerel Economy in the Federal Prison System

Inmates of the federal prison system are not allowed to have money. Funds they earn working in the prison or receive from friends and relatives are placed in an account they can draw on to buy snacks and other items from the prison store. Lacking money, prisoners could barter with each other in exchanging goods and services, but we have seen that barter is inefficient. Since about 2004, in many prisons small plastic packets of mackerel fillets costing about $1 each have been used as money. [According to the Wall Street Journal article linked to earlier, the mackerel packets now sell for $1.30.] The packets are known in prison as “macks.”

            Some prisoners have set up small businesses using mackerel packets for money. They sell services such as shoe shines, cell cleaning, or haircuts for macks. According to a prisoner in Lompoc prison in California, “A haircut is two macks.” A former prisoner described a fellow prisoner’s food business: “I knew a guy who would buy ingredients and use the microwaves to cook meals. Then people used mack to buy it from him.” In the Pensacola prison in Florida, the prison commissary was open only one day a week. So, several prisoners would run “prison 7-Elevens” by stocking up on goods and reselling them for macks at a profit. Very few prisoners actually eat the mackerel in the packets. In fact, apart from prison commissaries, the demand for mackerel in the United States is very small.

            The mackerel economy is under pressure at some prisons, where rules exist against hoarding goods from the commissary. Prisoners caught dealing in macks can risk no longer being allowed to use the commissary or may be moved to a less desirable cell. In these prisons, the mackerel economy has been pushed underground.

The prison mackerel economy illustrates an important fact about money: Anything can be used as money, as long as people are willing to accept it in exchange for goods and services—even pouches of fish that no one wants to eat.

Source: Justin Scheck, “Mackerel Economics in Prison,” Wall Street Journal, October 2, 2008.

Wall Street Journal: “Cooling Inflation Likely Ends Fed Rate Hikes”

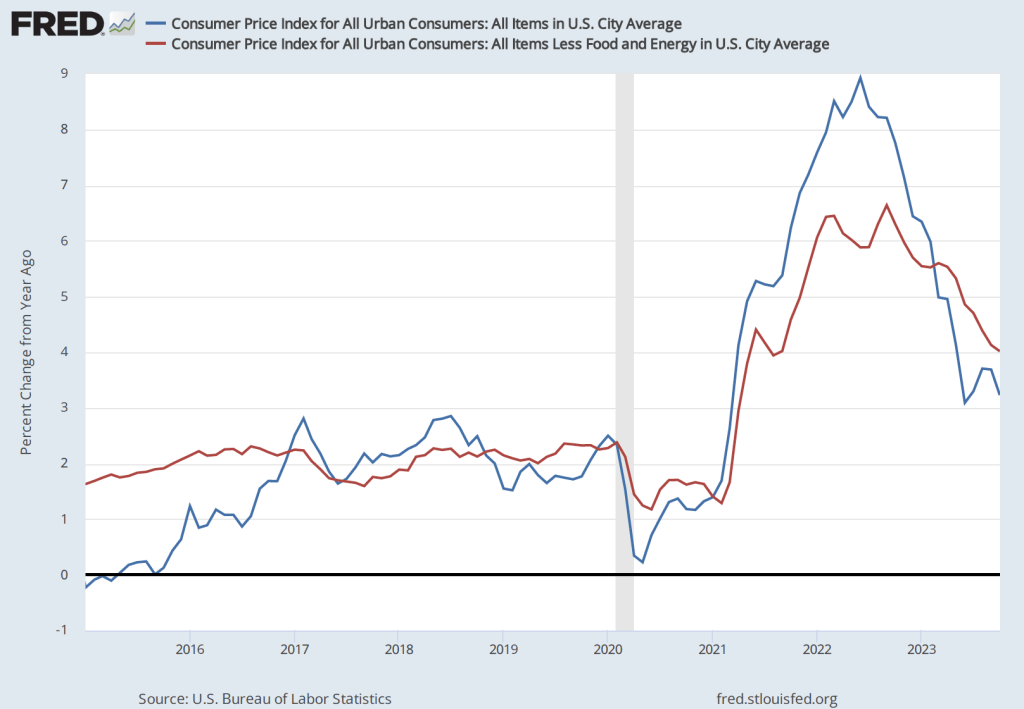
The Bureau of Labor Statistics released its latest report on consumer prices the morning of November 14. The Wall Street Journal’s headline reflects the general reaction to the report: The inflation rate continued to decline, which made it less likely that the Fed’s Federal Open Market Committee will raise its target range for the federal funds rate again at its December meeting. The following figure shows inflation measured as the percentage change in the Consumer Price Index (CPI) from the same month in the previous year. It also shows the inflation rate measure using “core” CPI, which excludes prices for food and energy.

The inflation rate for the CPI declined from 3.7 percent in September to 3.2 percent in October. Core CPI declined from 4.1 percent in September to 4.0 percent in October. So, measured this way, inflation declined substantially when measured by the CPI including prices of all goods and services but only slightly when measured using core CPI.

The 12-month inflation rate is the one typically reported in the Wall Street Journal and elsewhere, but it has the drawback that it doesn’t always reflect accurately the current trend in prices. The following figure shows the 1-month inflation rate—that is the annual inflation rate calculated by compounding the current month’s rate over an entire year— for CPI and core CPI. The 1-month inflation rate is naturally more volatile than the 12-month inflation rate. In this case, 1-month rate shows a sharp decline in the inflation rate for the CPI from 4.9 percent in September to 0.5 percent in October. Core inflation declined less sharply from 3.9 percent in September to 2.8 percent in October.

The release of the CPI report was treated as good news on Wall Street, with the Dow Jones Industrial Average increasing by 500 points and the interest rate on the 10-year U.S. Treasury Note declining from 4.6 percent just before the report was released to 4.4 percent immediately after. The increases in stock and bond prices (recall that the prices of bonds and the yields on the bonds move in opposite directions, so bond prices rose following release of the report) reflect the view of financial investors that if the FOMC stops increasing its target for the federal funds rate, the chance that the U.S. economy will fall into a recession is reduced.

A word of caution, however. In a speech on November 9, Fed Chair Jerome Powell noted that the FOMC may need still need to implement additional increases to its federal funds rate target:

“My colleagues and I are gratified by this progress [against inflation] but expect that the process of getting inflation sustainably down to 2 percent has a long way to go…. The Federal Open Market Committee (FOMC) is committed to achieving a stance of monetary policy that is sufficiently restrictive to bring inflation down to 2 percent over time; we are not confident that we have achieved such a stance. We know that ongoing progress toward our 2 percent goal is not assured: Inflation has given us a few head fakes. If it becomes appropriate to tighten policy further, we will not hesitate to do so.”

So, while the latest inflation report is good news, it’s still too early to know whether inflation is on a stable path to return to the Fed’s 2 percent target. (It’s worth noting that the Fed uses inflation as measured by the personal consumption expenditure (PCE) price index rather than as measured by the CPI when evaluating whether it has achieved its 2 percent target.)

Who Is Wealthier, Iron Man or Batman?

Photo from Paramount Pictures via britannica.com.

Photo from Warner Brothers Pictures via insider.com.

Income and wealth are often confused. Media accounts of the “wealthy” typically switch back and forth between referring to people with high incomes and referring to people with substantial wealth. It’s possible to have a high income, but not much wealth, if you spend most of your income. It’s also possible, although less common, for someone to have substantial wealth while having a relatively low income.

As we discuss in the Don’t Let This Happen to You feature in Macroeconomics, Chapter 14 (also Economics, Chapter 24), Your income is equal to your earnings during the year, while your wealth is equal to the value of the assets you own minus the value of any debts you have. It’s also worth keeping in mind that income is a flow variable that is measured over a period of time—such as a year—while wealth is a stock variable that is measured at a particular point in time—such as the first or last day of the year.

Both income and wealth can be difficult to accurately measure. Although we typically think of a person’s income as being equal to the salary and wages the person earns, income, properly measured, also includes changes in the value of the assets the person owns. For example, suppose that at the start of the year you own shares of Apple stock worth $5,000. If at the end of the year, the price on the stock market of your Apple shares has risen to $5,500, the $500 increase is part of your income for the year. (Note that this capital gain on your stock is included in your taxable income only if you sell the stock. Whether you sell the stock or not, though, the capital gain is part of your income.)

It can be difficult to measure the wealth of someone who owns significant assets that, unlike shares of stock, aren’t regularly bought and sold in a market. For instance, if someone owns a restaurant, determining what the price the restaurant would sell for—and, therefore, how wealthy the person is—can be difficult. Although other restaurants in the area may have sold recently, every restaurant is different, which makes it possible to determine only approximately what the sales price of a particular restaurant would be. As we discuss in the Apply the Concept feature “Should the Federal Government Begin to Tax Wealth?” in Microeconomics, Chapter 17 (also Economics, Chapter 17), the difficulty of valuing some types of wealth is one complication the federal government would face in enacting a tax on wealth. 

If measuring the wealth of someone in the real world is difficult, measuring the wealth of a fictional character is even more daunting. Some years ago, undergraduate students, most of whom were economics majors at Lehigh University, estimated the wealth of Bruce Wayne, the alter ego of Batman. To narrow the focus, the students based their estimate on only the information available in the three Batman films directed by Christopher Nolan. On the basis of that information, they estimate that Bruce Wayne’s wealth is $11.6 billion. At the time the films were produced, that would have made Bruce Wayne the seventy-third wealthiest person in the world—if, of course, he had been a real person! You can read the details of their estimate here. 

Bruce Wayne is apparently very wealthy, but is he as wealthy as Tony Stark, the alter ego of Iron Man? Apparently not, according to an estimate appearing on the business web site forbes.com. Although he doesn’t seem to give the details of how he arrived at the estimate, the author of the post values Tony Stark’s wealth at $9.3 billion, making him about 20 percent less wealthy than Bruce Wayne.  Score one for the Caped Crusader!

Very Strong GDP Report

Photo from Lena Buonanno

This morning the Bureau of Economic Analysis (BEA) released its advance estimate of GDP for the third quarter of 2023. (The report can be found here.) The BEA estimates that real GDP increased by 4.9 percent at an annual rate in the third quarter—July through September. That was more than double the 2.1 percent increase in real GDP in the second quarter, and slightly higher than the 4.7 percent that economists surveyed by the Wall Street Journal last week had expected. The following figure shows the rates of GDP growth each quarter beginning in 2021.

Note that the BEA’s most recent estimates of real GDP during the first two quarters of 2022 still show a decline. The Federal Reserve’s Federal Open Market Committee only switched from a strongly expansionary monetary policy, with a target for the federal funds of effectively zero, to a contractionary monetary policy following its March 16, 2022 meeting. That real GDP was declining even before the Fed had pivoted to a contractionary monetary policy helps explain why, despite strong increases employment during this period, most economists were expecting that the U.S. economy would experience a recession at some point during 2022 or 2023. This expectation was reinforced when inflation soared during the summer of 2022 and it became clear that the FOMC would have to substantially raise its target for the federal funds rate.

Clearly, today’s data on real GDP growth, along with the strong September employment report (which we discuss in this blog post), indicates that the chances of the U.S. economy avoiding a recession in the future have increased and are much better than they seemed at this time last year.

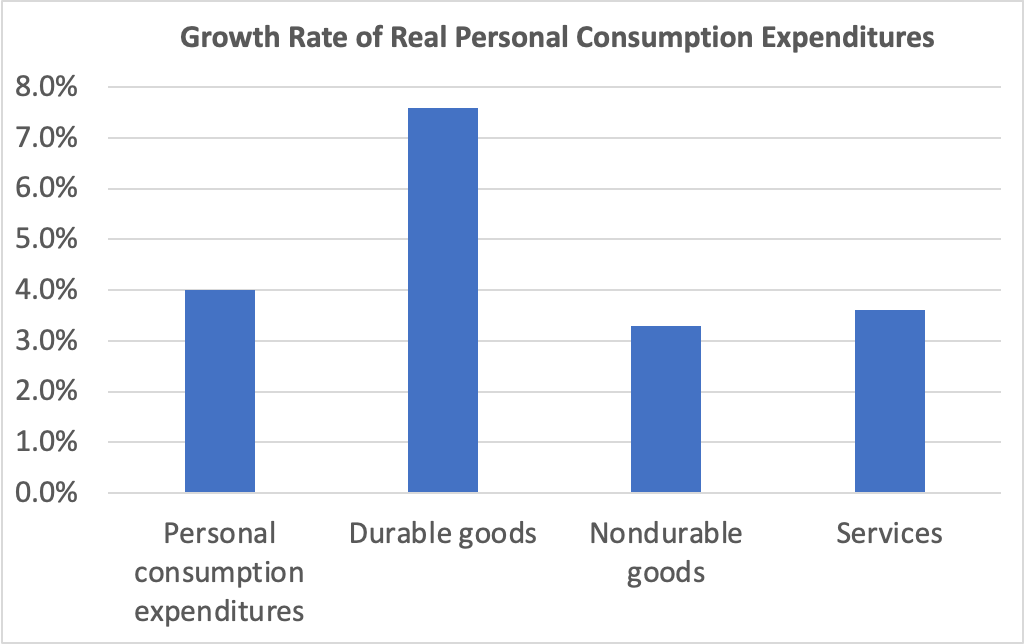
Consumer spending was the largest contributor to third quarter GDP growth. The following figure shows growth rates of real personal consumption expenditures and the subcategories of expenditures on durable goods, nondurable goods, and services. There was strong growth in each component of consumption spending. The 7.6 percent increase in expenditures on durables was particularly strong, particularly given that spending on durables had fallen by 0.3 percent in the second quarter.

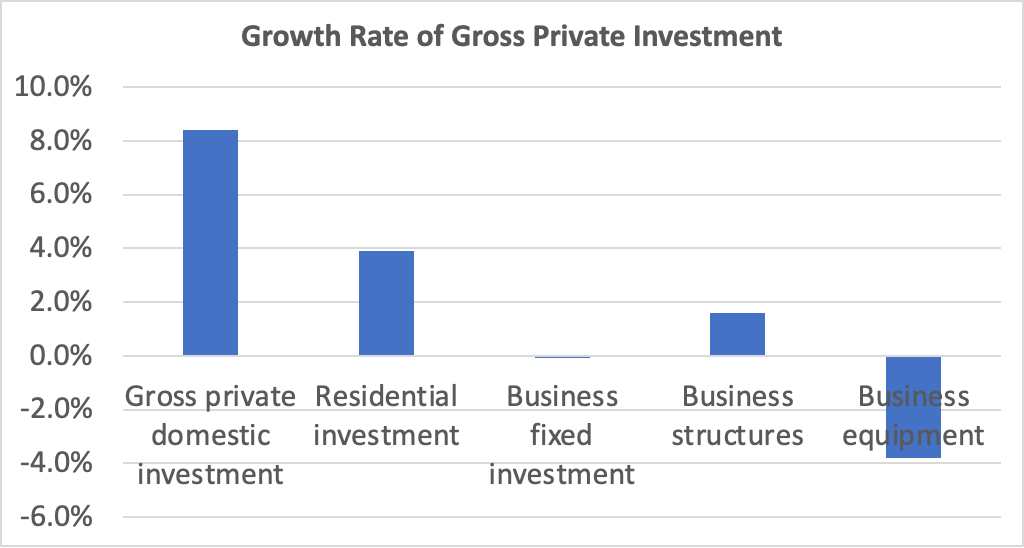
Investment spending and its components were a more mixed bag, as shown in the following figure. Overall, gross private domestic investment increased at a very strong rate of 8.4 percent—the highest rate since the fourth quarter of 2021. Residential investment increased 3.9 percent, which was particularly notable following nine consecutive quarters of decline and during a period of soaring mortgage interest rates. But business fixed investment was noticeably weak, falling by 0.1 percent. Spending on structures—such as factories and office buildings—increased by only 1.6 percent, while spending on equipment fell by 3.8 percent.

Today’s real GDP report also contained data on the private consumption expenditure (PCE) price index, which the FOMC uses tp determine whether it is achieving its goal of a 2 percent inflation rate. The following figure shows inflation as measured using the PCE and the core PCE—which excludes food and energy prices—since the beginning of 2015. (Note that these inflation rates are measured using quarterly data and as compound annual rates of change.) Despite the strong growth in real GDP and employment, inflation as measured by PCE increased only from 2.5 percent in the second quarter to 2.9 percent in the third quarter. Core PCE, which may be a better indicator of the likely course of inflation in the future, continued the long decline that began in first quarter of 2022 by failling from 3.7 percent to 2.9 percent.

The combination of strong growth in real GDP and declining inflation indicates that the Fed appears well on its way to a soft landing—achieving  a return to its 2 percent inflation target without pushing the economy into a recession. There are reasons to be cautious, however.

GDP, inflation, and employment data are all subject to—possibly substantial—revisions. So growth may have been significantly slower than today’s advance estimate of real GDP indicates. Even if the estimate of real GDP growth of 4.9 percent proves in the long run to have been accurate, there are reasons to doubt whether output growth can be maintained at near that level. Since 2000, annual growth in real GDP has average only 2.1 percent. For GDP to begin increasing at a rate substantially higher than that would require a significant expansion in the labor force and an increase in productivity. While either or both of those changes may occur, they don’t seem likely as of now.

In addition, the largest contributor to GDP growth in the third quarter was from consumption expenditures. As households continue to draw down the savings they built up as a result of the federal government’s response to the Covid recession of 2020, it seems unlikely that the current pace of consumer spending can be maintained. Finally, the lagged effects of monetary policy—particularly the effects of the interest rate on the 10-year Treasury note having risen to nearly 5 percent (which we discuss in our most recent podcast)—may substantially reduce growth in real GDP and employment in future quarters.

But those points shouldn’t distract from the fact that today’s GDP report was good news for the economy.

10/21/23 Podcast – Authors Glenn Hubbard & Tony O’Brien reflect on the Fed’s efforts to execute the soft-landing.

Join authors Glenn Hubbard & Tony O’Brien as they reflect on the Fed’s efforts to execute the soft landing, ponder if the effect will stick, and wonder if future economies will be tethered to an anchor point above two percent.

Another Mixed Inflation Report

Fed Chair Jerome Powell and Fed Vice-Chair Philip Jefferson this summer at the Fed conference in Jackson Hole, Wyoming. (Photo from the AP via the Washington Post.)

This morning, the Bureau of Labor Statistics (BLS) released its report on the consumer price index (CPI) for September. (The full report can be found here.) The report was consistent with other recent data showing that inflation has declined markedly from its summer 2022 highs, but appears, at least for now, to be stuck in the 3 percent to 4 percent range—well above the Fed’s 2 percent inflation target. 

The report indicated that the CPI rose by 0.4 percent in September, which was down from 0.6 percent in August. Measured by the percentage change from the same month in the previous year, the inflation rate was 3.7 percent, the same as in August. Core CPI, which excludes the prices of food and energy, increased by 4.1 percent in September, down from 4.4 percent in August. The following figure shows inflation since 2015 measured by CPI and core CPI.

Reporters Gabriel Rubin and Nick Timiraos, writing in the Wall Street Journal summarized the prevailing interpretation of this report:

“The latest inflation data highlight the risk that without a further slowdown in the economy, inflation might settle around 3%—well below the alarming rates that prompted a series of rapid Federal Reserve rate increases last year but still above the 2% inflation rate that the central bank has set as its target.”

As we discuss in this blog post, some economists and policymakers have argued that the Fed should now declare victory over the high inflation rates of 2022 and accept a 3 percent inflation rate as consistent with Congress’s mandate that the Fed achieve price stability. It seems unlikely that the Fed will follow that course, however. Fed Chair Jerome Powell ruled it out in a speech in August: “It is the Fed’s job to bring inflation down to our 2 percent goal, and we will do so.”

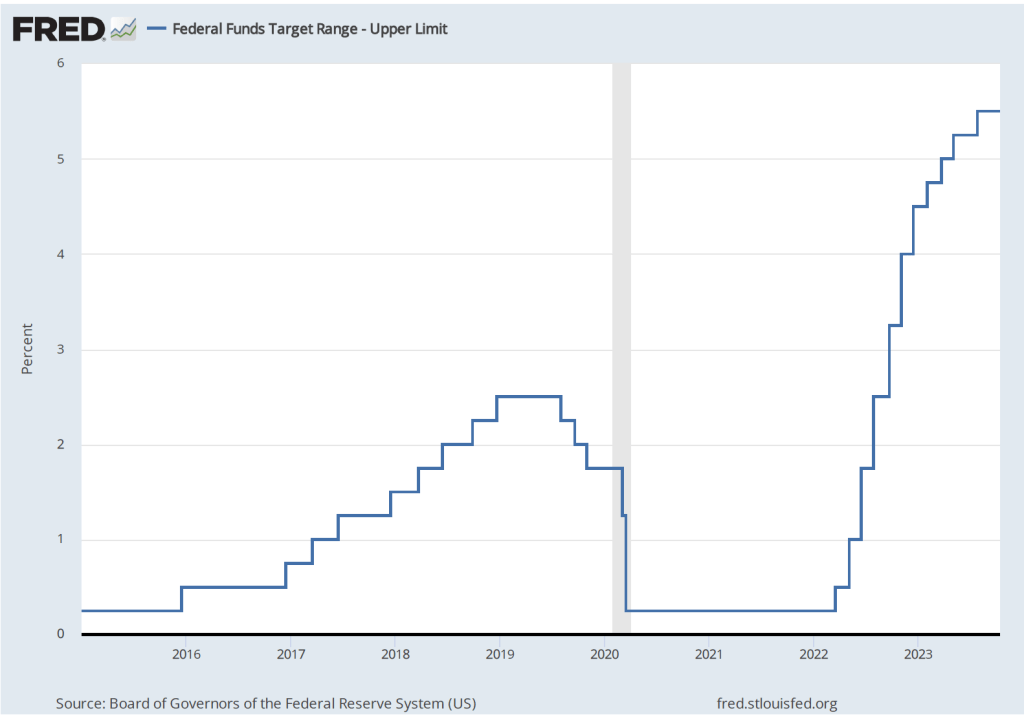
To achieve its goal of bringing inflation back to its 2 percent targer, it seems likely that economic growth in the United States will have to slow, thereby reducing upward pressure on wages and prices. Will this slowing require another increase in the Federal Open Market Committe’s target range for the federal funds rate, which is currently 5.25 to 5.50 percent? The following figure shows changes in the upper bound for the FOMC’s target range since 2015.

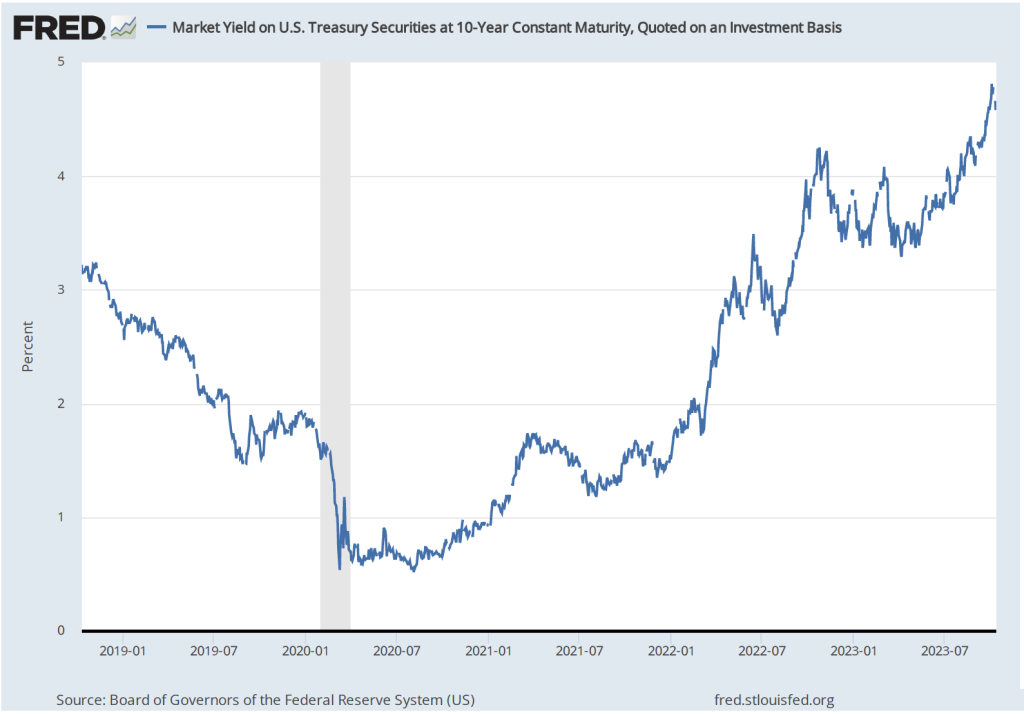
Several members of the FOMC have raised the possibility that financial markets may have already effectively achieved the same degree of policy tightening that would result from raising the target for the federal funds rate. The interest rate on the 10-year Treasury note has been steadily increasing as shown in the following figure. The 10-year Treasury note plays an important role in the financial system, influencing interest rates on mortgages and corporate bonds. In fact, the main way in which monetary policy works is for the FOMC’s increases or decreases in its target for the federal funds rate to result in increases or decreases in long-run interest rates. Higher long-run interest rates typically result in a decline in spending by consumrs on new housing and by businesses on new equipment, factories computers, and software.

Federal Reserve Bank of Dallas President Lorie Logan, who serves on the FOMC, noted in a speech that “If long-term interest rates remain elevated … there may be less need to raise the fed funds rate.” Similarly, Fed Vice-Chair Philip Jefferson stated in a speech that: “I will remain cognizant of the tightening in financial conditions through higher bond yields and will keep that in mind as I assess the future path of policy.”

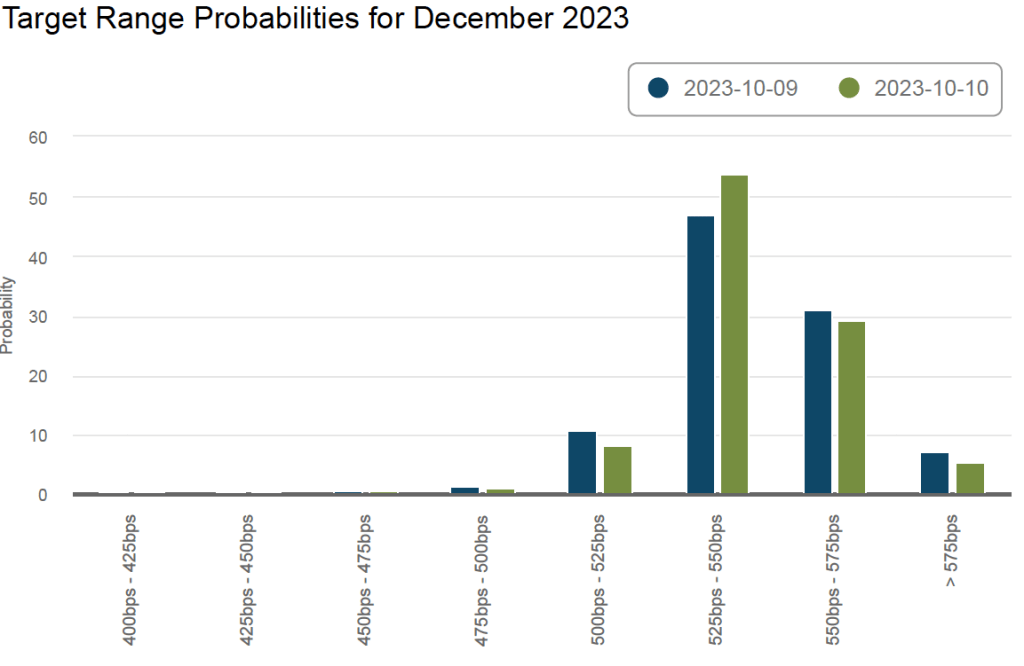
The FOMC has two more meetings scheduled for 2023: One on October 31-November 1 and one on December 12-13. The following figure from the web site of the Federal Reserve Bank of Atlanta shows financial market expectations of the FOMC’s target range for the federal funds rate in December. According to this estimate, financial markets assign a 35 percent probability to the FOMC raising its target for the federal funds rate by 0.25 or more. Following the release of the CPI report, that probability declined from about 38 percent. That change reflects the general expectation that the report didn’t substantially affect the likelihood of the FOMC raising its target for the federal funds rate again by the end of the year.

The Fed Throws Wall Street a Curveball

A trader on the New York Stock Exchange listtening to Fed Chair Jerome Powell (from Reuters via the New York Times)

Accounting for movements in the market prices of stocks and bonds is not an exact exercise. Accounts in the Wall Street Journal and on other business web sites often attribute movements in stock and bond prices to the Fed having acted in a way that investors didn’t expect. 

The decision by the Fed’s Federal Open Market Committee (FOMC) at its meeting on September 20-21, 2023 to hold its target for the federal funds rate constant at a range of 5.25 percent to 5.50 percent wasn’t a surprise. Fed Chair Jerome Powell had signaled during his press conference on July 26 following the FOMC’s previous meeting that the FOMC was likely to pause further increases in the federal funds rate target. (A transcript of Powell’s July 26 press conference can be found here.)

In advance of the September meeting, some other members of the FOMC had also signaled that the committee was unlikely to increase its target. For instance, an article in the Wall Street Journal quoted Susan Collins, president of the Federal Reserve Bank of Boston, as stating that: “The risk of inflation staying higher for longer must now be weighed against the risk that an overly restrictive stance of monetary policy will lead to a greater slowdown than is needed to restore price stability.” And in a speech in August, Raphael Bostic, president of the Federal Reserve Bank of Atlanta, explained his position on future rate increases: “Based on current dynamics in the macroeconomy, I feel policy is appropriately restrictive. I think we should be cautious and patient and let the restrictive policy continue to influence the economy, lest we risk tightening too much and inflicting unnecessary economic pain.”

Although it wasn’t a surprise that the FOMCdecided to hold its target for the federal funds rate constant, after the decision was announced, stock and bond prices declined. The following figure shows the S&P 500 index of stock prices. The index declined 2.8 percent from September 19—the day before the FOMC meeting—to September 22—two days after the meeting. (We discuss indexes of stock prices in Macroeconomics, Chapter 6, Section 6.2; Economics, Chapter 8, Section 8.2; and Essentials of Economics, Chapter 8, Section 8.2.)

We see a similar pattern in the bond market. Recall that when the price of bonds declines in the bond market, the interest rates—or yields—on the bonds increase. As the following figure shows, the interest rate on the 10-year Treasury note rose from 4.37 percent on September 19 to 4.49 percent on September 21. The 10-year Treasury note plays an important role in the financial system, influencing interest rates on mortgages and corporate bonds. So, the yield on the 10-year Treasury note increasing from 3.3 percent in the spring of 2023 to 4.5 percent following the FOMC meeting has the effect of increasing long-term interest rates throughout the U.S. economy.
What explains the movements in the prices of stocks and bonds following the September FOMC meeting? Investors seem to have been surprised by: 1) what Chair Powell had to say in his news conference following the meeting; and 2) the committee members’ Summary of Economic Projections (SEP), which was released after the meeting.

Powell’s remarks were interpreted as indicating that the FOMC was likely to increase its target for the federal funds rate at least once more in 2023 and was unlikely to cut its target before late 2024. For instance, in response to a question Powell said: “We need policy to be restrictive so that we can get inflation down to target. Okay. And we’re going to need that to remain to be the case for some time.” Investors often disagree in their interpretations of what a Fed chair says. Fed chairs don’t act unilaterally because the 12 voting members of the FOMC decide on the target for the federal funds rate. So chairs tend to speak cautiously about future policy. Still, their seemed to be a consensus among investors that Powell was indicating that Fed policy would be more restrictive (or contractionary) than had been anticipated prior to the meeting.

The FOMC releases the SEP four times per year. The most recent SEP before the September meeting was from the June meeting. The table below shows the median of the projections, or forecasts, of key economic variables made by the members of the FOMC at the June meeting. Note the second row from the bottom, which shows members’ median forecast of the federal funds rate.

The following table shows the median values of members’ forecast at the September meeting. Look again at the next to last row. The members’ forecast of the federal funds rate at the end of 2023 was unchanged. But their forecasts for the federal funds rate at the end of 2024 and 2025 were both 0.50 percent higher.

Why were members of the FOMC signaling that they expected to hold their target for the federal funds rate higher for a longer period? The other economic projections in the tables provide a clue. In September, the members expected that real GDP growth would be higher and the unemployment rate would be lower than they had expected in June. Stronger economic growth and a tighter labor market seemed likely to require them to maintain a contractionary monetary policy for a longer period if the inflation rate was to return to their 2.0 percent target. Note that the members didn’t expect that the inflation rate would return to their target until 2026.