
Join author Glenn Hubbard & Tony O’Brien in their first Sprint 2023 podcast where they revisit inflation as the major topic facing our country, our economy, and our classrooms. Glenn & Tony discuss the Federal Reserve response and the outlook for the economy. While rates have continued to move up, is a soft-landing still possible?
Author: hubbardobrieneconomics
Bad News from the Congressional Budget Office
In 1974, Congress created the Congressional Budget Office (CBO). The CBO was given the responsibility of providing Congress with impartial economic analysis as it makes decisions about the federal government’s budget. One of the most widely discussed reports the CBO issues is the Budget and Economic Outlook. The report provides forecasts of future federal budget deficits and changes in the federal government’s debt that the budget deficits will cause. The CBO’s budget and debt forecasts rely on the agency’s forecasts of future economic conditions and assumes that Congress will make no changes to current laws regarding taxing and spending. (We discuss this assumption further below.)
On February 15, the CBO issued its latest forecasts. The forecasts showed a deterioration in the federal government’s financial situation compared with the forecasts the CBO had issued in May 2022. (You can find the full report here.) Last year, the CBO forecast that the federal government’s cumulative budget deficit from 2023 through 2032 would be $15.7 trillion. The CBO is now forecasting the cumulative deficit over the same period will be $18.8 trillion. The three main reason for the increase in the forecast deficits are:
1. Congress has increased spending—particularly on benefits for military veterans.
2) Cost-of-living adjustments for Social Security and other government programs have increased as a result of higher inflation.
3) Interest rates on Treasury debt have increased as a result of higher inflation.
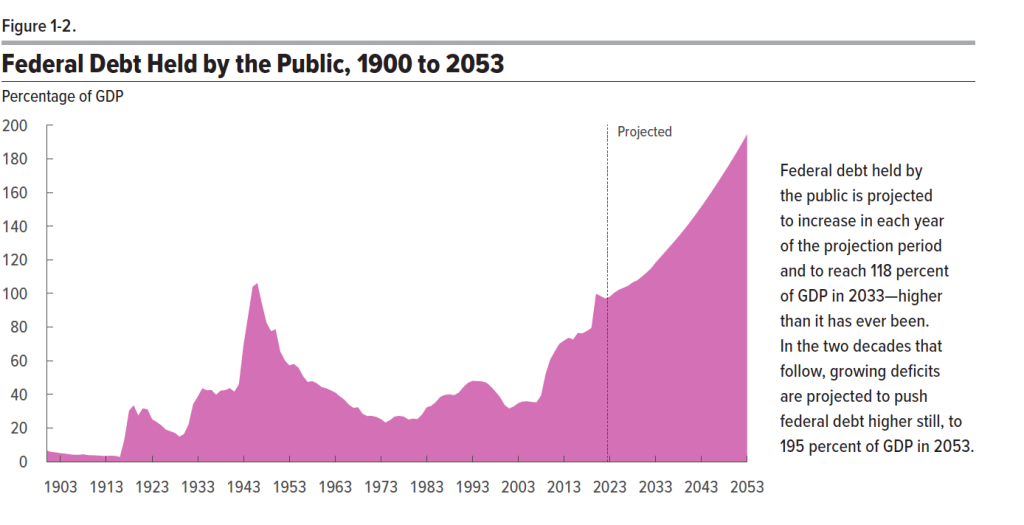
The CBO forecasts that federal debt held by the public will increase from 98 percent of GDP in 2023 to 118 percent in 2033 and eventually to 198 percent in 2053. Note that economists prefer to measure the size of the debt relative to GDP rather than in as absolute dollar amounts for two main reasons: First, measuring debt relative to GDP makes it easier to see how debt has changed over time in relation to the growth of the economy. Second, the size of debt relative to GDP makes it easier to gauge the burden that the debt imposes on the economy. When debt grows more slowly than the economy, as measured by GDP, crowding effects are likely to be relatively small. We discuss crowding out in Macroeconomics, Chapter 10, Section 10.2 and Chapter 16, Section 16. 5 (Economics, Chapter 20, Section 20.2 and Chapter 26, Section 26.5). The two most important factors driving increases in the ratio of debt to GDP are increased spending on Social Security, Medicare, and Medicaid, and increased interest payments on the debt.
The following figure is reproduced from the CBO report. It shows the ratio of debt to GDP with actual values for the period 1900-2022 and projected values for the period 2023-2053. Note that the only other time the ratio of debt to GDP rose above 100 percent was in 1945 and 1946 as a result of the large increases in federal government spending required to fight World War II.
The increased deficits and debt over the next 10 years are being driven by government spending increasing as a percentage of GDP, while government revenues (which are mainly taxes) are roughly stable as a percentage of GDP. The following figure from the report shows actual federal outlays and revenues as a percentage of GDP for the period 1973-2022 and projected outlays and revenues for the period 2023-2033. Note that from 1973 to 2022, outlays averaged 21.0 percent of GDP and revenues averaged 17.4 percent of GDP, resulting in an average deficit of 3.6 percent of GDP. By 2033, outlays are forecast to rise to 24.9 percent of GDP–well above the 1973-2022 average–whereas revenues are forecast to be only 18.1 percent, for a forecast deficit of 6.8 percent of GDP.

The increase in outlays is driven primarily by increases in mandatory spending, mainly spending on Social Security, Medicare, Medicaid, and veterans’ benefits and increases in interest payments on the debt. The CBO’s forecast assumes that discretionary spending will gradually decline over the next 10 years as percentage of GDP. Discretionary spending includes federal spending on defense and all other government programs apart from those, like Social Security, where spending is mandated by law.
To avoid the persistent deficits, and increasing debt that results, Congress would need to do one (or a combination) of the following:
1. Reduce the currently scheduled increases in mandatory spending (in political discussions this alternative is referred to as entitlement reform because entitlements is another name for manadatory spending).
2. Decrease discretionary spending, the largest component of which is defense spending.
3. Increases taxes.
There doesn’t appear to be majority support in Congress for taking any of these steps.
The CBO’s latest forecast seems gloomy, but may actually understate the likely future increases in the federal budget deficit and federal debt. The CBO’s forecast assumes that future outlays and taxes will occur as indicated in current law. For example, the forecast assumes that many of the tax cuts Congress passed in 2017 will expire in 2025 as stated in current law. Many political observers doubt that Congress will allow the tax cuts to expire as scheduled because to do so would result in increases in individual income taxes for most people. (Here is a recent article in the Washington Post that discusses this point. A subscription may be required to access the full article.) The CBO also assumes that defense spending will not increase beyond what is indicated by current law. Many political observers believe that, in fact, Congress may feel compelled to substantially increase defense spending as a result of Russia’s invasion of Ukraine in February 2022 and the potential military threat posed by China.
The CBO forecast also assumes that the U.S. economy won’t experience a recession between 2023 and 2033, which is possible but unlikely. If the economy does experience a recession, federal outlays for unemployment insurance and other programs will increase and federal personal and corporate income tax revenues will fall. The CBO’s forecast also assumes that the interest rate on the 10-year Treasury note will be under 4 percent and that the federal funds rate will be under 3 percent (interest rates on short-term Treasury debt move closely with changes in the federal funds rate). If interest rates turn out to be higher than these forecasts, the federal government’s interest payments will increase, further increasing the deficit and the debt.
In short, the federal government is clearly facing the most difficult budgetary situation since World War II.
Mickey Leaving Class after Acing His Micro Midterm

Mark Zuckerberg … All Alone in the Metaverse?

In October 2021, Facebook founder Mark Zuckerberg did something unusual–he changed the name of the company from Facebook, Inc. to Meta Platforms, Inc. According to Zuckerberg, he did so because he said, “Over time I hope our company will be seen as a metaverse company.” What is the metaverse? Definitions differ, but it typically refers to software programs that allow people to access either augmented reality (AR) or virtual reality (VR) images and information.
In both AR and VR, people wear headsets, goggles, or glasses to see images and information displayed. In VR, you wear goggles and have to remain stationary because your whole field of vision is a digital projection, so if you walk around you run the risk of tripping over furniture or other obstacles. With AR, you can walk through the physical world because your goggles display only limited amounts of information.
For example, Peggy Johnson, CEO of Magic Leap describes the device her firm sells this way: “You wear it over your eyes. You can actually think of it as a computer on your eyes. And you still see your physical world around you, but we place digital content very smartly in that physical world.” Among other uses, Magic Leap’s device can help to train a worker to use a new piece of equipment by overlaying a virtual version of the equipment over the actual piece of equipment. The virtual version would place instructions in the worker’s field of view. That worker would be in the metaverse.
While Meta has been selling Oculus AR headsets, Zuckerberg has focused more on VR than on AR. An article in the Wall Street Journal described the VR metaverse that Zuckerberg is hoping to help build: “Eventually, the idea is that people will be able to do almost anything in the metaverse: go shopping, attend school, participate in work meetings.” They would do these things while sitting at their desk or armchair. Meta’s first significant VR product was Horizon Worlds. On Horizon, after choosing an avatar, or virtual figure that represents you, you can shop, play games, or hang out with other people. You enter Horizon by using Meta’s Quest VR headset, which has a price of $400 to $700, depending on the headset’s configuration. Meta set a goal of having 500,000 monthly users of Horizon by the end of 2022 but ended the year with only around 200,000 active users.
Horizon’s main problem seems to have been that the app was subject to large network externalities. As we discuss in Chapter 10, Section 10.3 of Economics and Microeconomics, network externalities describe the situation in which the usefulness of a product increases with the number of consumers who use it. The Horizon app is enjoyable to use only if many other people are using it. But because few people regularly use the app, many new users don’t find it enjoyable and soon stop using it. According to an article in the Wall Street Journal, in late 2022, “Most visitors to Horizon generally don’t return to the app after the first month … there are rarely any girls in the Hot Girl Summer Rooftop Pool Party, and in Murder Village there is often no one to kill. Even the company’s showcase worlds… are mostly barren of users.” Reality Labs, the division of Meta in charge of Horizon, the Quest headset, and other metaverse projects, had total losses of $27 billion by the end of 2022. The losses were partly the result of Meta selling Quest headsets for a price below the cost of producing them in an attempt to get more people to use Horizon.
Zuckerberg peisists in believing that the firm’s future lies with the metaverse and continues to spend billions on metaverse projects. Investors aren’t convinced that this strategy will work because, as an article on economist.com put it in early 2023: “Few people are burning to migrate to the metaverse.” As investors’ became more skeptical of Zuckerberg’s strategy, Meta’s stock price declined by more than half between the fall of 2021 and early 2023. To be successful in its metaverse strategy, Meta will eventually have to attract enough buyers of its Quest headsets and users of its Horizon app to begin taking advantage of network externalities.
Source: Dylan Croll, “Magic Leap CEO Peggy Johnson on the AR revolution,” news.yahoo. com, January 4, 2023; “Things Are Looking Up for Meta,” economist.com, February 3, 2023; “How Much Trouble Is Mark Zuckerberg In?” economist.com, October 16, 2022; Jeff Horwitz, Salvador Rodriguez, and Meghan Bobrowsky, “Company Documents Show Meta’s Flagship Metaverse Falling Short,” Wall Street Journal, October 15, 2022; Sarah E. Needleman, “Facebook Changes Company Name to Meta in Focus on Metaverse,” Wall Street Journal, October 28, 2021; Meghan Bobrowsky and Sarah E. Needleman, “What is the Metaverse? The Future Vision for the Internet,” Wall Street Journal, April 28, 2022.
If You Have Some Cash to Spare ….

you can bid for Paul Samuelson’s Nobel Prize Medal here. Note that at the time of posting the minimum bid required was $495,000.
You can read a brief biography of Samuelson on the Nobel site here. You can read the lecture Samuelson delivered on the occasion of being awarded the price here. (Note that the lecture contains technical material.)
11/17/22 Podcast – Authors Glenn Hubbard & Tony O’Brien discuss inflation, the Fed’s Response, FTX collapse, and also share thoughts on economics themes in holiday movies!
In the Face of Hyperinflation, Some People in Argentina Don’t Save Currency, They Save … Bricks

Argentina’s Argentina’s Economy Minister Sergio Massa coming from a meeting in Washington, DC with the International Monetary Fund to discuss the country’s hyperinflation. Photo from the Wall Street Journal.
Argentina has been through several periods of hyperinflation during with the price level has increased more than 50 percent per month. The following figure shows the inflation rate as measured by the percentage change in the consumer price index from the previous month for since the beginning of 2018. The inflation rate during these years has been volatile, being greater than 50 percent per month during several periods, including staring in the spring of 2022. High rates of inflation have become so routine in Argentina that an article in the Wall Street Journal quoted on store owner as saying, “Here 40% [inflation] is normal. And when we get past 50%, it doesn’t scare us, it simply bothers us.”

As we discuss in Macroeconomics, Chapter 14, Section 14.5 (Economics, Chapter 24, Section 24.5 ), when an economy experiences hyperinflation, consumers and businesses hold the country’s currency for as brief a time as possible because the purchasing power of the currency is declining rapidly. As we noted in the chapter, in some countries experiencing high rates of inflation, consumers and businesses buy and sell goods using U.S. dollars rather than the domestic currency because the purchasing power of the dollar is more stable. This demand for dollars in countries experiencing high inflation rates is one reason why an estimated 80 percent of all $100 bills circulate outside of the United States.
The increased demand for U.S. dollars by people in Argentina is reflected in the exchange rate between the Argentine peso and the U.S. dollar. The following figure shows that at the beginning of 2018, one dollar exchanged for about 18 pesos. By November 2022, one dollar exchanged for about 159 pesos. The exchange rate shown in the figure is the official exchange rate at which people in Argentina can legally exchange pesos for dollars. In practice, it is difficult for many individuals and small firms to buy dollars at the official exchange rate. Instead, they have to use private currency traders who will make the exchange at an unofficial—or “blue”—exchange rate that varies with the demand and supply of pesos for dollars. A reporter for the Economist described his experience during a recent trip to Argentina: “Walk down Calle Lavalle or Calle Florida in the centre of Buenos Aires and every 20 metres someone will call out ‘cambio’ (exchange), offering to buy dollars at a rate that is roughly double the official one.”

People in Argentina are reluctant to deposit their money in banks, partly because the interest rates banks pay typically are lower than the inflation rate, causing the purchasing power of money deposited in banks to decline over time. People are also afraid that the government might keep them from withdrawing their money, which has happened in the past. As an alternative to depositing their money in banks, many people in Argentina buy more goods than they can immediately use and store them, thereby avoiding future price increases on these goods. The Wall Street Journalquoted a university student as saying: “I came to this market and bought as much toilet paper as I could for the month, more than 20 packs. I try to buy all [the goods] I can because I know that next month it will cost more to buy.”
Devon Zuegel, a U.S. software engineer and economics blogger who travels frequently to Argentina, has observed one unusual way that some people in Argentina save while experiencing hyperinflation:
“Bricks—actual bricks, not stacks of cash—are another common savings mechanism, especially for working-class Argentinians. The value of bricks is fairly stable, and they’re useful to a family building out their house. Argentina doesn’t have a mortgage industry, and thus buying a pallet of bricks each time you get a paycheck is an effective way to pay for your home in installments. (Bricks aren’t fully monetized, in that I don’t think people buy bricks and then sell them later, so people only use this method of saving when they actually have something they want to use the bricks for.)”
Sources: “Sergio Massa Is the Only Thing Standing Between Argentina and Chaos,” economist. com, October 13, 2022; Devon Zuegel, “Inside Argentina’s Currency Exchange Black Markets,” devonzuegel.com, September 10, 2022; Silvina Frydlewsky and Juan Forero, “Inflation Got You Down? At Least You Don’t Live in Argentina,” Wall Street Journal, April 25, 2022; and Federal Reserve Bank of St. Louis, FRED data set.
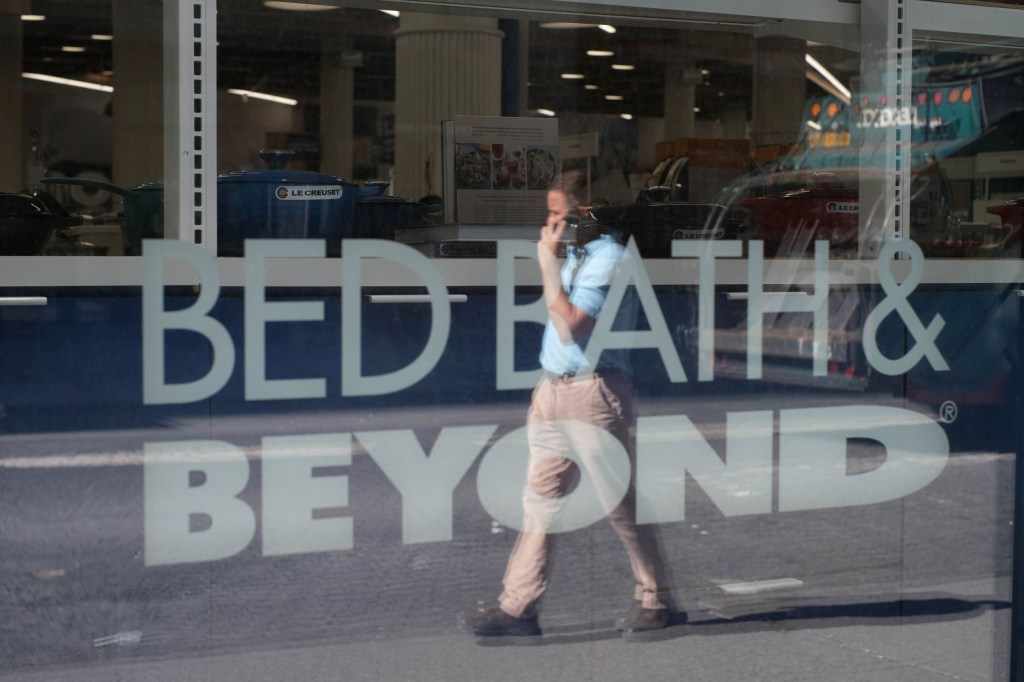
What Caused the Plunge in Sales at Bed Bath & Beyond?
In the Apply the Concept “Trying to Use the Apple Approach to Save J.C. Penney” in Chapter 10, Section 10.4 in both Microeconomics and Economics, we discussed how Ron Johnson had been successful as head of Apple’s retail stores but failed when he was hired as CEO of J. C. Penney. Insights from behavioral economics indicate that Johnson made a mistake in eliminating Penney’s previous strategy of keeping prices high but running frequent sales. Although Penney’s “every day prices” under Johnson were lower than they had been under the previous management, many consumers failed to recognize that fact and began shopping elsewhere.
Johnson’s experience may indicate the dangers of changing a firm’s long-standing business model. Customers at brick-and-mortar retail stores fall into several categories: Some people shop in a number of stores, depending on which store has the lowest price on the particular product they’re looking for; some shop only for products such as televisions or appliances that they hesitate to buy from Amazon or other online sites; while others shop primarily in the store that typically meets their needs with respect to location, selection of products, and pricing. It’s the last category of customer that was most likely to stop shopping at Penney because of Johnson’s new pricing policy because they were accustomed to primarily buying products that were on sale.
Bed Bath & Beyond was founded in 1971 by Warren Eisenberg and Leonard Feinstein. As the name indicates, it has focused on selling household goods—sometimes called “home goods”—such as small appliances, towels, and sheets. It was perhaps best known for mailing massive numbers of 20 percent off coupons, printed on thin blue cardboard and nicknamed Big Blue, to households nationwide. Although by 2019, the firm was operating more than 1,500 stores in the United States, some investors were concerned that Bed Bath & Beyond could be run more profitably. In March 2019, the firm’s board of directors replaced the current CEO with Mark Tritton who had helped make Target stores very profitable.
In an approach similar to the one Ron Johnson had used at J.C. Penney, Tritton cut back on the number of coupons sent out, reorganized the stores to reduce the number of different products available for sale, and replaced some name brand goods with so-called private-label brands produced by Bed Bath & Beyond. Unfortunately, Tritton’s strategy was a failure and the firm, which had been profitable in 2018, suffered losses each year between 2019 and 2022. The losses totaled almost $1.5 billion. In June 2022, the firm’s board of directors replaced Tritton with Sue Grove who had been serving on the board.
Why did Tritton’s strategy fail? Partly because in March 2020, the effects of the Covid-19 pandemic forced the closure of many Bed Bath & Beyond stores. Unlike some other chains, Bed Bath & Beyond’s web site struggled to fulfill online orders. The firm also never developed a system that would have made it easy for customers to order goods online and pick them up at the curb of their retail stores. That approach helped many competitors maintain sales during the pandemic. Covid-19 also disrupted the supply chains that Tritton was depending on to produce the private-label brands he was hoping to sell in large quantities.
But the larger problems with Tritton’s strategy would likely have hurt Bed Bath & Beyond even if there had been no pandemic. Tritton thought the stores were too cluttered, particularly in comparison with Target stores, so he reduced the number of products for sale. It turned out, though, that many of Bed Bath & Beyond’s most loyal customers liked searching through the piles of goods on the shelves. One customer was quoted as saying, “I used to find so many things that I didn’t need, that I’d end up buying anyway, like July 4th-themed corn holders.” Customers who preferred to shop in less cluttered stores were likely to already be shopping elsewhere. And it turned out that many Bed Bath & Beyond customers preferred national brands and switched to shopping elsewhere when Tritton replaced those brands with private-label brands. Finally, many customers were accustomed to shopping at Bed Bath & Beyond shortly after receiving a Big Blue 20 percent off coupon. Sending out fewer coupons meant fewer trips to Bed Bath & Beyond by those customers.
In a manner similar to what happened to Johnson in his overhaul of the Penney department stores, Tritton’s changes to Bed Bath & Beyond’s business model caused many existing customer to shop elsewhere while attracting relatively few new customers. An article in the Wall Street Journal quoted an industry analyst as concluding: “Mark Tritton entered the business and ripped up its playbook. But the strategy he replaced it with was not tested and nowhere near sharp enough to compensate for the loss of traditional customers.”
Sources: Jeanette Neumann, “Bed Bath & Beyond Traced an Erratic Path to Its Current Crisis,” bloomberg.com, September 29, 2022; Kelly Tyko, “What to expect at Bed Bath & Beyond closing store sales,” axios.com September 22, 2022; Inti Pacheco and Jodi Xu Klein, “Bed Bath & Beyond to Close 150 Stores, Cut Staff, Sell Shares to Raise Cash,” Wall Street Journal, August 31, 2022; Suzanne Kapner and Dean Seal, “Bed Bath & Beyond CEO Mark Tritton Exits as Sales Plunge,” Wall Street Journal, June 29, 2022; Suzanne Kapner, “Bed Bath & Beyond Followed a Winning Playbook—and Lost,” Wall Street Journal, July 23, 2022; and Ron Lieber, “An Oral History of the World’s Biggest Coupon,” New York Times, November 3, 2021.
U.S. Carbon Dioxide Emissions in a Global Context
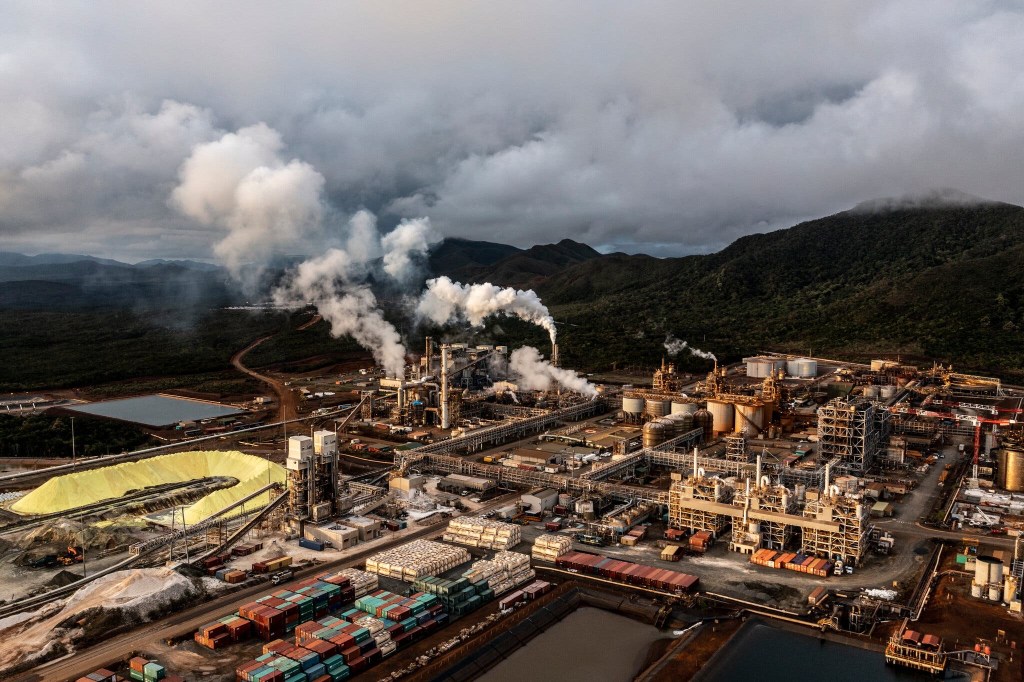
As we discuss in Microeconomics and Economics, Chapter 5, Section 5.3, carbon dioxide (CO2) emissions contribute to climate change, including the increases in temperatures that have been experienced worldwide. We’ve found that students are interested in seeing U.S. CO2 emissions in a global context.
The first of the following figures shows for the years 1960 to 2020, the total amount of CO2 emissions by the United States, China, India, the 28 countries in the European Union, lower-middle-income countries (including India, Nigeria, and Vietnam), and upper-middle-income countries (including China, Brazil, and Argentina). The second of the figures shows the percentage of total world CO2 accounted for by each of the three individual countries and by the indicated groups of countries. in the United States and in the countries of the European Union both total emissions and the percentage of total world emissions have been declining over the past 15 years. Emissions have been increasing in China, India, and in middle-income countries. The figures are from the Our World in Data website (ourworldindata.org). (Note that the reductions in emissions during 2020 largely reflect the effects of the slowdown in economic activity as a result of the Covid-19 pandemic rather than long-term trends in emissions.)
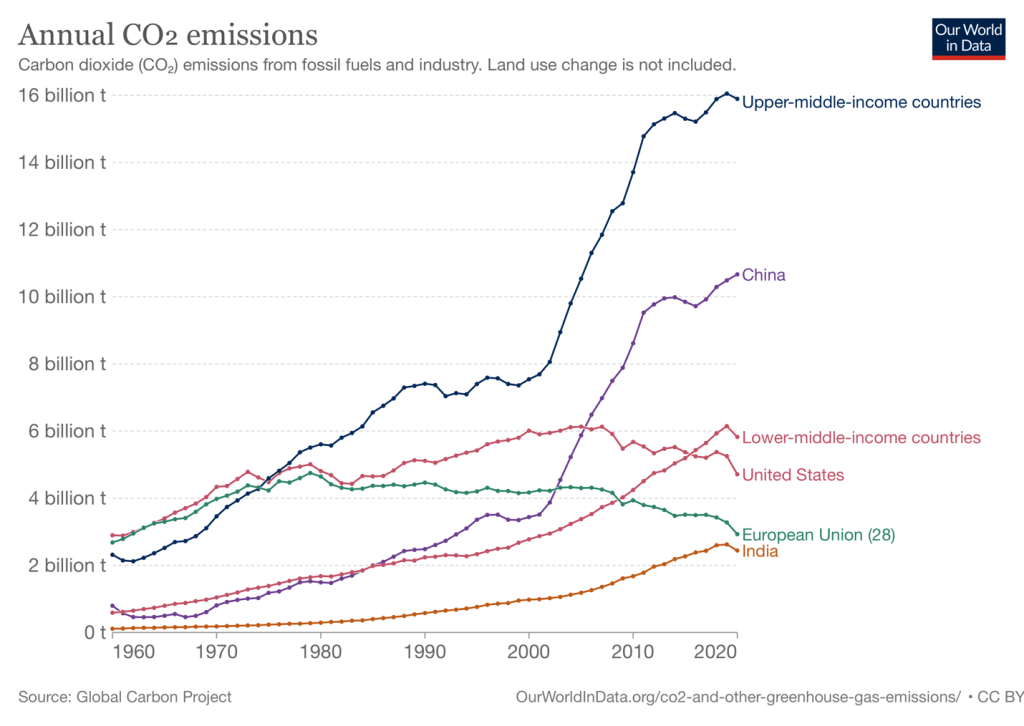
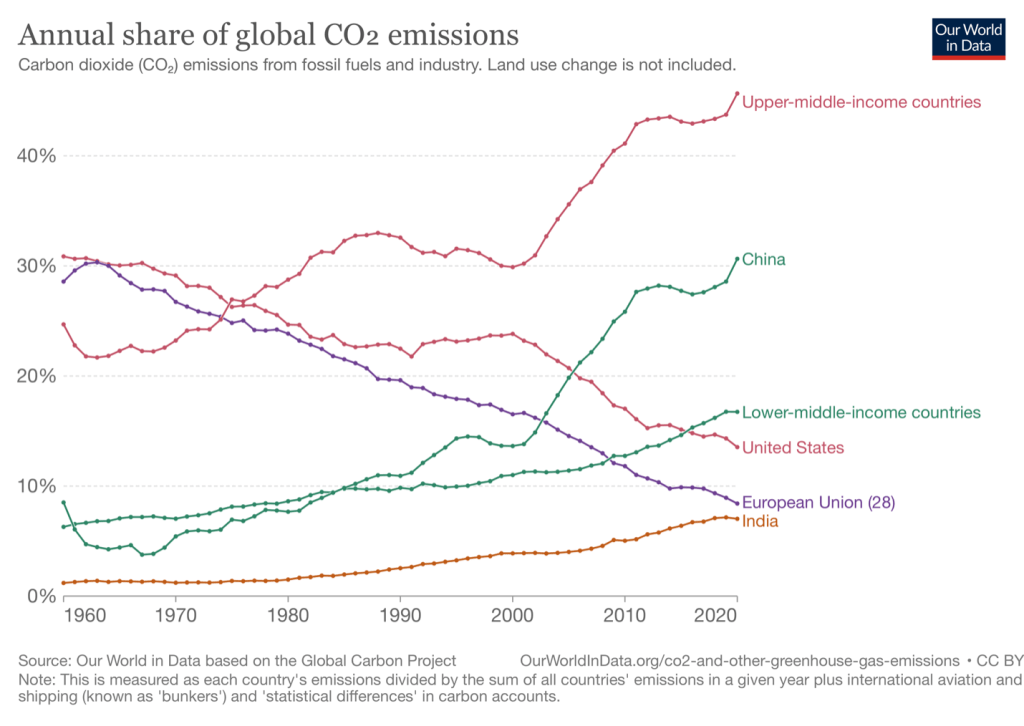
Governments in many countries have attempted to slow the pace of climate change by enacting policies to reduce CO2emissions. (According to estimates by the U.S. Environmental Protection Agency, CO2 accounts for about 76 percent of all emissions worldwide of greenhouse gases that contribute to climate change. Methane and nitrous oxide, mainly from agricultural activity, make up most of the rest of greenhouse gas emissions.) In August 2022, Congress and President Biden enacted additional measures aimed at slowing climate change. Included among these measures were government subsidies to firms and households to use renewable energy such as rooftop solar panels, tax rebates for some buyers of certain electric vehicles, and funds for utilities to develop power sources such as wind and solar that don’t emit CO2. The measures have been estimated to reduce U.S. greenhouse gas emissions by somewhere between 6 percent and 15 percent. Because the United States is responsible for only about 14 percent of annual global greenhouse gas emissions, the measures would likely reduce global emissions by only about 2 percent.
The figures shown above make this result unsurprising. Because the United States is the source of only a relatively small percentage of global greenhouse emissions, reductions in U.S. emissions can result in only small reductions in global emissions. Although many policymakers and economists believe that the marginal benefit from these reductions in U.S. emissions exceed their marginal cost, the reductions can’t by themselves do more than slow the rate of climate change. A key reason that India, China, and other middle income countries have accounted for increasing quantities of greenhouse gases is that they rely much more heavily on burning coal than do the United States, the countries in the European Union, and other high-income countries. Utilities switching to generating electricity by burning coal rather than by burning natural gas has been a key source of reductions in greenhouse gas emissions in the United States.
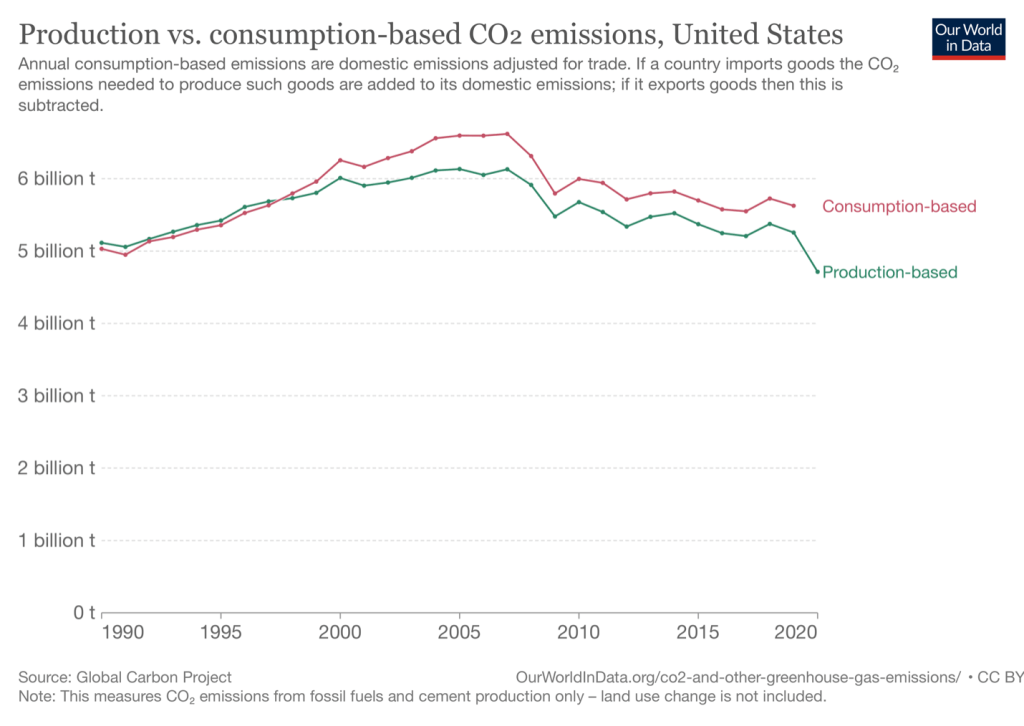
The two figures above measure a country’s contribution to CO2 emissions by looking at the quantity of emissions generated by production within the country. But suppose instead that we look at the quantity of CO2 emitted during the production of the goods consumed within the country? In that case, we would allocate to the United States CO2 emitted during the product of a good, such as a television or a shirt, that was produced in China or another foreign country but consumed in the United States.
For the United States, as the following figure shows it makes only a small difference whether we measure CO2emissions on the basis of production of goods and services or on the basis of consumption of goods and services. U.S. emissions of CO2 are about 7 percent higher when measured on a consumption basis rather than on a production basis. By both measures, U.S. emissions of CO2 have been generally declining since about 2007. (1990 is the first year that these two measures are available.)
Sources: Hannah Ritchie, Max Roser and Pablo Rosado, “CO₂ and Greenhouse Gas Emissions,” OurWorldInData.org, https://ourworldindata.org/co2-and-other-greenhouse-gas-emissions; Greg Ip, “Inflation Reduction Act’s Real Climate Impact Is a Decade Away,” Wall Street Journal, August 24, 2022; Lisa Friedman, “Democrats Designed the Climate Law to Be a Game Changer. Here’s How,” New York Times, August 22, 2022; Hannah Ritchie, “How Do CO2 Emissions Compare When We Adjust for Trade?” ourworldindata.org, October 7, 2019; and United States Environmental Protection Agency, “Global Greenhouse Gas Emissions Data,” epa.gov, February 22, 2022.
Will Changes to the Federal Student Loan Program Unintentionally Give Colleges an Incentive to Increase Tuition?
In Chapter 1, Section 1.1, one of our three key economic ideas is that people respond to economic incentives. Government policy can change the economic incentives that people face. Sometimes a government policy can have unintended consequences because it changes economic incentives in a way that policymakers didn’t anticipate. Some economists argue that this was the case with the Biden administration’s decision to change the federal student loan program.
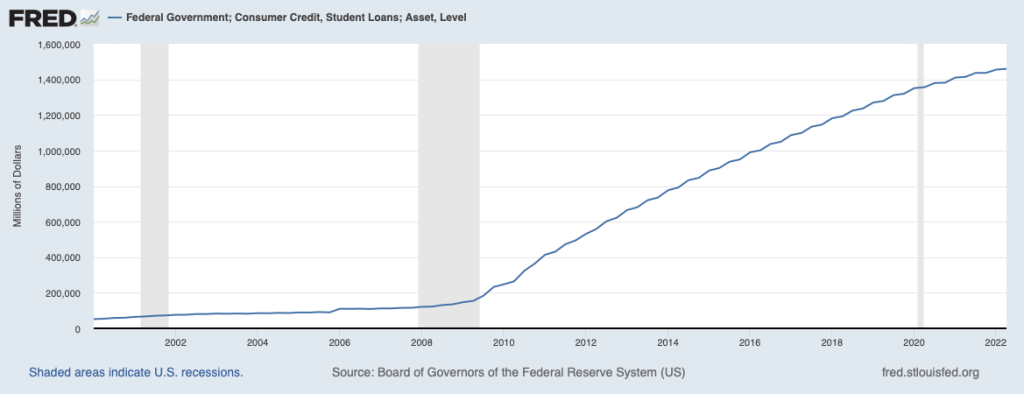
In recent years, college students and their parents have rapidly increased their loan debt. The following figure shows the total value of outstanding student loans beginning in 2000. Student loan debt increased from about $52 billion in 2000 to about $1.6 trillion in 2022. Or, put another way, for every dollar of loan debt students and their parents owed in 2000, they owed more than 27 dollars of debt in 2022. In 2022, the average borrower owed about $37,000.
During the Covid–19 pandemic, the Trump and Biden administrations allowed people with student loans to suspend making payments on them. The payment moratorium began March 31, 2020 and is scheduled to end on December 31, 2022. Student loan payments are often the largest item in the budgets of recent college graduates. Some economists argue that the need to make student loan payments has made it harder for young adults to accumulate the down payments necessary to buy homes. As a result, young adults are likely to delay forming families, thereby reducing their need to move from an apartment to a house. In 1967, about 83 percent of people aged 25 to 34 lived with a spouse or partner, while in 2021 only about 54 percent did.
Some economists doubt that student loan debt explains the delay in young adults forming families and buying houses. But many policymakers have seen reducing the burden of student loan debt on young adults as an important issue. In August 2022, President Joe Biden announced a plan under which individuals earning less than $125,000 per year would have up to $10,000 in student loan debt cancelled. Borrowers with Pell grants would have up to another $10,000 cancelled. A second part of the plan involved changes to the federal government’s income-driven repayment (IDR) program. As a result of these changes, lower and middle-income student loan borrowers will be able to more easily have their loan balances canceled. With some exceptions, borrowers who have loans of $12,000 or less will have their loans canceled after making payments for 10 years, rather than the current 20 years. The annual payments for most borrowers using the IDR program will be lowered to 5 percent of their income above about $33,000 per year, rather than the previous 10 percent.
Some policymakers objected to President Biden’s plan, arguing that it was unconstitutional because it was the result of a presidential executive order rather than the result of Congressional legislation. Many economists focused on a different potential problem with the plan: the economic incentives that might result from the changes to the IDR program. The intention of these changes was to reduce the burden on people who currently have student loans, but the changes also affected the economic incentives facing students applying for loans and colleges in deciding the level of tuition to charge.
In an article on the Brookings Institution website, Adam Looney, a professor of finance at the University of Utah, argued that because of the changes to the IDR program, the typical college student could expect to pay back only about 50 percent of the amount borrowed. Before the changes, the Congressional Budget Office had estimated that the typical student would end up paying more than 100 percent of the amount borrowed because the student would have to pay interest on the loan amount. Looney argues that students and their parents will have an incentive to borrow more because they will expect to pay back only half of the amount borrowed. In particular, he notes:
“A large share of student debt is not used to pay tuition, but is given to students in cash for rent, food, and other expenses…. While students certainly need to pay rent and buy food while in school, under the administration proposal a student can borrow significant amounts for ‘living expenses,’ deposit the check in a bank account, and not pay it all back…. Some people will use loans like an ATM, which will be costly for taxpayers and is certainly not the intended use of the loans.”
Sylvain Catherine, a professor of finance at the University of Pennsylvania’s Wharton School, makes a similar argument: “How can we not anticipate the distortionary effects of such a policy? Student will be encouraged to take more debt since they will not have to repay the marginal dollar, and colleges will have an incentive to further increase tuition.” An article in the New York Times noted that taxpayers will be responsible for the value of student loans that aren’t paid back: “By offering more-generous educational subsidies, the government may be creating a perverse incentive for both schools and borrowers, who could begin to pay even less attention to the actual price tag of their education—and taxpayers could be left footing more of the bill.”
It’s too early to judge the extent to which students, their families, and colleges will react to the changed incentives in President Biden’s student debt relief plan. But because the plan changes economic incentives, it may result in consequences not intended by President Biden and his advisers. (Note that the lawsuits challenging the plan’s constitutionality have also not yet been resolved.)
Sources: Adam Looney, “Biden’s Income-Driven Repayment Plan Would Turn Student Loans into Untargeted Grants,” brookings.edu, September 15, 2022; Gabriel T. Rubin and Amara Omeokwe, “Biden’s Student-Debt-Forgiveness Plan May Cost Up to $1 Trillion, Challenging Deficit Goals,” Wall Street Journal, September 5, 2022; Stacey Cowley, “Student Loan Subsidies Could Have Dangerous, Unintended Side Effects,” New York Times, September 19, 2022; Ron Lieber, “Why Aren’t Student Loans Simple? Because This Is America,” New York Times, September 3, 2022; Congressional Budget Office, “Federal Student Loan Programs, Baseline Projections,” May 2022; U.S. Census Bureau, “Historical Living Arrangements of Adults,” Table AD-3, November 2021; and Federal Reserve Bank of St. Louis FRED data set.
