
As we discuss in Microeconomics and Economics, Chapter 5, Section 5.3, carbon dioxide (CO2) emissions contribute to climate change, including the increases in temperatures that have been experienced worldwide. We’ve found that students are interested in seeing U.S. CO2 emissions in a global context.
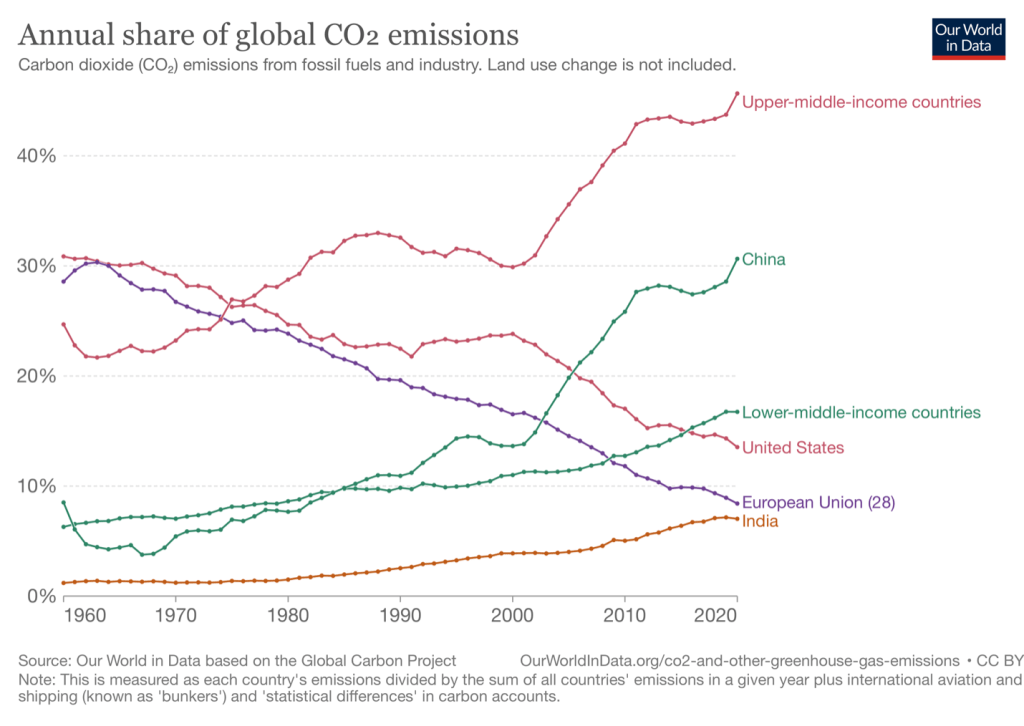
The first of the following figures shows for the years 1960 to 2020, the total amount of CO2 emissions by the United States, China, India, the 28 countries in the European Union, lower-middle-income countries (including India, Nigeria, and Vietnam), and upper-middle-income countries (including China, Brazil, and Argentina). The second of the figures shows the percentage of total world CO2 accounted for by each of the three individual countries and by the indicated groups of countries. in the United States and in the countries of the European Union both total emissions and the percentage of total world emissions have been declining over the past 15 years. Emissions have been increasing in China, India, and in middle-income countries. The figures are from the Our World in Data website (ourworldindata.org). (Note that the reductions in emissions during 2020 largely reflect the effects of the slowdown in economic activity as a result of the Covid-19 pandemic rather than long-term trends in emissions.)
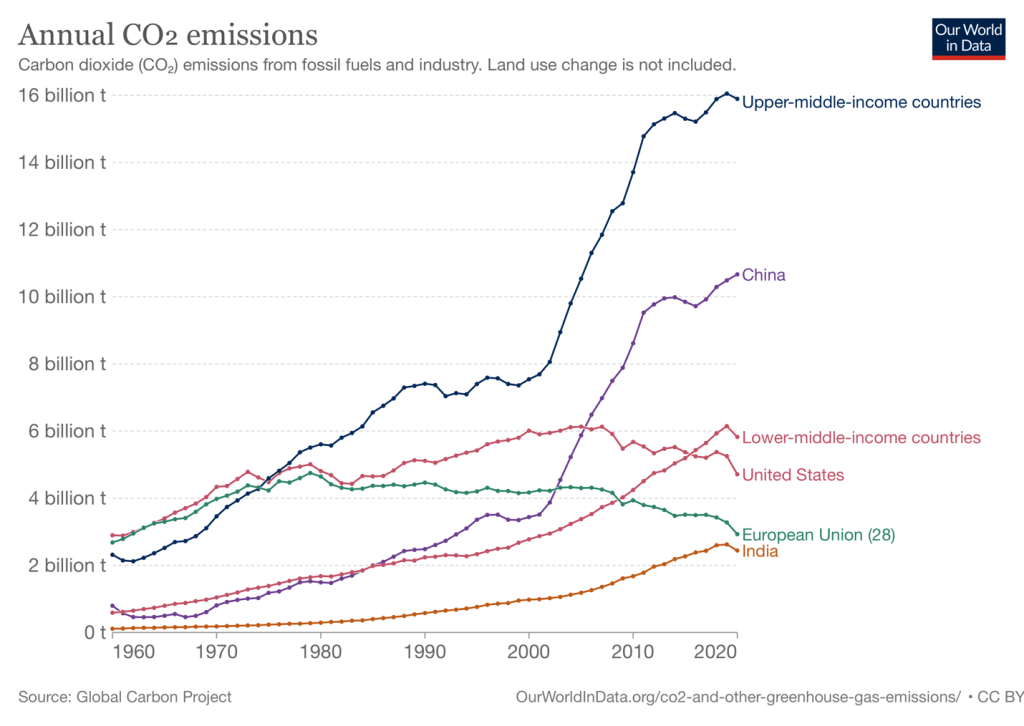
Governments in many countries have attempted to slow the pace of climate change by enacting policies to reduce CO2emissions. (According to estimates by the U.S. Environmental Protection Agency, CO2 accounts for about 76 percent of all emissions worldwide of greenhouse gases that contribute to climate change. Methane and nitrous oxide, mainly from agricultural activity, make up most of the rest of greenhouse gas emissions.) In August 2022, Congress and President Biden enacted additional measures aimed at slowing climate change. Included among these measures were government subsidies to firms and households to use renewable energy such as rooftop solar panels, tax rebates for some buyers of certain electric vehicles, and funds for utilities to develop power sources such as wind and solar that don’t emit CO2. The measures have been estimated to reduce U.S. greenhouse gas emissions by somewhere between 6 percent and 15 percent. Because the United States is responsible for only about 14 percent of annual global greenhouse gas emissions, the measures would likely reduce global emissions by only about 2 percent.
The figures shown above make this result unsurprising. Because the United States is the source of only a relatively small percentage of global greenhouse emissions, reductions in U.S. emissions can result in only small reductions in global emissions. Although many policymakers and economists believe that the marginal benefit from these reductions in U.S. emissions exceed their marginal cost, the reductions can’t by themselves do more than slow the rate of climate change. A key reason that India, China, and other middle income countries have accounted for increasing quantities of greenhouse gases is that they rely much more heavily on burning coal than do the United States, the countries in the European Union, and other high-income countries. Utilities switching to generating electricity by burning coal rather than by burning natural gas has been a key source of reductions in greenhouse gas emissions in the United States.
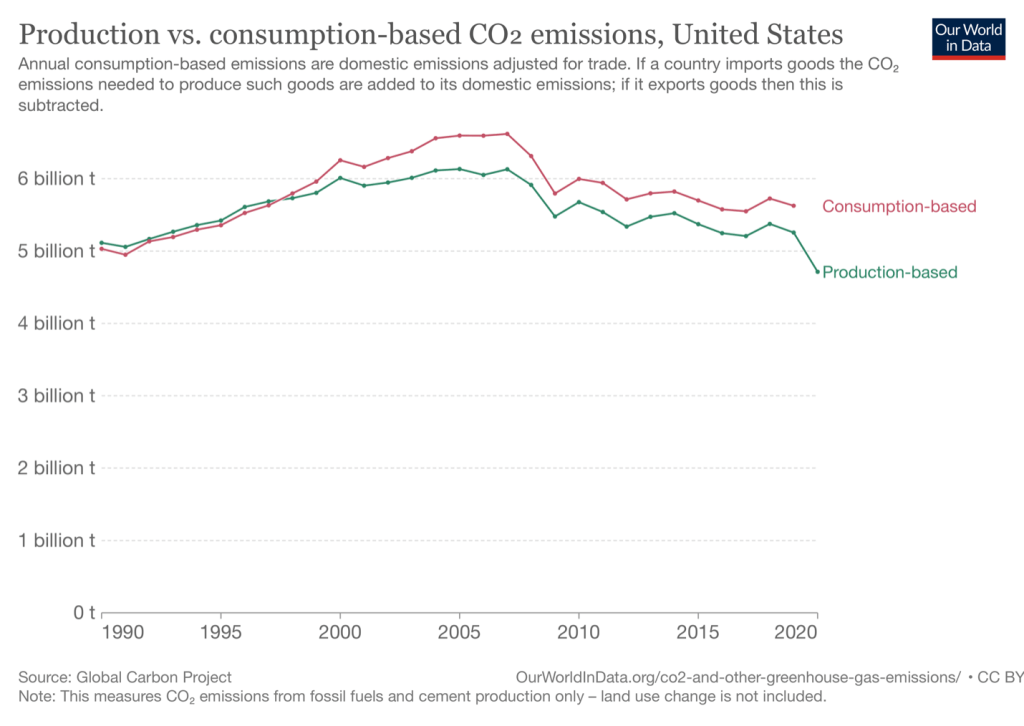
The two figures above measure a country’s contribution to CO2 emissions by looking at the quantity of emissions generated by production within the country. But suppose instead that we look at the quantity of CO2 emitted during the production of the goods consumed within the country? In that case, we would allocate to the United States CO2 emitted during the product of a good, such as a television or a shirt, that was produced in China or another foreign country but consumed in the United States.
For the United States, as the following figure shows it makes only a small difference whether we measure CO2emissions on the basis of production of goods and services or on the basis of consumption of goods and services. U.S. emissions of CO2 are about 7 percent higher when measured on a consumption basis rather than on a production basis. By both measures, U.S. emissions of CO2 have been generally declining since about 2007. (1990 is the first year that these two measures are available.)
Sources: Hannah Ritchie, Max Roser and Pablo Rosado, “CO₂ and Greenhouse Gas Emissions,” OurWorldInData.org, https://ourworldindata.org/co2-and-other-greenhouse-gas-emissions; Greg Ip, “Inflation Reduction Act’s Real Climate Impact Is a Decade Away,” Wall Street Journal, August 24, 2022; Lisa Friedman, “Democrats Designed the Climate Law to Be a Game Changer. Here’s How,” New York Times, August 22, 2022; Hannah Ritchie, “How Do CO2 Emissions Compare When We Adjust for Trade?” ourworldindata.org, October 7, 2019; and United States Environmental Protection Agency, “Global Greenhouse Gas Emissions Data,” epa.gov, February 22, 2022.
