Photo courtesy of Lena Buonanno.
Wall Street Journal columnist Justin Lahart notes that when the Bureau of Labor Statistics (BLS) releases its monthly report on the consumer price index (CPI), the report “generates headlines, features in politicians’ speeches and moves markets.” When the Bureau of Economic Analysis (BEA) releases its monthly report “Personal Income and Outlays,” which includes data on the personal consumption expenditures (PCE) price index, there is much less notice in the business press or, often, less effect on financial markets. (You can see the difference in press coverage by comparing the front page of today’s online edition of the Wall Street Journal after the BEA released the latest PCE data with the paper’s front page on February 13 when the BLS released the latest CPI data.)
This difference in the weight given to the two inflation reports seems curious because the Federal Reserve uses the PCE, not the CPI, to determine whether it is achieving its 2 percent annual inflation target. When a new monthly measure of inflation is released much of the discussion in the media is about the effect the new data will have on the Federal Open Market Committee’s (FOMC) decision on whether to change its target for the federal funds rate. You might think the result would be greater media coverage of the PCE than the CPI. (The PCE includes the prices of all the goods and services included in the consumption component of GDP. Because the PCE includes the prices of more goods and services than does the CPI, it’s a broader measure of inflation, which is the key reason that the Fed prefers it.)
That CPI inflation data receive more media discussion than PCE inflation data is likely due to three factors:
- The CPI is more familiar to most people than the PCE. It is also the measure that politicians and political commentators tend to focus on. The media are more likely to highlight a measure of inflation that the average reader easily understands rather than a less familiar measure that would require an explanation.
- The monthly report on the CPI is typically released about two weeks before the monthly report on the PCE. Therefore, if the CPI measure of inflation turns out to be higher or lower than expected, the stock and bond markets will react to this new information on the value of inflation in the previous month. If the PCE measure is roughly consistent with the CPI measure, then the release of new data on the PCE measure contains less new information and, therefore, has a smaller effect on stock and bond prices.
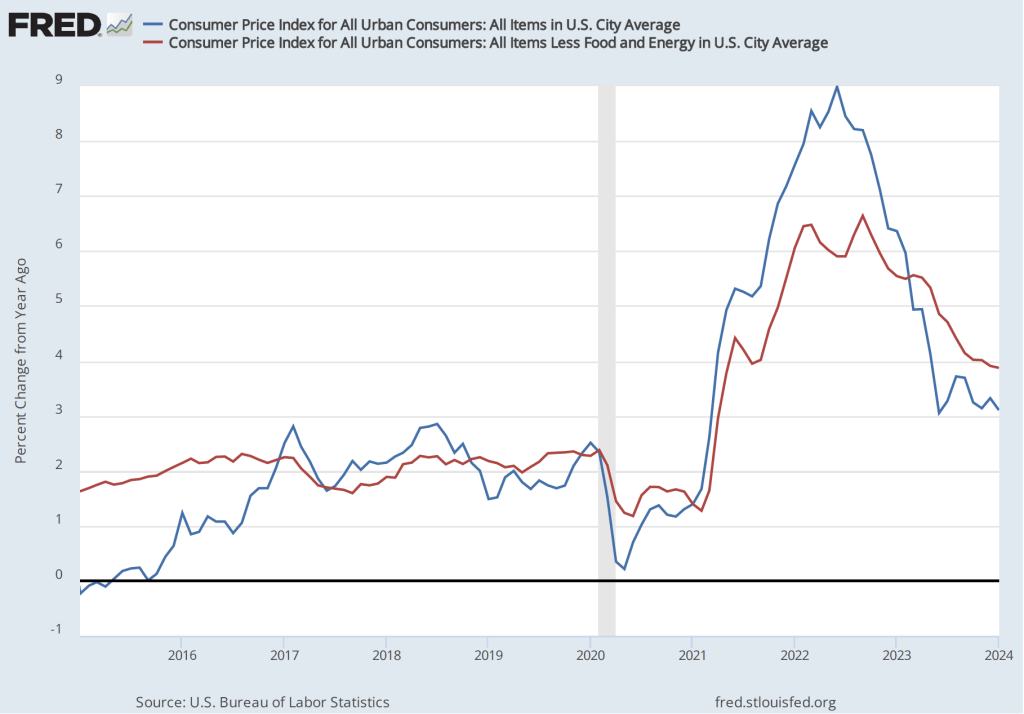
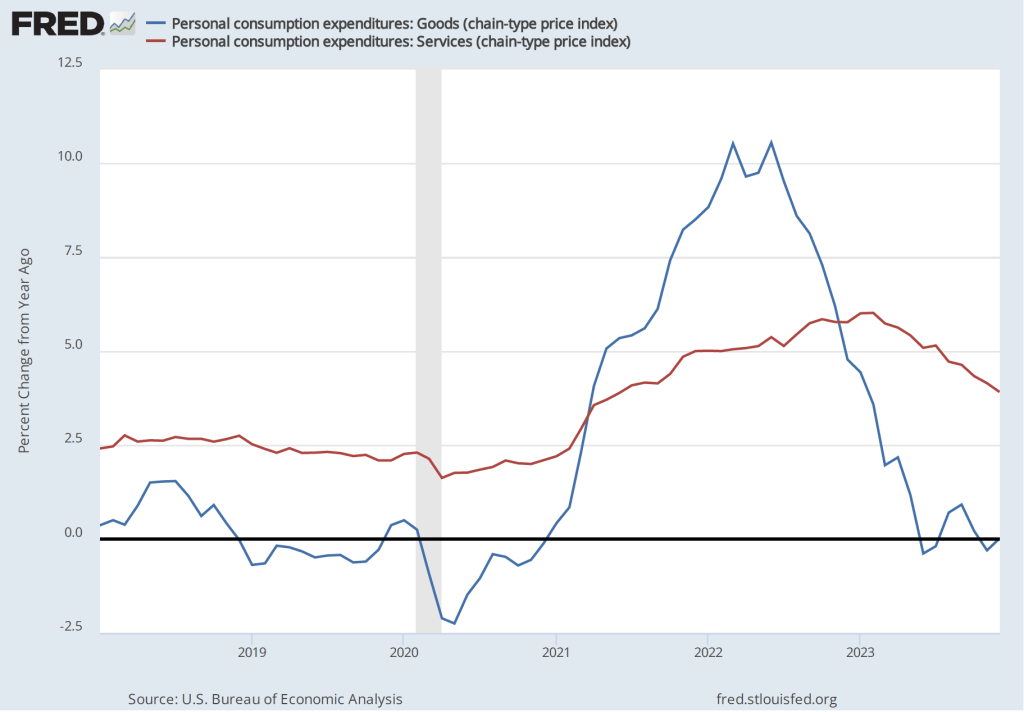
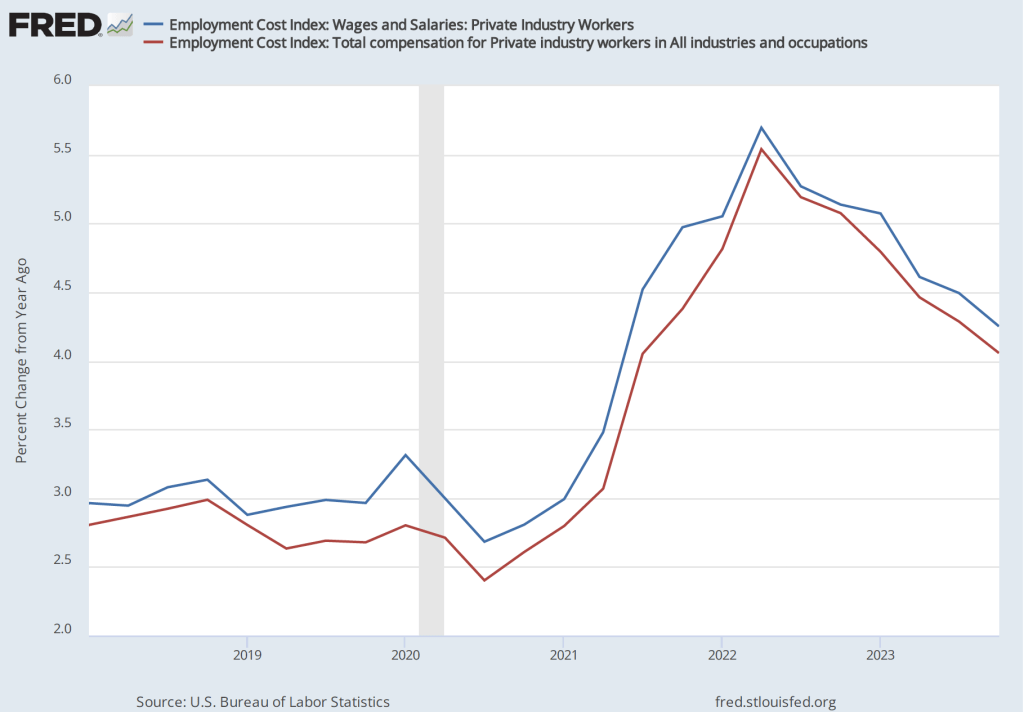
- Over longer periods, the two measures of inflation often move fairly closely together as the following figure shows, although CPI inflation tends to be somewhat higher than PCE inflation. The values of both series are the percentage change in the index from the same month in the previous year.

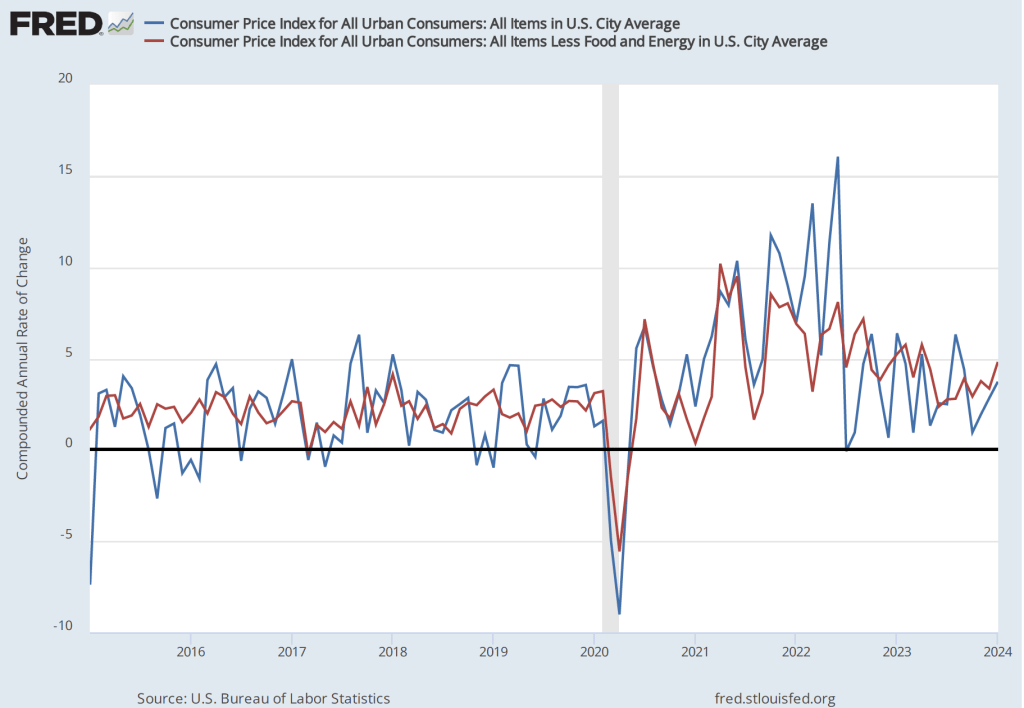
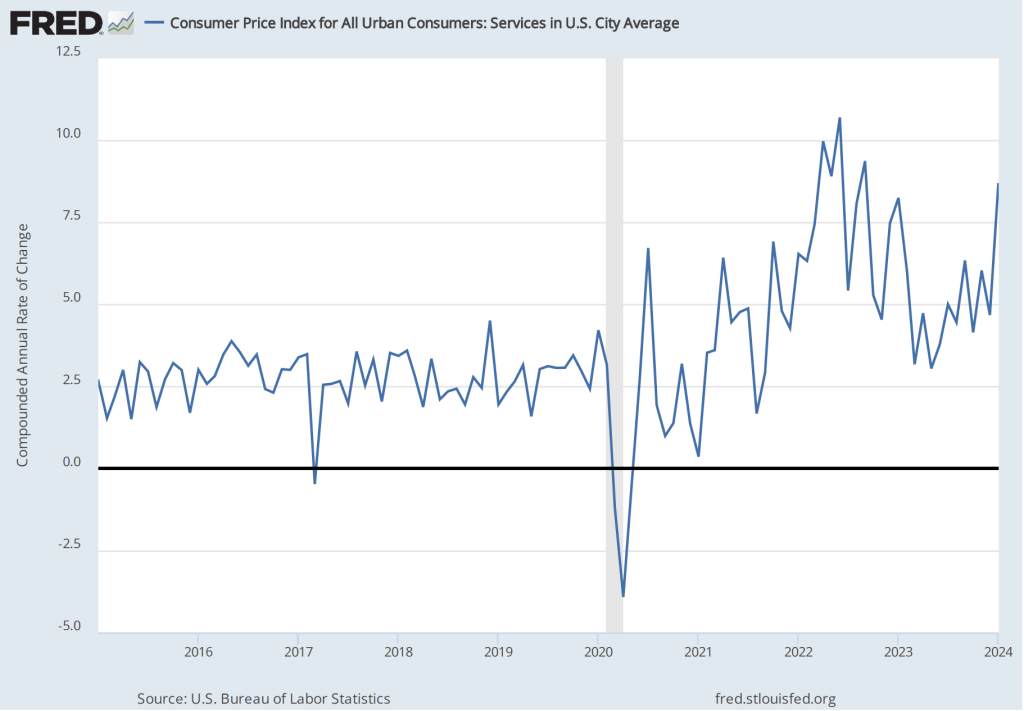
Turning to the PCE data for January released in the BEA’s latest “Personal Income and Outlays” report, the PCE inflation data were broadly consistent with the CPI data: Inflation in January increased somewhat from December. The first of the following figures shows PCE inflation and core PCE inflation—which excludes energy and food prices—for the period since January 2015 with inflation measured as the change in PCE from the same month in the previous year. The second figure shows PCE inflation and core PCE inflation measured as the inflation rate calculated by compounding the current month’s rate over an entire year. (The first figure shows what is sometimes called 12-month inflation and the second figure shows 1-month inflation.)


The two inflation measures are telling markedly different stories: 12-month inflation shows a continuation in the decline in inflation that began in 2022. Twelve-month PCE inflation fell from 2.6 percent in December to 2.4 percent in January. Twelve-month core PCE inflation fell from 2.9 percent in December to 2.8 percent in December. So, by this measure, inflation continues to approach the Fed’s 2 percent inflation target.
One-month PCE and core PCE inflation both show sharp increases from December to January: From 1.4 percent in December to 4.2 percent for 1-month PCE inflation and from 1.8 percent in December to 5.1 percent in January for 1-month core PCE inflation.
The one-month inflation data are bad news in that they may indicate that inflation accelerated in January and that the Fed is, therefore, further away than it seemed in December from hitting its 2 percent inflation target. But it’s important not to overinterpret a single month’s data. Although 1-month inflation is more volatile than 12-month inflation, the broad trend in 1-month inflation had been downwards from mid-2022 through December 2023. It will take at least a more months of data to assess whether this trend has been broken.
Fed officials didn’t appear to be particularly concerned by the news. For instance, according to an article on bloomberg.com, Federal Reserve Bank of Atlanta President Raphael Bostic noted that: “The last few inflation readings—one came out today—have shown that this is not going to be an inexorable march that gets you immediately to 2%, but that rather there are going to be some bumps along the way.” Investors appear to continue to expect that the Fed will cut its target for the federal funds rate at its meeting on June 11-12.