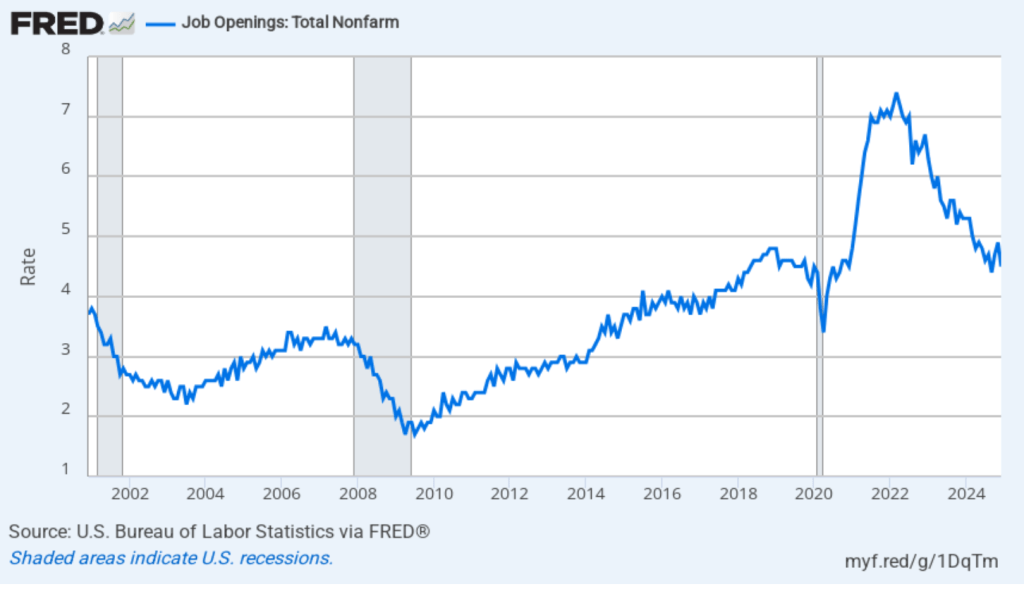
Earlier this week, the Bureau of Labor Statistics (BLS) released its “Job Openings and Labor Turnover” (JOLTS) report for December 2024. The report indicated that labor market conditions remain strong, with most indicators being in line with their values from 2019, immediately before the pandemic. The following figure shows that, at 4.5 percent, the rate of job openings remains in the same range as during the previous six months. While well down from the peak job opening rate of 7.4 percent in March 2022, the rate of job openings was the same as during the summer of 2019 and above the rates during most of the period following the Great Recession of 2007–2009.
(The BLS defines a job opening as a full-time or part-time job that a firm is advertising and that will start within 30 days. The rate of job openings is the number of job openings divided by the number of job openings plus the number employed workers, multiplied by 100.)
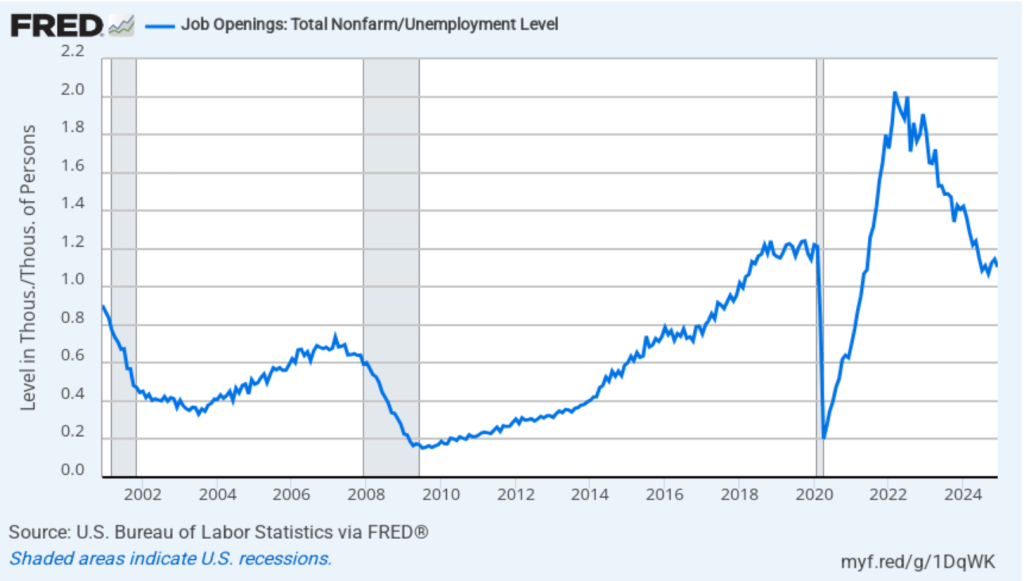
In the following figure, we compare the total number of job openings to the total number of people unemployed. The figure shows a slow decline from a peak of more than 2 job openings per unemployed person in the spring of 2022 to 1.1 job openings per unemployed person in December 2024—about the same as in 2019 and early 2020, before the pandemic. Note that the number is still above 1.0, indicating that the demand for labor is still high, although no higher than during the strong labor market of 2019.
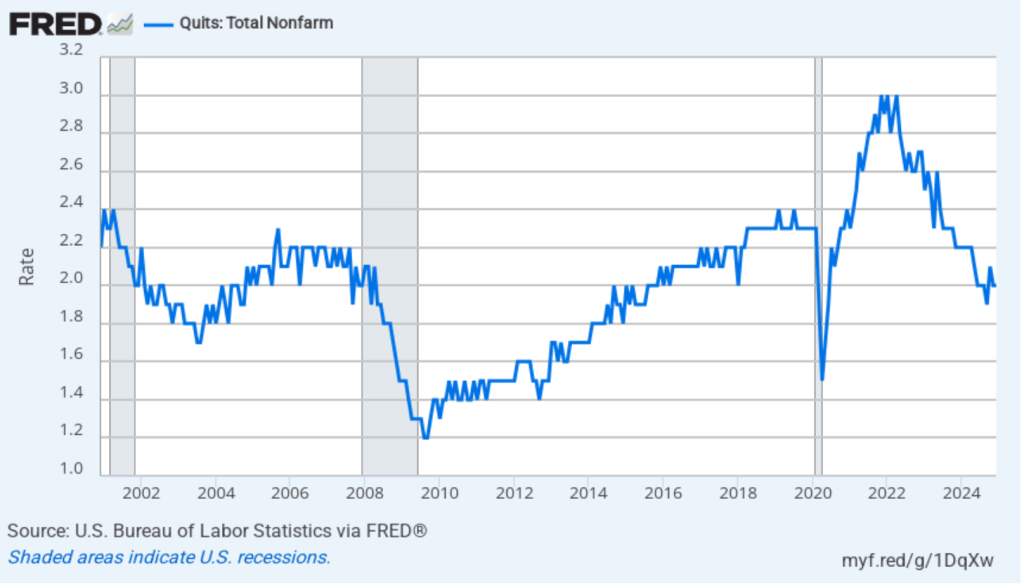
The rate at which workers are willing to quit their jobs is an indication of how they perceive the ease of finding a new job. As the following figure shows, the quit rate declined slowly from a peak of 3 percent in late 2021 and early 2022 to 2.0 percent in July 2024, the same value as in December 2024. That rate is below the rate during 2019 and early 2020. By this measure, workers’ perceptions of the state of the labor market may have deteriorated slightly in recent months.
The JOLTS data indicate that the labor market is about as strong as it was in the months prior to the start of the pandemic, but it’s not as historically tight as it was through most of 2022 and 2023. In recent months, workers may have become less optimistic about finding a new job if they quit their current job. The “Great Quitting,” which was widely discussed in the business press during the period of high quit rates in 2022 and 2023 would seem to be over.
On Friday morning, the BLS will release its “Employment Situation” report for January, which will provide additional data on the state of the labor market. (Note that the data in the JOLTS report lag the data in the “Employment Situation” report by one month.)
Today (January 31), the BEA released monthly data on the PCE as part of its Personal Income and Outlays report. In addition, the Bureau of Labor Statistics (BLS) released quarterly data on the Employment Cost Index (ECI).
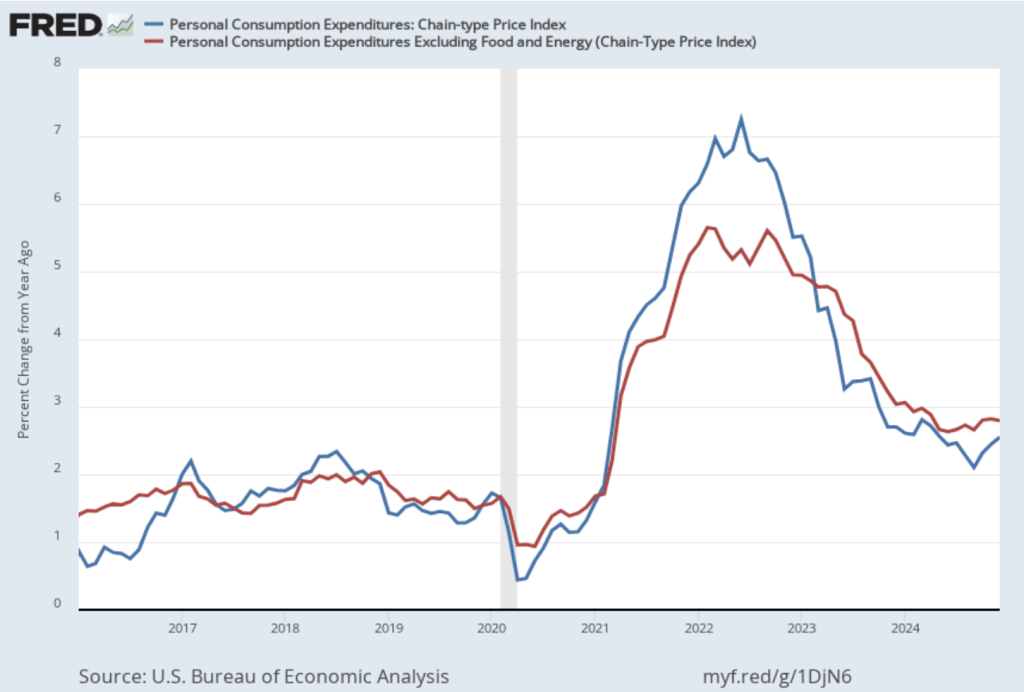
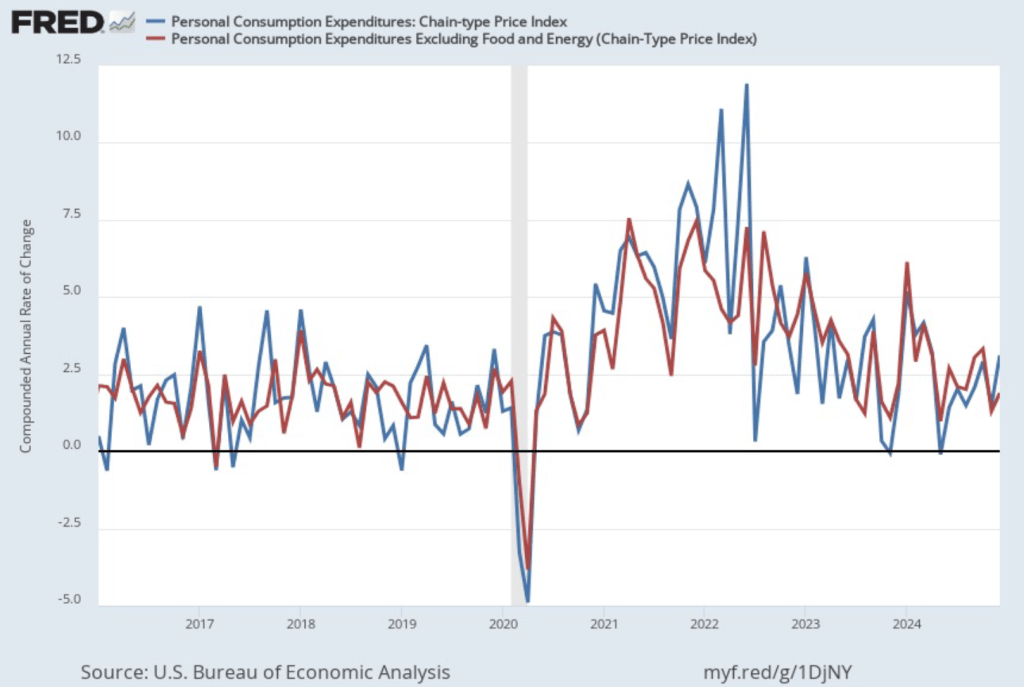
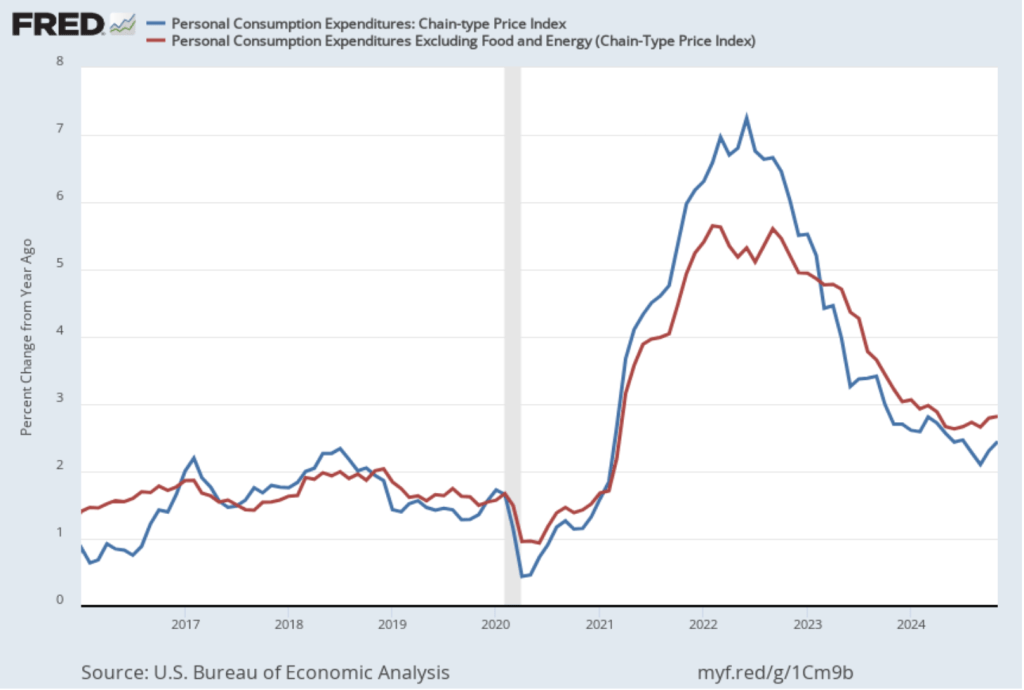
The Fed relies on annual changes in the PCE price index to evaluate whether it’s meeting its 2 percent annual inflation target. The following figure shows PCE inflation (blue line) and core PCE inflation (red line)—which excludes energy and food prices—for the period since January 2016 with inflation measured as the percentage change in the PCE from the same month in the previous year. Measured this way, in December PCE inflation (the blue line) was 2.8 percent, unchanged from November. Core PCE inflation (the red line) in December was also 2.8 percent, unchanged from November.
The following figure shows PCE inflation and core PCE inflation calculated by compounding the current month’s rate over an entire year. (The figure above shows what is sometimes called 12-month inflation, while this figure shows 1-month inflation.) Measured this way, PCE inflation rose in December to 3.1 percent from 1.5 percent in November. Core PCE inflation rose in December to 1.9 percent from to 1.3 percent in November. Core inflation is generally a better measure of the underlying trend in inflation. So, 1-month core PCE inflation running below the Fed’s 2 percent target is an encouraging sign. But the usual caution applies that 1-month inflation figures are volatile (as can be seen in the figure), so data from one month shouldn’t be overly relied on.
Turning to wages, as we’ve noted in earlier posts, the Fed’s policymaking Federal Open Market Committee (FOMC) prefers the employment cost index (ECI) to average hourly earnings (AHE) as a measure of the increase in labor costs.
The AHE is calculated by adding all of the wages and salaries workers are paid—including overtime and bonus pay—and dividing by the total number of hours worked. As a measure of how wages are increasing or decreasing during a particular period, AHE can suffer from composition effects because AHE data aren’t adjusted for changes in the mix of occupations workers are employed in. For example, during a period in which there is a decline in the number of people working in occupations with higher-than-average wages, perhaps because of a downturn in some technology industries, AHE may show wages falling even though the wages of workers who are still employed have risen. In contrast, the ECI holds constant the mix of occupations in which people are employed. The ECI does have this drawback: It is only available quarterly whereas the AHE is available monthly.
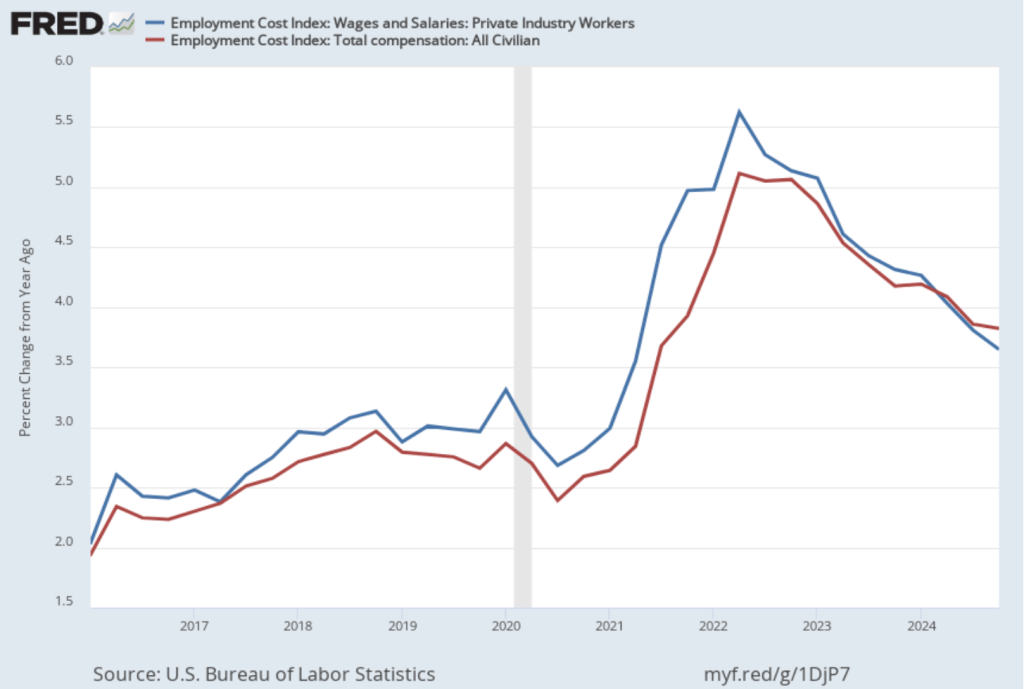
The data released this morning indicate that labor costs continue to increase at a rate that is higher than the rate that is likely needed for the Fed to hit its 2 percent price inflation target. The following figure shows the percentage change in the ECI from the same quarter in the previous year. The blue line shows only wages and salaries of private industry workers, while the red line shows total compensation, including non-wage benefits like employer contributions to health insurance, for all civilian workers. The two measures of wage inflation follow similar paths. The rate of increase in the wage and salary measure decreased slightly from 3.9 percent in the third quarter of 2024 to 3.8 percent in the fourth quarter. The movement in the rate of increase in compensation was very similar, also decreasing from 3.9 percent in the third quarter of 2024 to 3.8 percent in the fourth quarter.
If we look at the compound annual growth rate of the ECI—the annual rate of increase assuming that the rate of growth in the quarter continued for an entire year—we find that the rate of increase in wages and salaries increased from 3.1 percent in the third quarter of 2024 to 3.6 percent in the fourth quarter. Similarly, the rate of increase in compensation increased from 3.2 percent in the fourth quarter of 2024 to 3.6 percent in the fourth quarter. So, this measure indicates that there has been some increase in the rate of wage inflation in the fourth quarter, although, again, we have to use caution in interpreting data from only one quarter.
Taken together, the PCE and ECI data released today indicate that the Fed still has a way to go before bringing about a soft landing—returning inflation to its 2 percent target without pushing the economy into a recession.
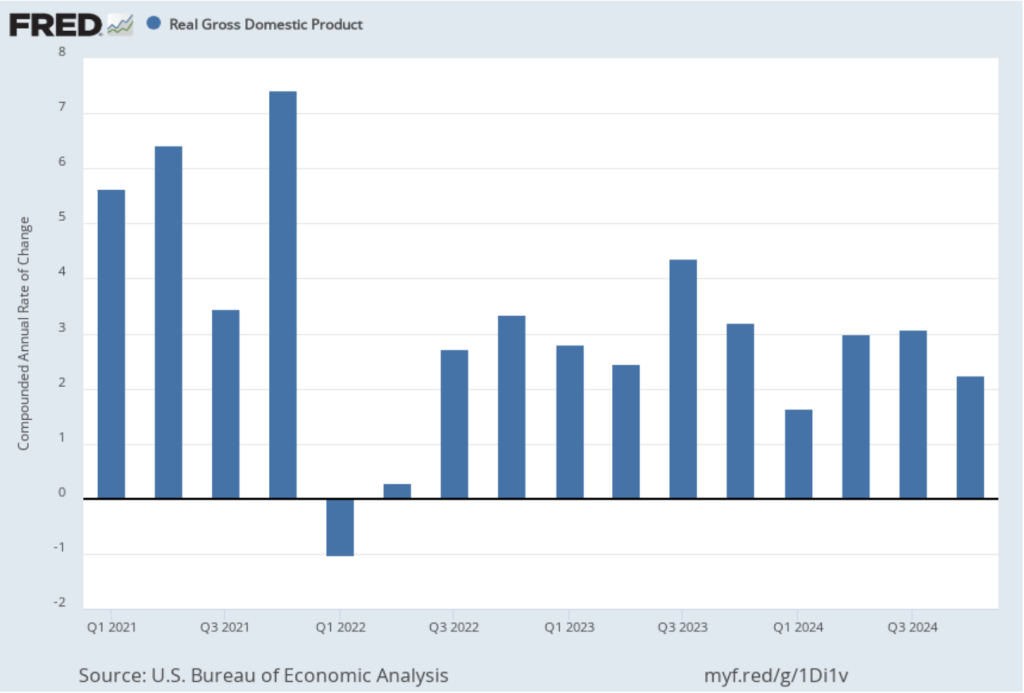
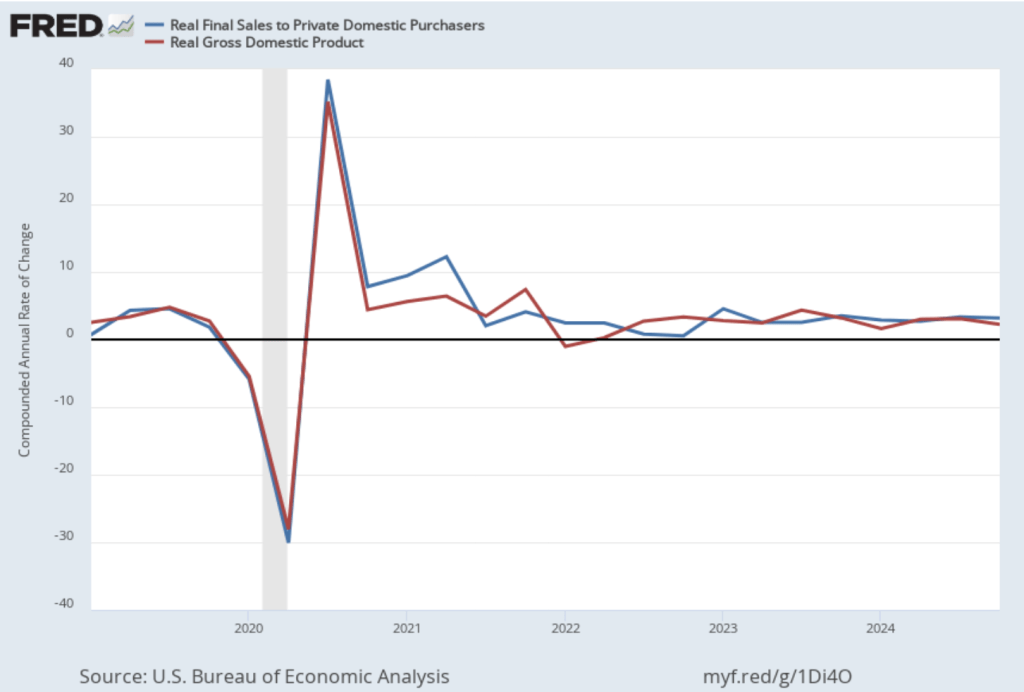
Today (January 30), the Bureau of Economic Analysis (BEA) released its advance estimate of GDP for the fourth quarter of 2024. (The report can be found here.) The BEA estimates that real GDP increased at an annual rate of 2.3 percent in the fourth quarter—October through December. That was down from the 3.1 percent increase in real GDP in the third quarter. On an annual basis, real GDP grew by 2.5 percent in 2024, down from 3.2 percent in 2023. A 2.5 percent growth rate is still well above the Fed’s estimated long-run annual growth rate in real GDP of 1.8 percent. The following figure shows the growth rate of real GDP (calculated as a compound annual rate of change) in each quarter since the first quarter of 2021.
Personal consumption expenditures increased at an annual rate of 4.2 percent in the fourth quarter, while gross private domestic investment fell at a 5.6 annual rate. As we discuss in this blog post, Fed Chair Jerome Powell’s preferred measure of the growth of output is growth in real final sales to private domestic purchasers. This measure of production equals the sum of personal consumption expenditures and gross private fixed investment. By excluding exports, government purchases, and changes in inventories, final sales to private domestic purchasers removes the more volatile components of gross domestic product and provides a better measure of the underlying trend in the growth of output.
The following figure shows growth in real GDP (the blue line) and in real final sales to private domestic purchasers (the red line) with growth measured as compound annual rates of change. Measured this way, in the fourth quarter of 2024, real final sales to private domestic producers increased by 3.2 percent, well above the 2.3 percent increase in real GDP. Growth in real final sales to private domestic producers was down from 3.4 percent in the third quarter, while growth in real GDP was down from 3.1 percent in third quarter. Overall, using Powell’s preferred measure, growth in production seems strong.
This BEA report also includes data on the private consumption expenditure (PCE) price index, which the FOMC uses to determine whether it is achieving its goal of a 2 percent inflation rate. The following figure shows inflation as measured using the PCE (the blue line) and the core PCE (the red line)—which excludes food and energy prices—since the beginning of 2016. (Note that these inflation rates are measured using quarterly data and as percentage changes from the same quarter in the previous year to match the way the Fed measures inflation relative to its 2 percent target.) Inflation as measured by PCE was 2.4 percent, up slightly from 2.3 percent in the third quarter. Core PCE, which may be a better indicator of the likely course of inflation in the future, was 2.8 percent in the fourth quarter, unchanged since the third quarter. As has been true of other inflation data in recent months, these data show that inflation has declined greatly from its mid-2022 peak while remaining above the Fed’s 2 percent target.
This latest BEA report doesn’t change the consensus view of the overall macroeconomic situation: Production and employment are growing at a steady pace, while inflation remains stubbornly above the Fed’s target.
Federal Reserve Chair Jerome Powell at a press conference following a meeting of the FOMC (photo from federalreserve.gov)
Members of the Fed’s Federal Open Market Committee (FOMC) had signaled that the committee was likely to leave its target range for the federal funds rate unchanged at 4.25 percent to 4.50 percent at its meeting today (January 29), which, in fact, was what they did. As Fed Chair Jerome Powell put it at a press conference following the meeting:
“We see the risks to achieving our employment and inflation goals as being roughly in balance. And we are attentive to the risks on both sides of our mandate. … [W]e do not need to be in a hurry to adjust our policy stance.”
The next scheduled meeting of the FOMC is March 18-19. It seems likely that the committee will also keep its target rate constant at that meeting. Although at his press conference, Powell noted that “We’re not on any preset course.” And that “Policy is well-positioned to deal with the risks and uncertainties that we face in pursuing both sides of our dual mandate.” The statement the committee released after the meeting showed that the decision to leave the target rate unchanged was unanimous.
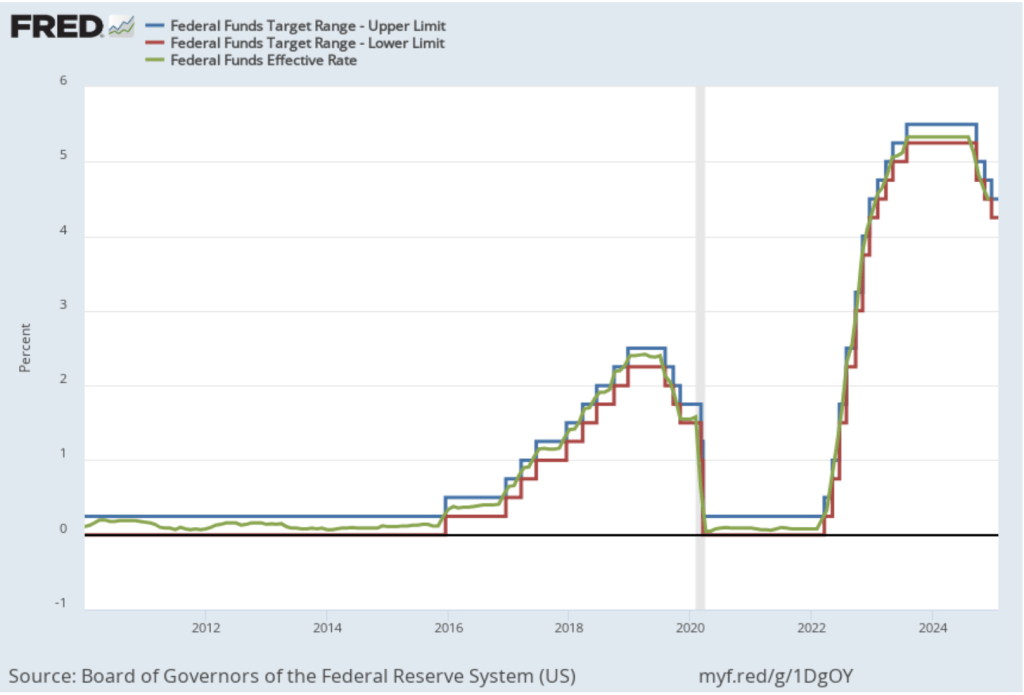
The following figure shows, for the period since January 2010, the upper bound (the blue line) and lower bound (the red line) for the FOMC’s target range for the federal funds rate and the actual values of the federal funds rate (the green line) during that time. Note that the Fed is successful in keeping the value of the federal funds rate in its target range.
A week ago, President Donald Trump in a statement to the World Economic Forum in Davos, Switzerland noted his intention to take actions to reduce oil prices. And that “with oil prices going down, I’ll demand that interest rates drop immediately.” As we noted in this recent post about Fed Governor Michael Barr stepping down as Fed Vice Chair for Supervision, there are indications that the Trump administration may attempt to influence Fed monetary policy.
In his press conference, Powell was asked about the president’s statement and responded that he had “No comment whatever on what the president said.” When asked whether the president had spoken to him about the need to lower interest rates, Powell said that he “had no contact” with the president. Powell stated in response to another question that “I’m not going to—I’m not going to react or discuss anything that any elected politician might say ….”
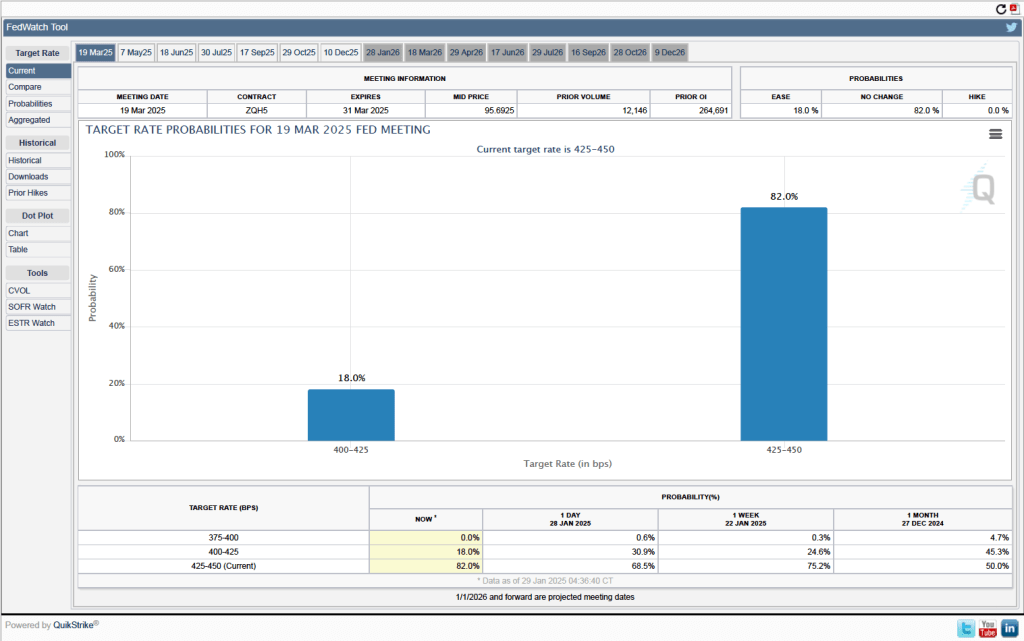
As we noted earlier, it seems likely that the FOMC will leave its target for the federal funds rate unchanged at its meeting on March 18-19. One indication of expectations of future rate cuts comes from investors who buy and sell federal funds futures contracts. (We discuss the futures market for federal funds in this blog post.) As shown in the following figure, today these investors assign a probability of 82.0 percent to the FOMC keeping its target range for the federal funds rate unchanged at the current range of 4.25 percent to 4.50 percent at the March meeting. Investors assign a probability of only 18.0 percent to the committee cutting its target range by 25 basis points at that meeting.
At the close of stock trading on Friday, January 24 at 4 pm EST, Nvidia’s stock had a price of $142.62 per share. When trading reopened at 9:30 am on Monday, January 27, Nvidia’s stock price plunged to $127.51. The total value of all Nvidia’s stock (the firm’s market capitalization or market cap) dropped by $589 billion—the largest one day drop in market cap in history. The following figure from the Wall Street Journal shows movements in Nvidia’s stock price over the past six months.
What happened to cause should a dramatic decline in Nvidia’s stock price? As we discuss in Macroeconomics, Chapter 6 (Economics, Chapter 8, and Money, Banking, and the Financial System, Chapter 6), Nividia’s price of $142.62 at the close of trading on January 24—like the price of any publicly traded stock—reflected all the information available to investors about the company. For the company’s stock to have declined so sharply at the beginning of the next trading day, important new information must have become available—which is exactly what happened.
As we discussed in this blog post from last October, Nvidia has been very successful in producing state-of-the-art computer chips that power the most advanced generative artificial intelligence (AI) software. Even after Monday’s plunge in the value of its stock, Nvidia still had a market cap of nearly $3.5 trillion at the end of the day. It wasn’t news that DeepSeek, a Chinese AI company had produced AI software called R1 that was similar to ChatGTP and other AI software produced by U.S. companies. The news was that R1—the latest version of the software is called V3—appeared to be comparable in many ways to the AI software produced by U.S. firms, but had been produced by DeepSeek despite not using the state-of-the-art Nvidia chips used in those AI programs.
The Biden administration had barred export to China of the newest Navidia chips to keep Chinese firms from surging ahead of U.S. firms in developing AI. DeepSeek claimed to have developed its software using less advanced chips and have trained its software at a much lower cost than U.S. firms have been incurring to train their software. (“Training” refers to the process by which engineers teach software to be able to accurately solve problems and answer questions.) Because DeepSeek’s costs are lower, the company charges less than U.S. AI firms do to use its computer infrastructure to handle business tasks like responding to consumer inquiries.
If the claims regarding DeepSeek’s software are accurate, then AI firms may no longer require the latest Nvidia chips and may be forced to reduce the prices they can charge firms for licensing their software. The demand for electricity generation may also decline if it turns out that the demand for AI data centers, which use very large amounts of power, will be lower than expected.
But on Monday it wasn’t yet clear whether the claims being made about DeepSeek’s software were accurate. Some industry observers speculated that, despite the U.S. prohibition on exporting the latest Nvidia chips to China, DeepSeek had managed to obtain them but was reluctant to admit that it had. There were also questions about whether DeepSeek had actually spent as little as it claimed in training its software.
What happens to the price of Nvidia’s stock during the rest of the week will indicate how investors are evaluating the claims DeepSeek made about its AI software.
Treasury Secretary nominee Scott Bessent. (Photo from Progect Syndicate.)
By setting an ambitious 3% growth target, U.S. Treasury Secretary nominee Scott Bessent has provided the Trump administration a North Star to follow in devising its economic policies. The task now is to focus on productivity growth and avoiding any unforced errors that would threaten output.
U.S. Treasury Secretary nominee Scott Bessent is right to emphasize faster economic growth as a touchstone of Donald Trump’s second presidency. More robust growth not only implies higher incomes and living standards—surely the basic objective of economic policy—but also can reduce America’s yawning federal budget deficit and debt-to-GDP ratio, and ease the sometimes difficult trade-offs across defense, social, and education and research spending.
But faster growth must be more than just a wish. Achieving it calls for a carefully constructed agenda, based on a recognition of the channels through which economic policies can raise or reduce output. While a pro-investment tax policy might boost capital accumulation, productivity, and GDP, higher interest rates from deficit-financed tax or spending changes might have the opposite effect. Similarly, since growth in hours worked is a component of growth in output or GDP, the new administration should avoid anti-work policies that hinder full labor-force participation, as well as sudden adverse changes to legal immigration.
While recognizing that some policy shifts that increase output might adversely affect other areas of social interest (such as the distribution of income) or even national security, policymakers should focus squarely on increasing productivity. The three pillars of any productivity policy are support for research, investment-friendly tax provisions, and more efficient regulation.
Ideas drive prospects in modern economies. Basic research in the sciences, engineering, and medicine power the innovation that advances technology, improvements in business organization, and gains in health and well-being. It makes perfect sense for the federal government to support such research. Since private firms cannot appropriate all the gains from their own outlays for basic research, they have less of an incentive to invest in it. Moreover, government support in this area produces valuable spillovers, as demonstrated by the earlier Defense Department research expenditures that became catalysts for today’s digital revolution.
This being the case, cuts in federal support for basic research are inconsistent with a growth agenda. Still, policymakers should review how research funds are distributed to ensure scientific merit, and they should encourage a healthy dose of risk-taking on newer ideas and researchers.
In addition to encouraging commercialization of spillovers from basic research and defense programs, federal support for applied research centers around the country would accelerate the dissemination of new productivity-enhancing technologies and ideas. Such centers also tend to distribute the economy’s prosperity more widely, by making new ideas broadly accessible—as agricultural- and manufacturing-extension services have done historically.
To address the second pillar of productivity growth, the administration should seek to extend the pro-investment provisions of the Tax Cuts and Jobs Act that Trump signed into law in 2017. While the TCJA’s lower tax rates on corporate profits remain in place, the expensing of business investment – a potent tool for boosting capital accumulation, productivity, and incomes – was set to be phased out over the 2023-26 period. This provision could be restored and made permanent by reducing spending on credits under the Inflation Reduction Act, or by rolling back the spending – such as $175 billion to forgive student loans – associated with outgoing President Joe Biden’s executive orders.
If the new administration wanted to go further with tax policy, it could build on the 2016 House Republican blueprint for tax reform that shifted the business tax regime from an income tax to a cashflow tax. By permitting immediate expensing of investment, but not interest deductions for nonfinancial firms, this reform would stimulate investment and growth, remove tax incentives that favor debt over equity, and simplify the tax system.
That brings us to the third pillar of a successful growth strategy: efficient regulation. The issue is not “more” versus “less.” What really matters for growth is how changes in regulation can improve the prospects for growth through innovation, investment, and capital allocation, while focusing on trade-offs in risks. Those shaping the agenda should start with basic questions like: Why can’t we build better infrastructure faster? Why can’t capital markets and bank lending be nimbler? Not only do such questions identify a specific goal; they also require one to identify trade-offs.
Fortunately, financial regulation under the new administration is likely to improve capital allocation and the prospects for growth, given the leadership appointments already announced at the Securities and Exchange Commission and the Federal Reserve. But policymakers also will need to improve the climate for building infrastructure and enhancing the country’s electricity grids to support the data centers needed for generative artificial intelligence. This will require a sharper focus on cost-benefit analysis at the federal level, as well as better coordination with state and local authorities on permitting. Using federal financial support programs as carrots or sticks can be part of such a strategy.
Bessent’s emphasis on economic growth is spot on. By setting an ambitious 3% target for annual growth, he has provided the new administration a North Star to follow in devising its economic policies.
Welcome to the first podcast for the Spring 2025 semester from the Hubbard/O’Brien Economics author team. Check back for Blog updates & future podcasts which will happen every few weeks throughout the semester.
Join authors Glenn Hubbard & Tony O’Brien as they offer thoughts on tariffs in advance of the beginning of the new administration. They discuss the positive and negative impacts of tariffs -and some of the intended consequences. They also look at the AI landscape and how its reshaping the US economy. Is AI responsible for recent increased productivity – or maybe just the impact of other factors. It should be looked at closely as AI becomes more ingrained in our economy.
The cover of Steven King’s novel The Stand. (Image from amazon.com)
In Microeconomics, Chapter 10, we have a section on “Pitfalls in Decision Making.” One of those pitfalls is the failure to ignore sunk costs. A sunk cost is one that has already been paid and cannot be recovered.
In his book On Writing: A Memoir of the Craft, King discusses his writing of The Stand (a book he describes as “the one my longtime readers still seem to like the best.”) At one point he had had trouble finishing the manuscript and was considering whether to stop working on the novel:
“If I’d had two or even three hundred pages of single-spaced manuscript instead of more than five hundred, I think I would have abandoned The Stand and gone on to something else—God knows I had done it before. But five hundred pages was too great an investment, both in time and in creative energy; I found it impossible to let go.”
King seems to have committed the error of ignoring sunk costs. The time and creative energy he had put into writing the 500 pages were sunk—whether he abandoned the manuscript or continued writing until the book was finished, he couldn’t get back the time and energy he had expanded on writing the first five hundred pages. That he had already written 300 pages or 500 pages wasn’t relevant to his decision because if a cost is sunk it doesn’t matter for decision making whether the cost is large or small.
Is it relevant in assessing King’s decision that in the end he did finish The Stand, the novel sold well—earning King substantial royalties—and his fans greatly admire the novel? Not directly because only with hindsight do we know that The Stand was successful. In deciding whether to finish the manuscript, King shouldn’t have worried about the cost of the time and energy he had already spent writing it. Instead, King should have compared the expected marginal cost of finishing the manuscript with the expected marginal benefit from completing the book. Note that the expected marginal benefit could include not only the royalty earnings from sales of the books, but also the additional appreciation he received from his fans for writing what turned out to be their favorite novel.
When King paused working on the manuscript after having written 500 pages, the marginal cost of finishing was the opportunity cost of not being able to spend those hours and creative energy writing a different book. Given the success of The Stand, the marginal benefit to King from completing the manuscript was almost certainly greater than the marginal cost. So, completing the manuscript was the correct decision, even if he made it for the wrong reason!
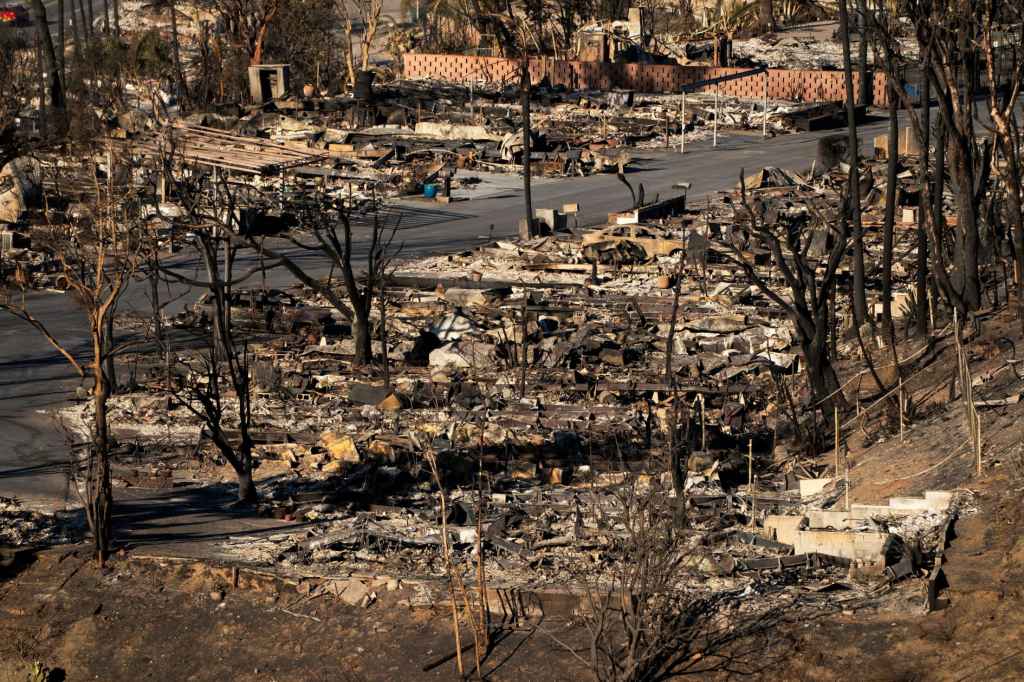
Fire damage in the Pacific Palisades. (Photo from Reuters via the Wall Street Journal)
As of January 15, the series of devastating wildfires in Southern California have killed at least 25 people and destroyed billions of dollars’ worth of homes and businesses. Adding to the tragedy is the fact that many homeowners aren’t fully insured against the damage. As a result, they lack the necessary funds to rebuild their homes. Unfortunately for these people, the market for fire insurance in California hasn’t been working well.
In the United States, regulation of property and casualty insurance occurs at the state level with regulations differing substantially across states. In California, insurance companies face an unusually long regulatory process to receive permission to increase the premiums they charge. The delays in raising premiums have contributed to companies not renewing property insurance policies in some areas, such as those prone to wildfires. In these areas, the payouts the companies expect to make have been higher than the premiums that California regulators have allowed companies to charge policyholders.
The wildfires have ravaged the Pacific Palisades neighborhood of Los Angeles . Although housing prices in the neighborhood are among the highest in the country, an analysis by the Reuters news agency showed that: “Measured against home values, insurance costs are cheaper in the Palisades than in 97% of U.S. postal codes …” For example, the median insurance premium in the Pacific Palisades was “less than residents paid in Glencoe, Illinois, an upscale suburb of Chicago where homes are two-thirds cheaper and the risk of wildfire is minimal.”
Catastrophe modeling is a way of statistically forecasting the probability of events—such as floods or wildfires—occurring that would sharply increase claims by policyholders. Regulations had barred insurance companies from using catastrophe modeling to justify increases in premiums. (State regulators lifted the prohibition on the use of catastrophe modeling shortly before the fires.) These restrictions made it more difficult for companies to charge risk-based premiums, which are based on the probability that a policyholder will file a claim.
Insurance markets can experience adverse selection problems because the people most eager to buy insurance are those with highest probability of requiring an insurance payout. Insurance companies attempt to reduce adverse selection problems by, among other things, charging risk-based premiums. Limiting the ability of insurance companies to charge risk-based premiums increased the adverse selection problems the companies face. To cope with the problem of companies not renewing policies, regulators began requiring companies to renew policies in some Zip codes, particularly those that were in or near areas that had experienced wildfires. This policy further increased adverse selection.
By 2023, some insurers, including State Farm and Allstate—which are two of the largest property insurers in the United States—had decided that they were unlikely to be able cover their costs from offering property insurance policies in California and stopped writing policies in the state. Policyholders who are unable to obtain a policy from a private insurance company typically buy a policy offered through the Fair Access to Insurance Requirements (FAIR) Plan. The FAIR Plan is sponsored by the state government, although operated by private insurance companies. The premiums charged for a FAIR Plan policy are significantly higher than the premiums charged for a traditional policy. Despite the higher premiums, the number of FAIR Plan policies doubled between 2020 and 2025, reaching nearly 500,000.
The FAIR Plan lacks sufficient funds to pay the claims from policyholders who had lost their homes or businesses in the Southern California wildfires. To cover the deficit, the FAIR Plan will assess private insurance companies, who, in turn, will raise premiums charged to their other policyholders. In this way, some of the costs from the wildfires will be borne by all property insurance policyholders in California, even if they live far from the areas affected by the wildfires.
We discuss moral hazard in insurance markets in Microeconomics and Economics, Chapter 7 (and in Money, Banking, and the Financial System, Chapter 11). In general, moral hazard refers to actions people take after they have entered into a transaction that make the other party to the transaction worse off. Moral hazard in insurance markets occurs when people change their behavior after becoming insured. The way that the insurance market is regulated in California and, in particular, the way that the FAIR Plan is administered increases moral hazard because people who own homes or businesses in areas with a greater risk of damage from wildfires don’t pay premiums that fully reflect that greater risk. In other words, more people live in fire prone areas in California than would do so if the premiums on their insurance policies fully reflected the probability of their making a claim.
Whether, following the wildfires, the California legislature will change the regulations governing the insurance market is unclear at this point. As an insurance agent quoted by the Wall Street Journal put it: “We are in uncharted territory.”
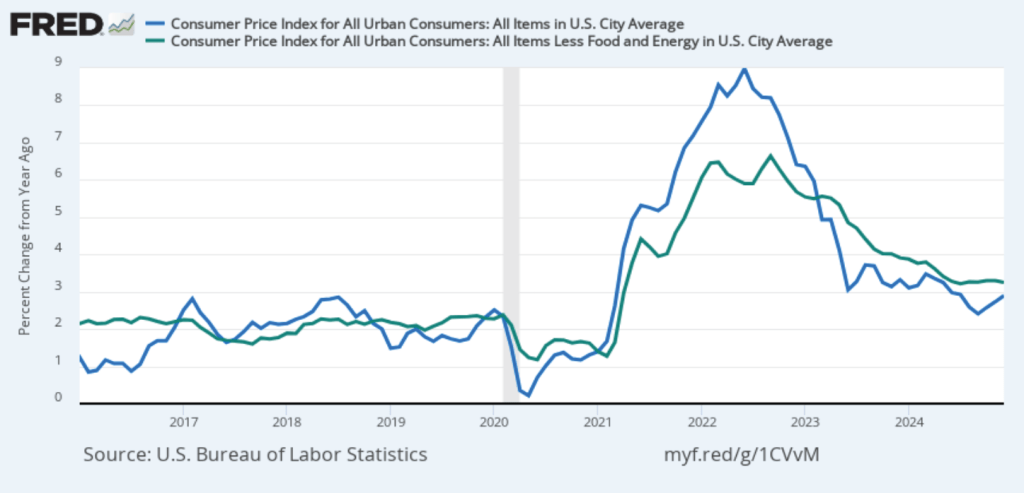
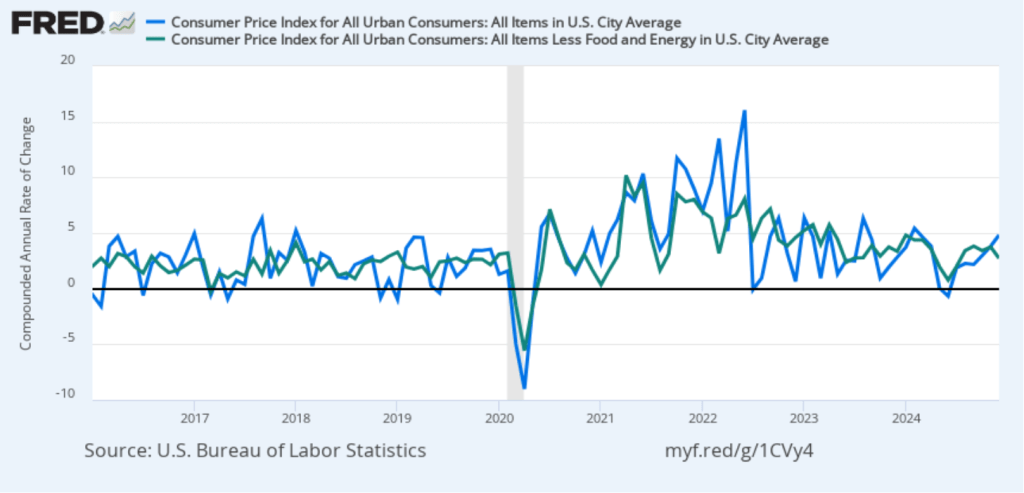
On January 15, the Bureau of Labor Statistics (BLS) released its monthly report on the consumer price index (CPI). The following figure compares headline inflation (the blue line) and core inflation (the green line).
The headline inflation rate, which is measured by the percentage change in the CPI from the same month in the previous month, was 2.9 percent in December—up from 2.7 percent in November.
The core inflation rate,which excludes the prices of food and energy, was 3.2 percent in December—down from 3.3 percent in November.
Headline inflation was slightly above and core inflation was slightly below what economists surveyed had expected.
In the following figure, we look at the 1-month inflation rate for headline and core inflation—that is the annual inflation rate calculated by compounding the current month’s rate over an entire year. Calculated as the 1-month inflation rate, headline inflation (the blue line) jumped from 3.8 percent in November to 4.8 percent in December. Core inflation (the green line) decreased from 3.8 percent in November to 2.7 percent in December.
Overall, considering 1-month and 12-month inflation together, the most favorable news is the low value of the 1-month core inflation rate. The most concerning news is a sharp increase in 1-month headline inflation, which brought that measure to its highest reading since February 2024. On balance, this month’s CPI report doesn’t do much to challenge the conclusion of other recent inflation reports that progress on lowering inflation has slowed or, possibly, stalled. So, the probability of a “no landing” outcome, with inflation remaining above the Fed’s target for an indefinite period, seems to have at least slightly increased.
Of course, it’s important not to overinterpret the data from a single month. The figure shows that 1-month inflation is particularly volatile. Also note that the Fed uses the personal consumption expenditures (PCE) price index, rather than the CPI, to evaluate whether it is hitting its 2 percent annual inflation target.
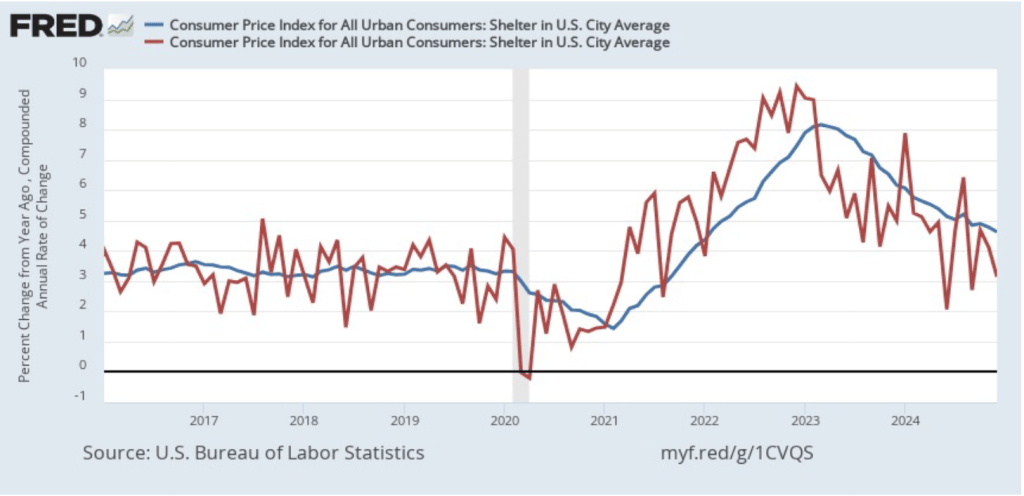
As we’ve discussed in previous blog posts, Federal Reserve Chair Jerome Powell and his colleagues on the Fed’s policymaking Federal Open Market Committee (FOMC) have been closely following inflation in the price of shelter. The price of “shelter” in the CPI, as explained here, includes both rent paid for an apartment or a house and “owners’ equivalent rent of residences (OER),” which is an estimate of what a house (or apartment) would rent for if the owner were renting it out. OER is included in the CPI to account for the value of the services an owner receives from living in an apartment or house.
As the following figure shows, inflation in the price of shelter has been a significant contributor to headline inflation. The blue line shows 12-month inflation in shelter, and the red line shows 1-month inflation in shelter. Twelve-month inflation in shelter has been declining since the spring of 2023, but in December it was still high at 4.6 percent. One-month inflation in shelter—which is much more volatile than 12-month inflation in shelter—fell from 4.1 percent in November to 3.1 percent in December.
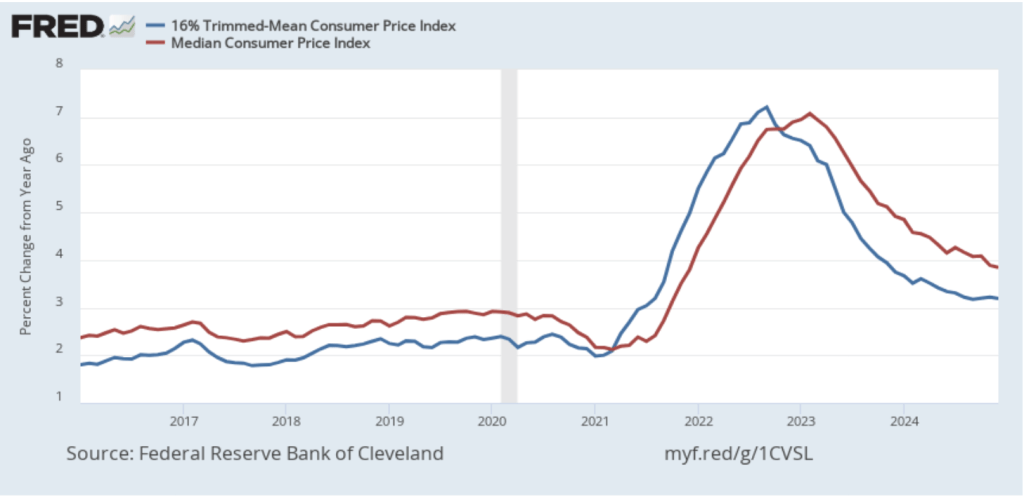
To better estimate of the underlying trend in inflation, some economists look at median inflation and trimmed mean inflation.
Median inflation is calculated by economists at the Federal Reserve Bank of Cleveland and Ohio State University. If we listed the inflation rate in each individual good or service in the CPI, median inflation is the inflation rate of the good or service that is in the middle of the list—that is, the inflation rate in the price of the good or service that has an equal number of higher and lower inflation rates.
Trimmed mean inflation drops the 8 percent of goods and services with the highest inflation rates and the 8 percent of goods and services with the lowest inflation rates.
The following figure shows that 12-month median inflation (the red line) declined slightly from 3.9 percent in November to 3.8 percent in December. Twelve-month trimmed mean inflation (the blue line) was unchanged at 3.2 percent for the fifth month in a row.
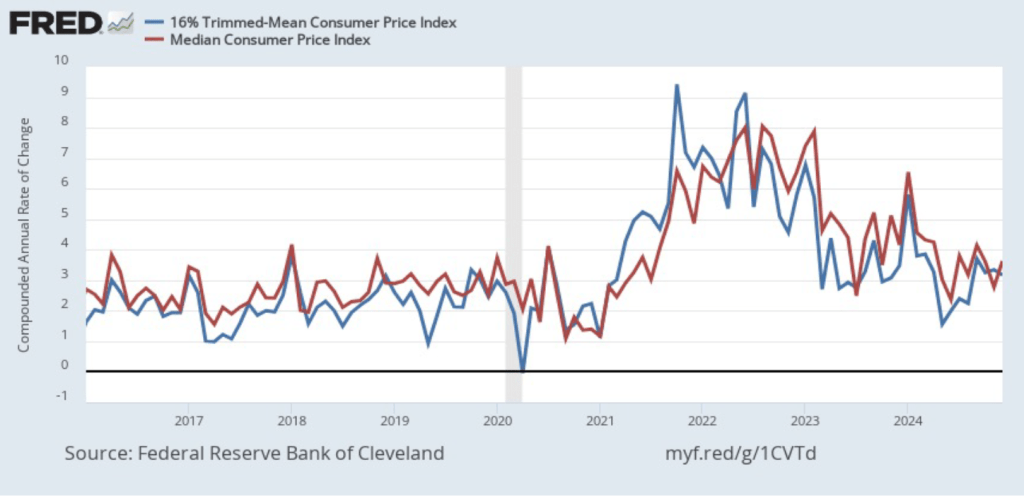
The following figure shows 1-month median and trimmed mean inflation. One-month median inflation rose from 2.8 percent in November to 3.6 percent in December. One-month trimmed mean inflation fell slightly from 3.3 percent in November to 3.2 percent in December. These data provide confirmation that (1) CPI inflation at this point is likely running higher than a rate that would be consistent with the Fed achieving its inflation target, and (2) that progress toward the target has slowed.
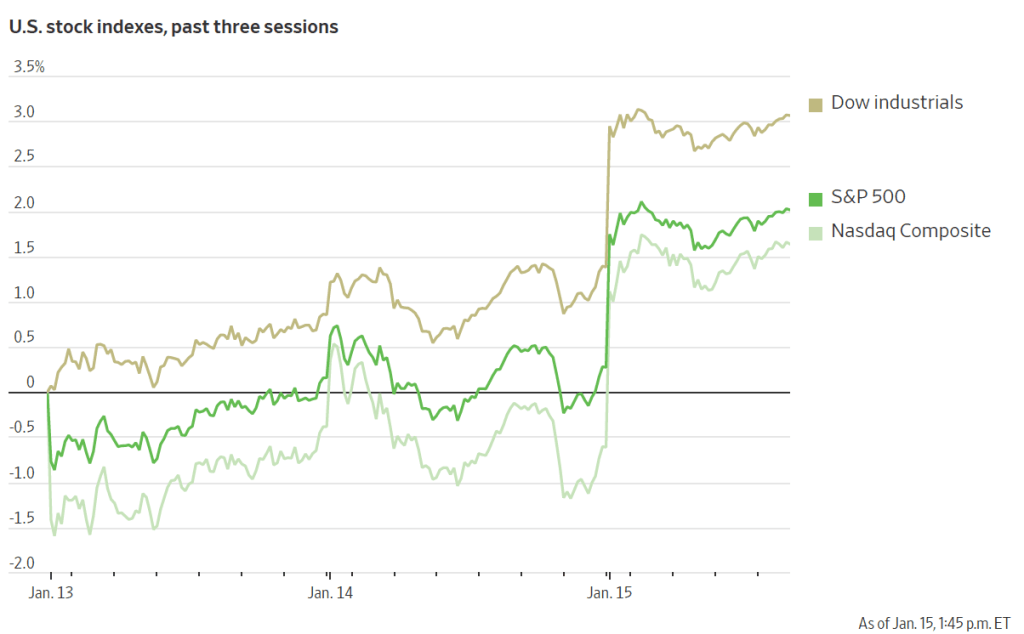
What are the implications of this CPI report for the actions the FOMC may take at its next meeting on January 28-29? The stock market rendered a quick verdict, as the following figure from the Wall Street Journal shows. As soon as the market opened on Wednesday morning, all three of the most widely followed stock market indexes jumped—as indicated by the vertical segments in the figure. Investors seem to be focusing on core CPI inflation being lower than expected, which should increase the probability that the FOMC will cut its target for the federal funds rate at either its March or May meeting. Lower inflation and lower interest rates would be good news for stock prices.
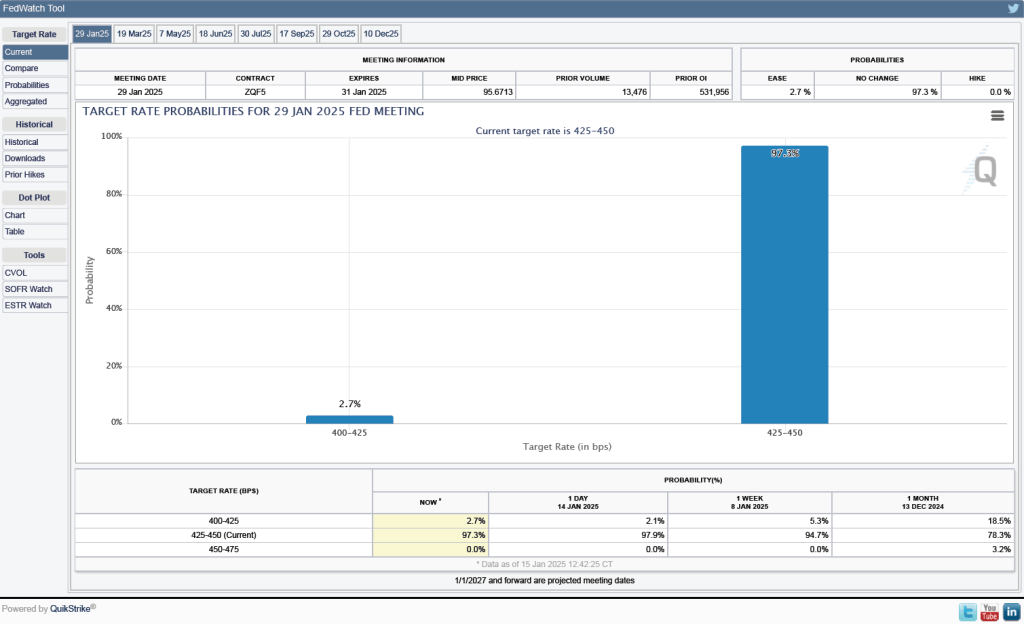
Investors who buy and sell federal funds futures contracts still do not expect that the FOMC will cut its target for the federal funds rate at its next meeting, as indicated by the following figure. (We discuss the futures market for federal funds in this blog post.) Today, investors assign a probability of 93.7 percent to the FOMC leaving its target range for the federal funds rate unchanged at 4.25 percent to 4.50 percent at its January 28-29 meeting, and a probability of only 2.7 percent to the committee cutting its target range by 0.25 percentage point (25 basis points).