

In economics, index numbers play an important role in gauging the state of the economy. For instance, rather than measure inflation by looking at the price of one or a few goods and services, we use the consumer price index (CPI), which combines the prices of many goods and services into a single number. (In Macroeconomics, Chapter 9, Section 9.4 and Economics, Chapter 19, Section 19.4, we discuss how the Bureau of Labor Statistics constructs the consumer price index.) Similarly, the S&P 500 provides an index of stock prices and the Federal Reserve compiles an index of industrial production that measures the output of factories, mines, and utilities.
The advantage of indexes is that they provide broader measures of an economic variable. Important as the price of gasoline is in the average family’s budget, the prices of food, clothing, and other goods and services are also important. So, the CPI is a better measure of inflation than is just the price of gasoline.
But in some cases it can be difficult for economists to construct an index. This problem is particularly likely when an index would not be comprised of similar data, such as prices of goods and services in the case of the CPI. For example, when the Covid–19 pandemic first began to affect the United States in March 2020, the U.S. economy began to experience “supply chain problems.” News articles reported supply chains problems persisting into the summer of 2022. These reports highlighted specific problems, such as shortages of semiconductors that reduced automobile production and ships being backed up at ports leading to delays in U.S. firms receiving imported products. Just as we don’t want to measure inflation by looking only at gasoline prices, we don’t want to measure supply chain problems by looking only at shortages of semiconductors. It would be better to use an index that summarizes what is happening with supply chains in a way that’s analogous to how the CPI summarizes what is happening with the price level. But the very different aspects of supply chain problems make constructing an index that summarizes these problems more difficult than constructing the CPI.
Economists at the Federal Reserve Bank of New York have tried to overcome these technical difficulties in devising an index of supply chain problems: the Global Supply Chain Pressure Index (GSCPI). Here’s the New York Fed’s description of the economic data included in the index:
“The GSCPI integrates a number of commonly used metrics with the aim of providing a comprehensive summary of potential supply chain disruptions. Global transportation costs are measured by employing data from the Baltic Dry Index (BDI) and the Harpex index, as well as airfreight cost indices from the U.S. Bureau of Labor Statistics. The GSCPI also uses several supply chain-related components from Purchasing Managers’ Index (PMI) surveys, focusing on manufacturing firms across seven interconnected economies: China, the euro area, Japan, South Korea, Taiwan, the United Kingdom, and the United States.”
Some more detail on components of the index that may be unfamiliar: The Baltic Dry Index (BDI) and the Harpex indexes both measure rates shippers charge firms to move cargo by sea. (Note that the name “Baltic” has historical significance but doesn’t mean that the index covers only the price of shipping in the Baltic Sea.) The Purchasing Managers’ Index (PMI) is derived from surveying purchasing managers at firms around the world about such aspects of their businesses as order backlogs, new orders, delivery time of goods from suppliers, inventories, and costs.
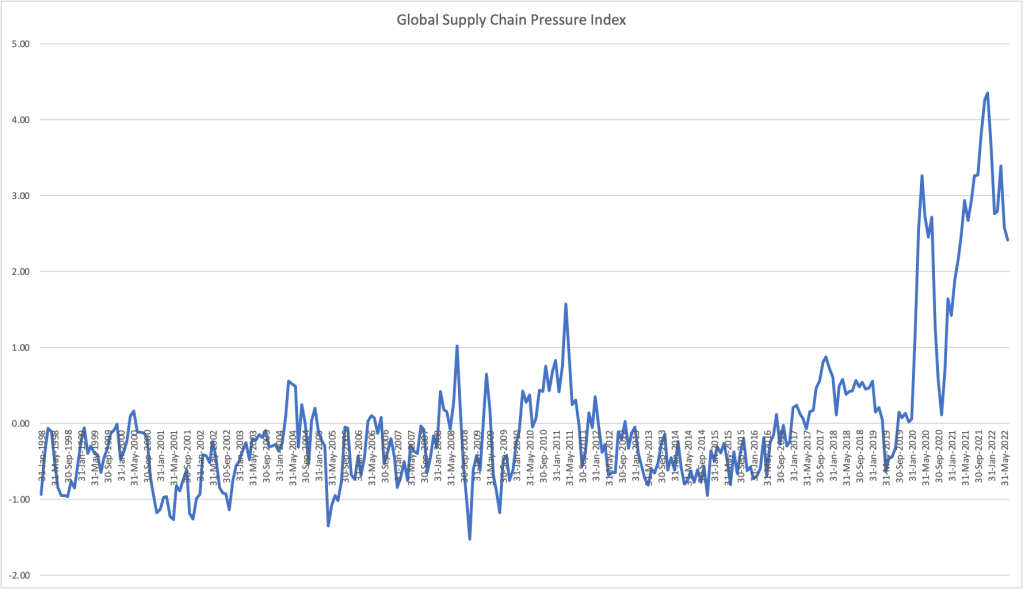
The following figure shows movements in the GSCPI from January 1998 through June 2022 and is derived from data on the New York Fed site. Higher values indicate more supply chain problems in the world economy. Movements in the index indicate that supply chain problems reached a peak in April 2020 during the height of the initial disruptions caused by the pandemic. Supply chains then improved through September 2020 before worsening again. The worst reading for the index occurred in December 2021. Supply problems then eased during the first half of 2022, although the index still remained high in June 2022. (Note that the values on the vertical axis are standard deviations from the average values of the index over the whole period. The standard deviation is a statistical measure of how spread out values of a series are relative to the series’ average value. That the value for the index during the first half of 2022 was two to four standards deviations above the average of the index indicates that supply chain problems were much more severe than normal.)
Sources: Liz Young, “Companies Face Rising Supply-Chain Costs Amid Inventory Challenges,” Wall Street Journal, June 21, 2022; Ana Monteiro, “Supply Constrainst a Headache for U.S. Firms as Outlook Dims,” bloomberg.com, June 2, 2022; and Federal Reserve Bank of New York, Global Supply Chain Pressure Index, https://www.newyorkfed.org/research/gscpi.html.
