

Image of “people working in a store” generated by ChatGTP 4o.
This morning (June 7), the Bureau of Labor Statistics (BLS) released its “Employment Situation” report for May. Recent government releases of macroeconomic data have indicated that the expansion of the U.S. economy is slowing. For instance, as we noted in this recent post on the JOLTS report, the labor market seems to be normalizing. Real personal consumption expenditures declined from March to April. The Federal Reserve Bank of New York’s Nowcast of real GDP growth during the current quarter declined from 2.74 percent at the end of April to 1.76 percent at the end of May. That decline reflects some weakness in the data series the economists at the New York Fed use to forecast current real GDP growth
In that context, today’s jobs report was, on balance, surprisingly strong. The report has two estimates of the change in employment during the month: one estimate from the establishment survey, often referred to as the payroll survey, and one from the household survey. As we discuss in Macroeconomics, Chapter 9, Section 9.1 (Economics, Chapter 19, Section 19.1), many economists and policymakers at the Federal Reserve believe that employment data from the establishment survey provides a more accurate indicator of the state of the labor market than do either the employment data or the unemployment data from the household survey. (The groups included in the employment estimates from the two surveys are somewhat different, as we discuss in this post.)
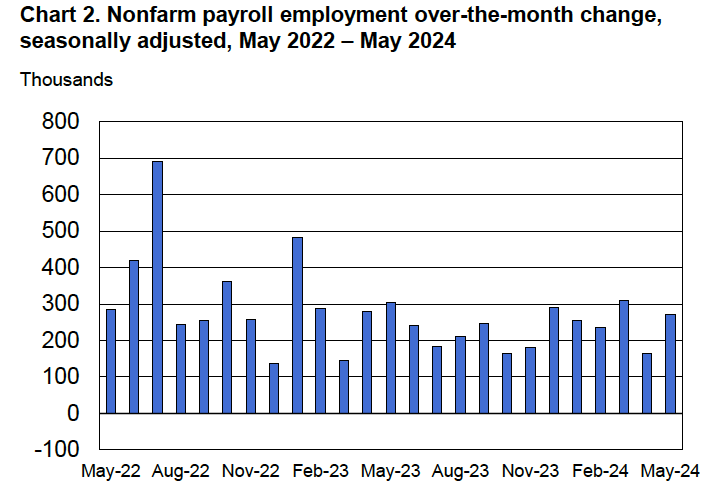
According to the establishment survey, there was a net increase of 272,000 jobs during May. This increase was well below the increase of 190,000 that economists had forecast in a survey by the Wall Street Journal and well above the net increase of 165,000 during April. (Bloomberg’s survey of economists yielded a similar forecast of an increase of 180,000.) The increase was also higher than the 232,000 average monthly increase during the past year. The following figure, taken from the BLS report, shows the monthly net changes in employment for each month during the past two years.
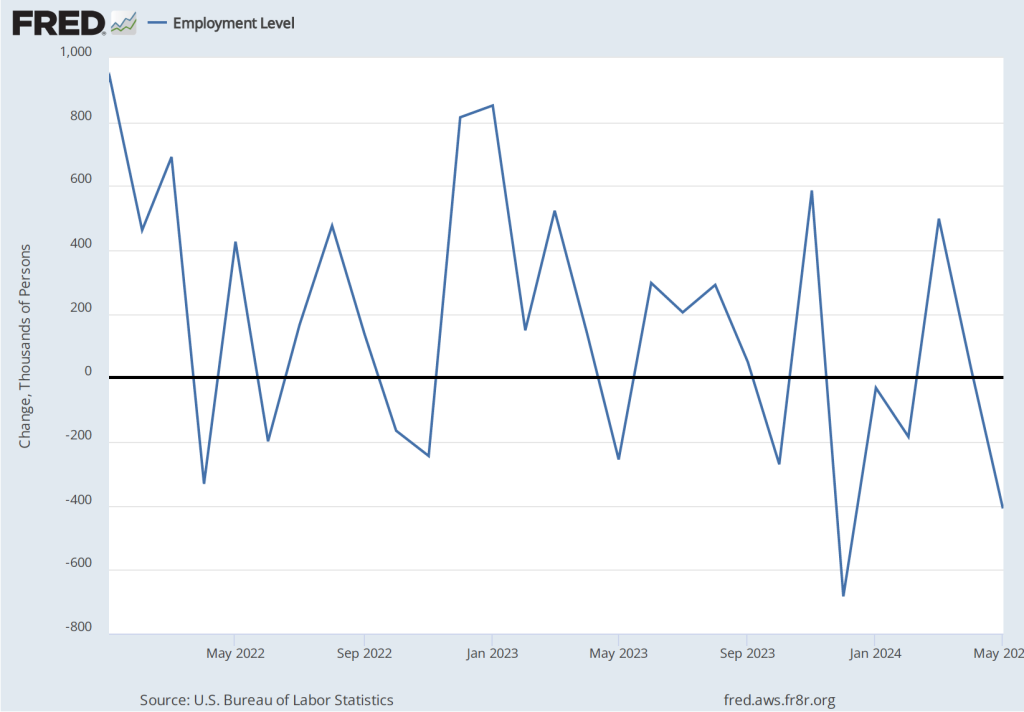
The surprising strength in employment growth in establishment survey was not echoed in the household survey, which reported a net decrease of 408,000 jobs. As the following figure shows, the net change in jobs from the household survey moves much more erratically than does the net change in jobs in the establishment survey, and—as noted earlier—the two surveys are of somewhat different groups. Still, the discrepancy between the two survey was notable.
The unemployment rate, which is also reported in the household survey, ticked up slightly from 3.9 percent to 4.0 percent. This is the first time that the unemployment has reached 4.0 percent since January 2022.

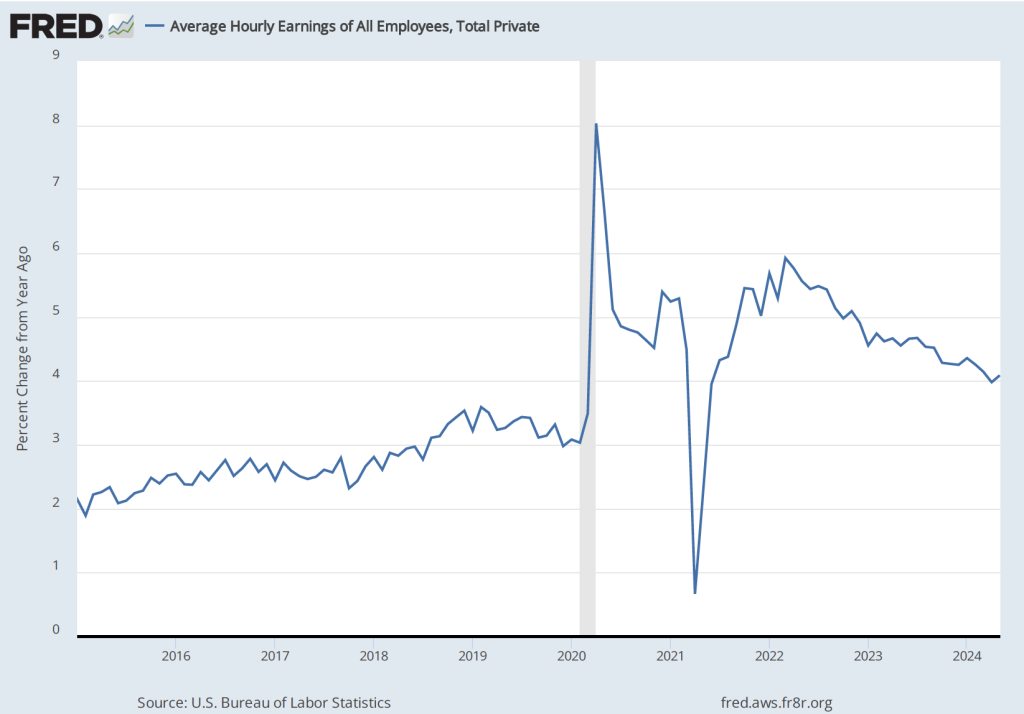
The establishment survey also includes data on average hourly earnings (AHE). As we note in this post, many economists and policymakers believe the employment cost index (ECI) is a better measure of wage pressures in the economy than is the AHE. The AHE does have the important advantage that it is available monthly, whereas the ECI is only available quarterly. The following figure show the percentage change in the AHE from the same month in the previous year. The 4.1 percent increase in May was a slight increase from the 4.0 percent increase in April. The increase in the rate of wage inflation is in contrast with the decline in employment and increase in the unemployment rate in the same report.
The following figure shows wage inflation calculated by compounding the current month’s rate over an entire year. (The figure above shows what is sometimes called 12-month wage inflation, whereas this figure shows 1-month wage inflation.) One-month wage inflation is much more volatile than 12-month inflation—note the very large swings in 1-month wage inflation in April and May 2020 during the business closures caused by the Covid pandemic.
The 1-month rate of wage inflation of 4.9 percent in May is a sharp increase from the 2.8 percent rate in April, although it’s unclear whether the increase represents a significant acceleration in wage inflation or is just reflecting the greater volatility in wage inflation when calculated this way.

To answer the question posed in the title to this post, the latest jobs report is a mixed bag that doesn’t send a clear message as to the state of the economy. The strong increase in employment and the increase in the rate of wage growth indicate that economy may not be slowing sufficiently to result in inflation declining to the Federal Reserve’s 2 percent annual target. On the other hand, the decline in employment as measured in the household survey and the tick up in the unemployment rate, along with the data in the recent JOLTS report, indicate that the labor market may be returning to more normal conditions.
It seems unlikely that this jobs report will have much effect on the thinking of the Fed’s policy-making Federal Open Market Committee (FOMC), which has its next meeting next week on June 11-12.
