Image generated by ChatGTP-4o illustrating GDP
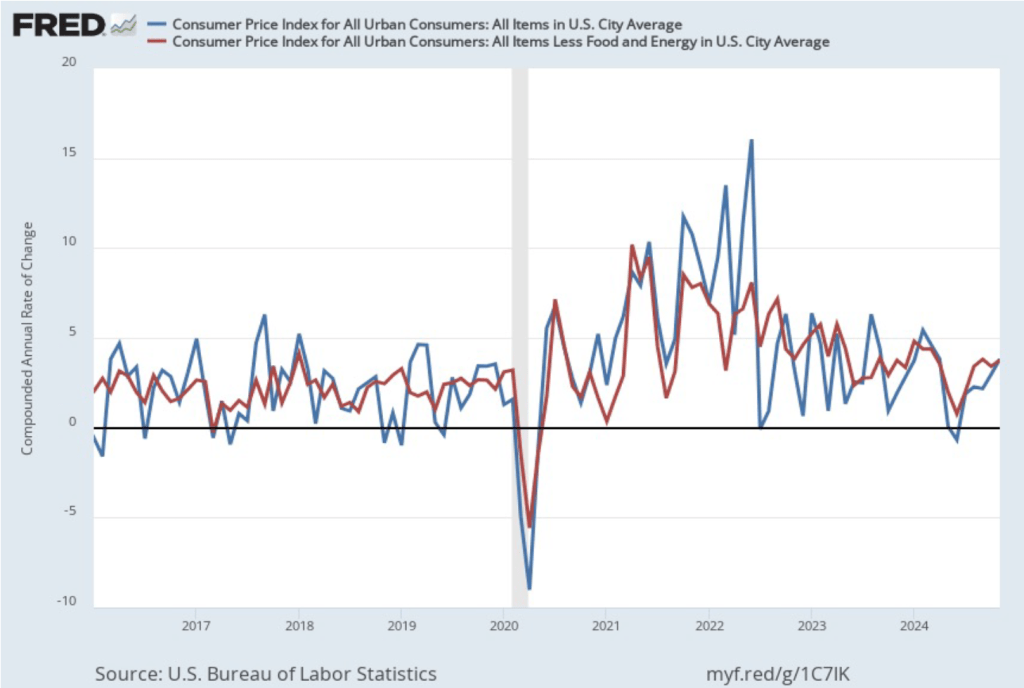
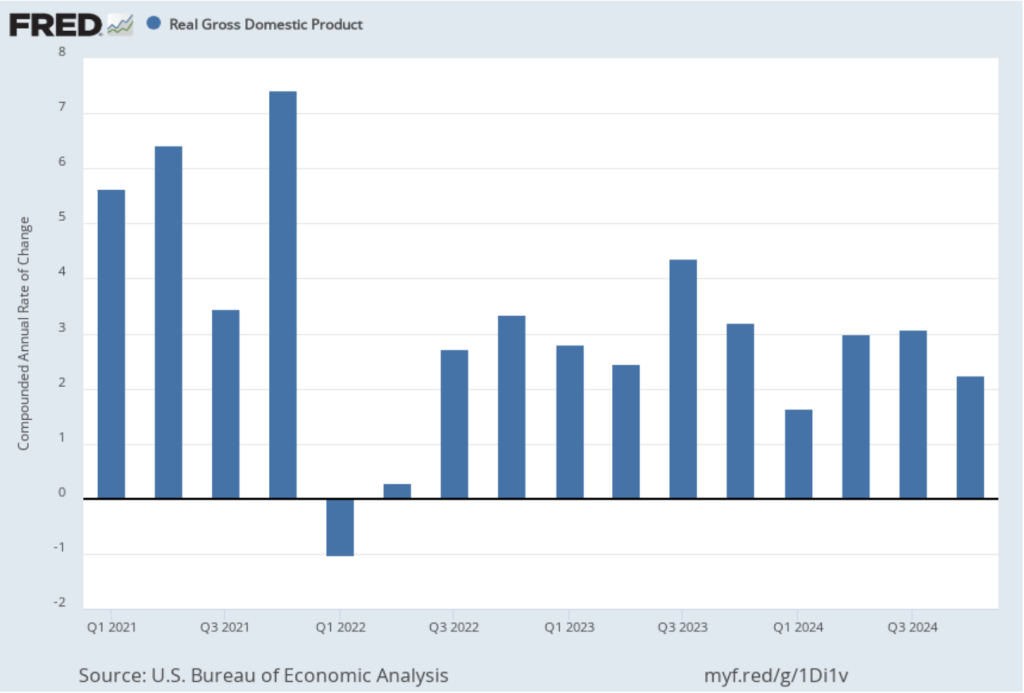
Today (January 30), the Bureau of Economic Analysis (BEA) released its advance estimate of GDP for the fourth quarter of 2024. (The report can be found here.) The BEA estimates that real GDP increased at an annual rate of 2.3 percent in the fourth quarter—October through December. That was down from the 3.1 percent increase in real GDP in the third quarter. On an annual basis, real GDP grew by 2.5 percent in 2024, down from 3.2 percent in 2023. A 2.5 percent growth rate is still well above the Fed’s estimated long-run annual growth rate in real GDP of 1.8 percent. The following figure shows the growth rate of real GDP (calculated as a compound annual rate of change) in each quarter since the first quarter of 2021.
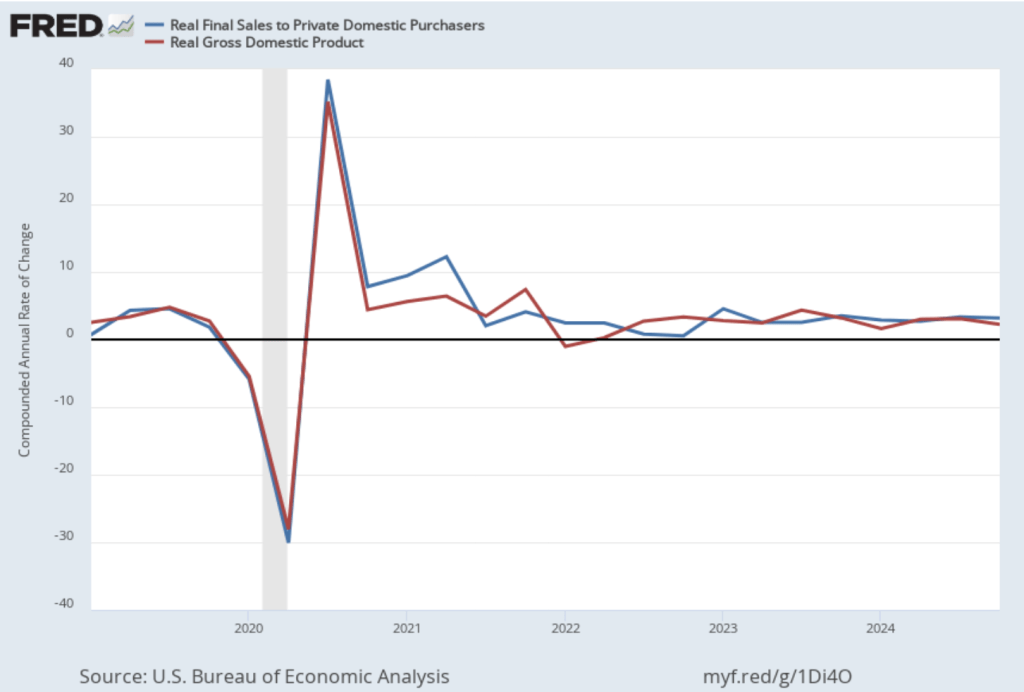
Personal consumption expenditures increased at an annual rate of 4.2 percent in the fourth quarter, while gross private domestic investment fell at a 5.6 annual rate. As we discuss in this blog post, Fed Chair Jerome Powell’s preferred measure of the growth of output is growth in real final sales to private domestic purchasers. This measure of production equals the sum of personal consumption expenditures and gross private fixed investment. By excluding exports, government purchases, and changes in inventories, final sales to private domestic purchasers removes the more volatile components of gross domestic product and provides a better measure of the underlying trend in the growth of output.
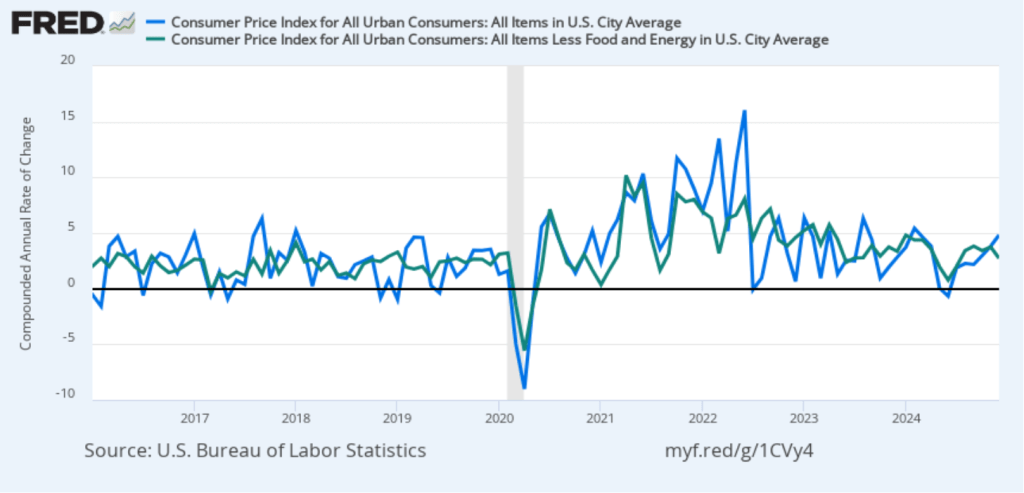
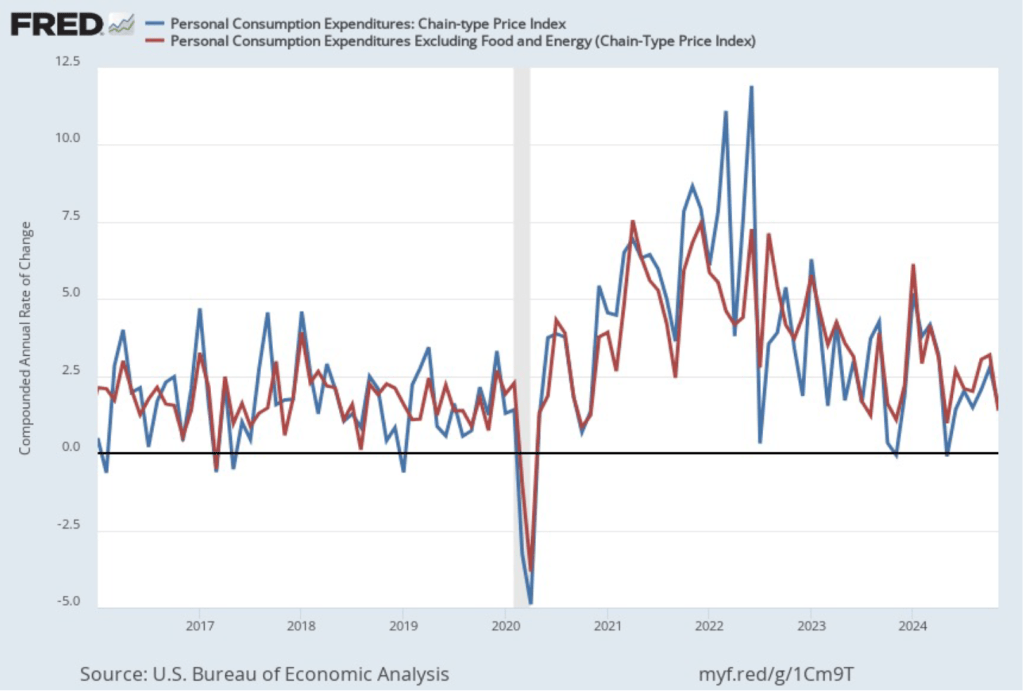
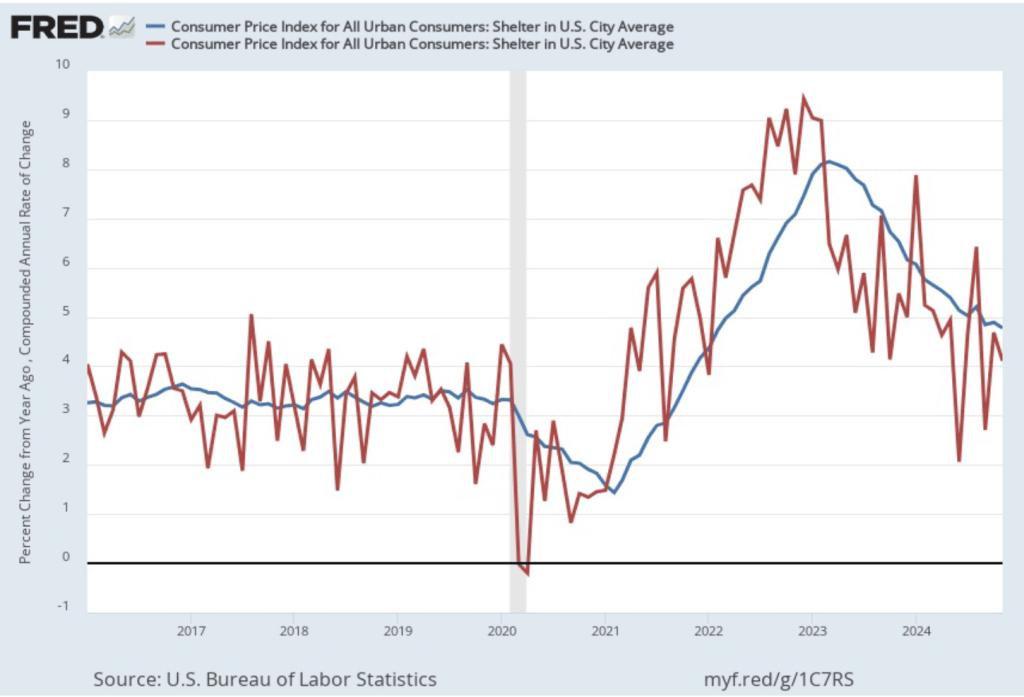
The following figure shows growth in real GDP (the blue line) and in real final sales to private domestic purchasers (the red line) with growth measured as compound annual rates of change. Measured this way, in the fourth quarter of 2024, real final sales to private domestic producers increased by 3.2 percent, well above the 2.3 percent increase in real GDP. Growth in real final sales to private domestic producers was down from 3.4 percent in the third quarter, while growth in real GDP was down from 3.1 percent in third quarter. Overall, using Powell’s preferred measure, growth in production seems strong.
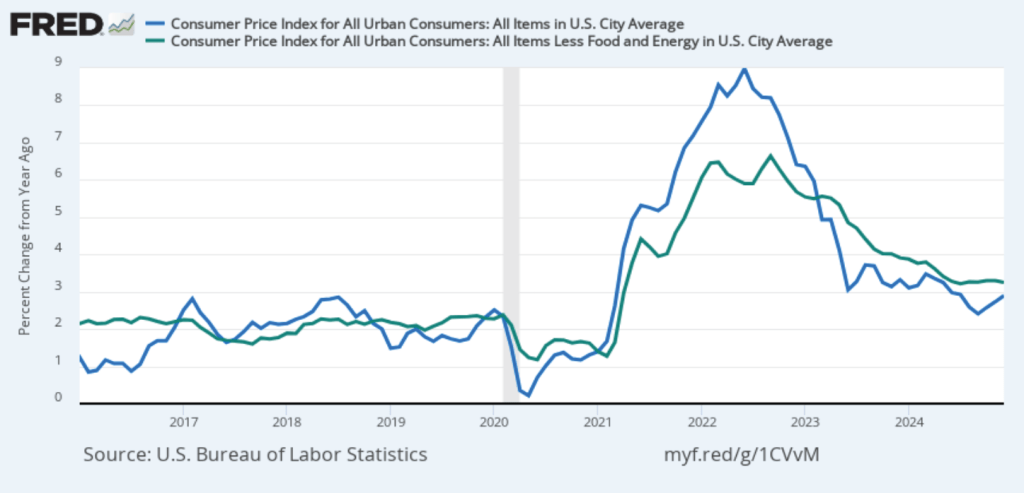
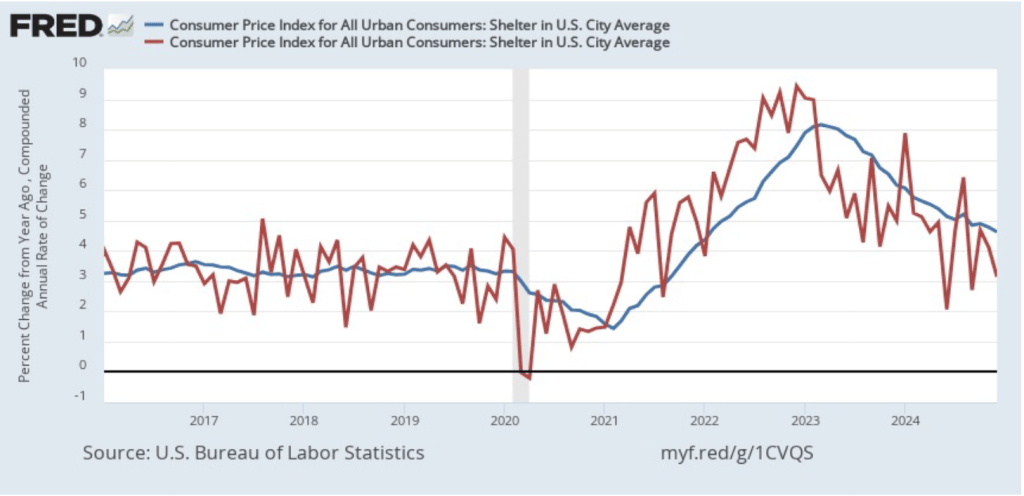
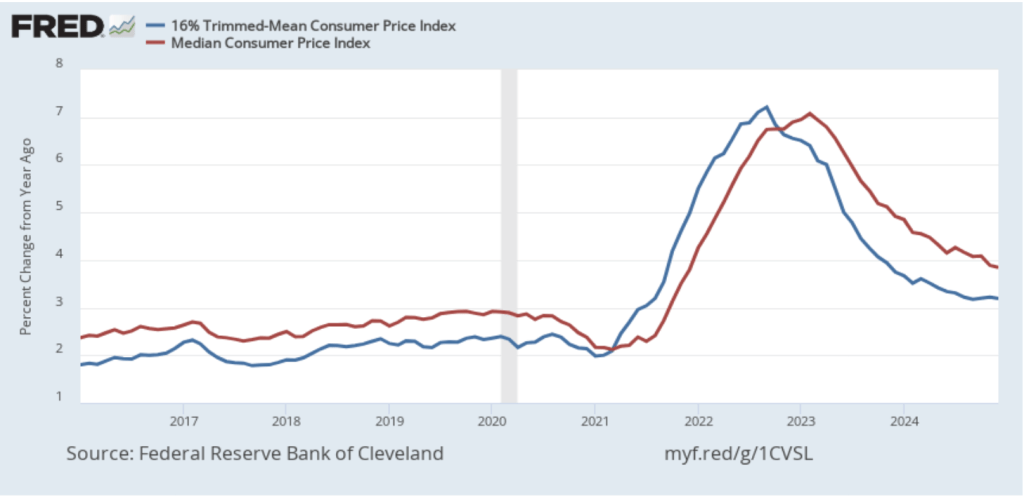
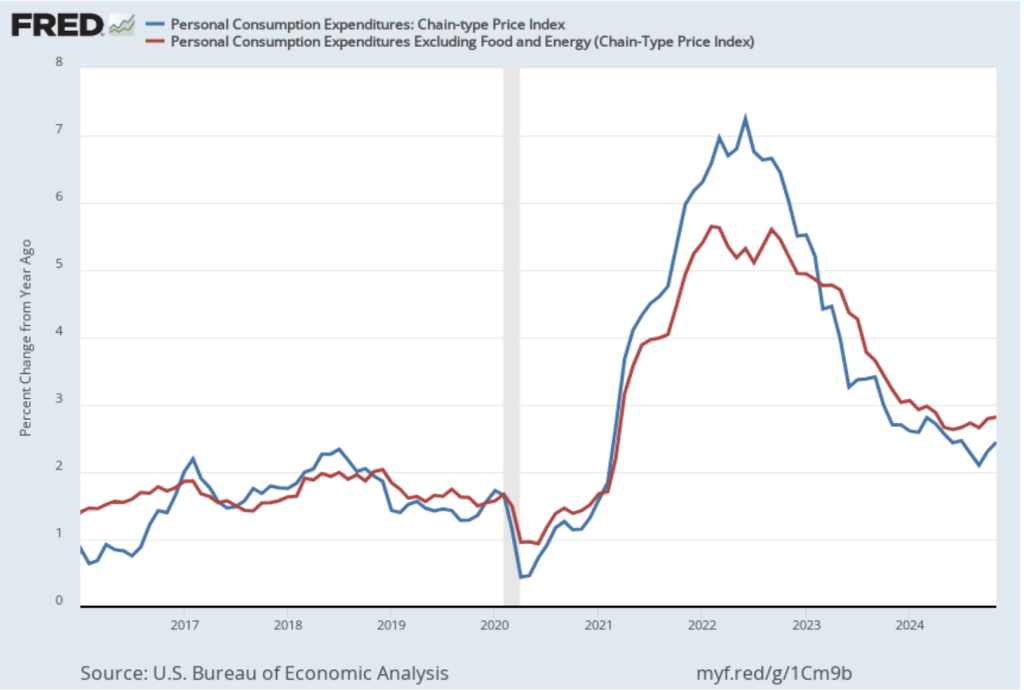
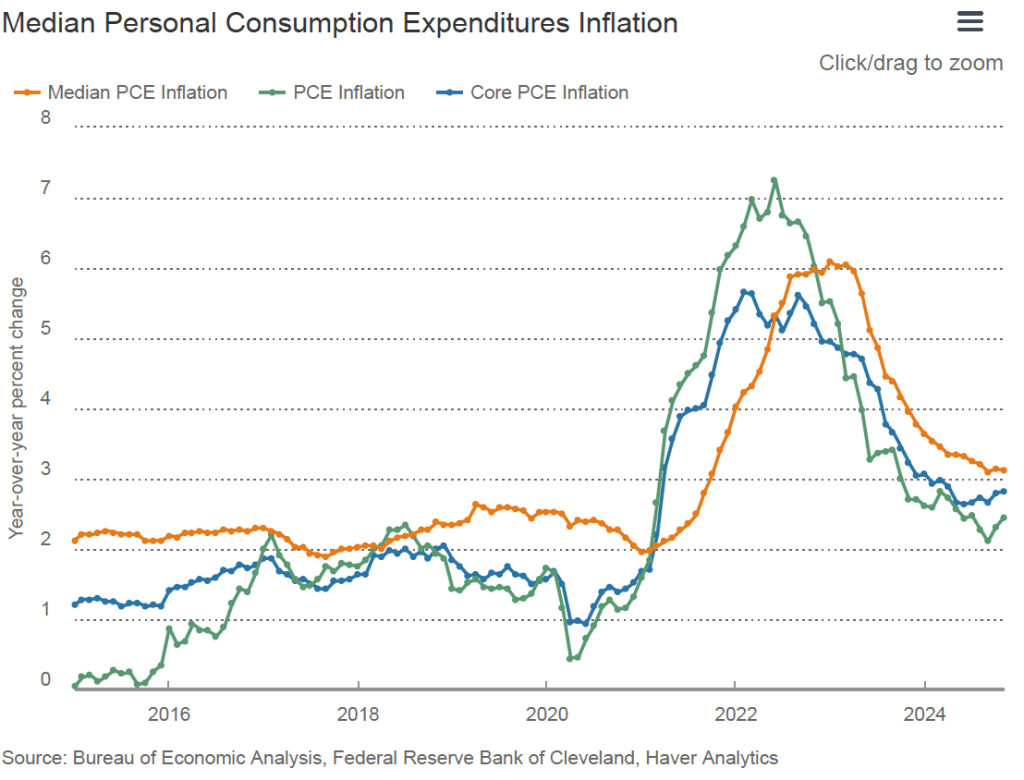
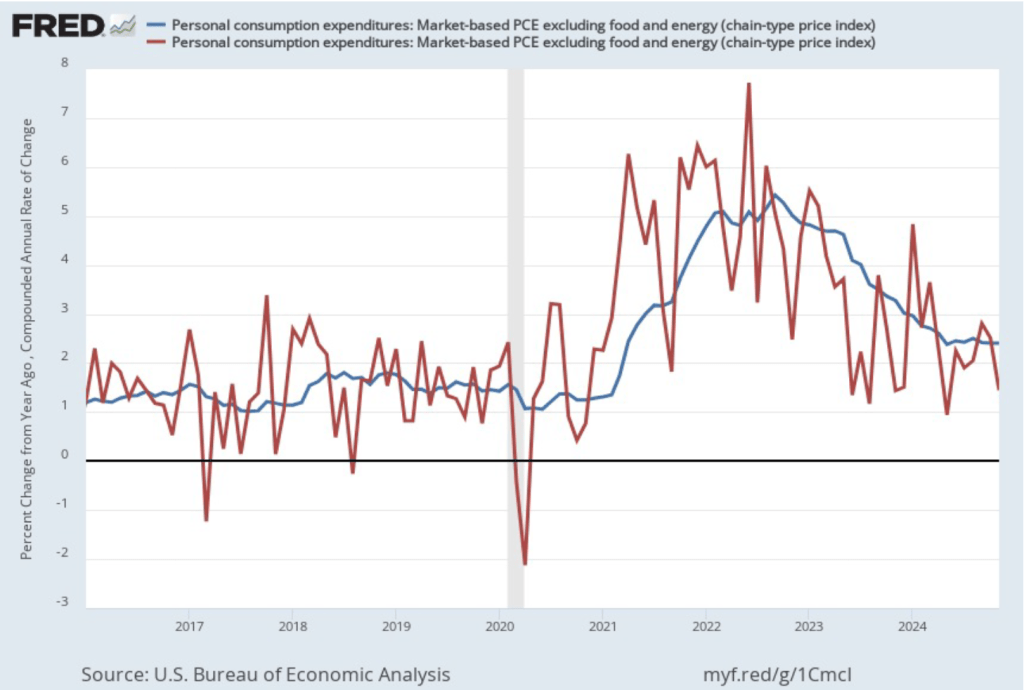
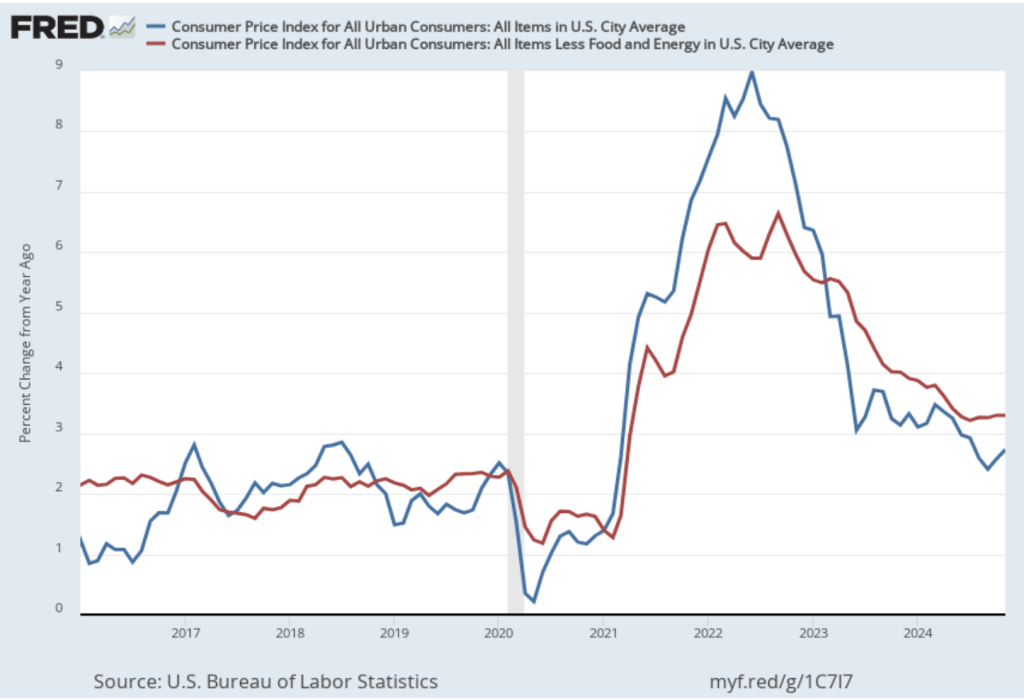
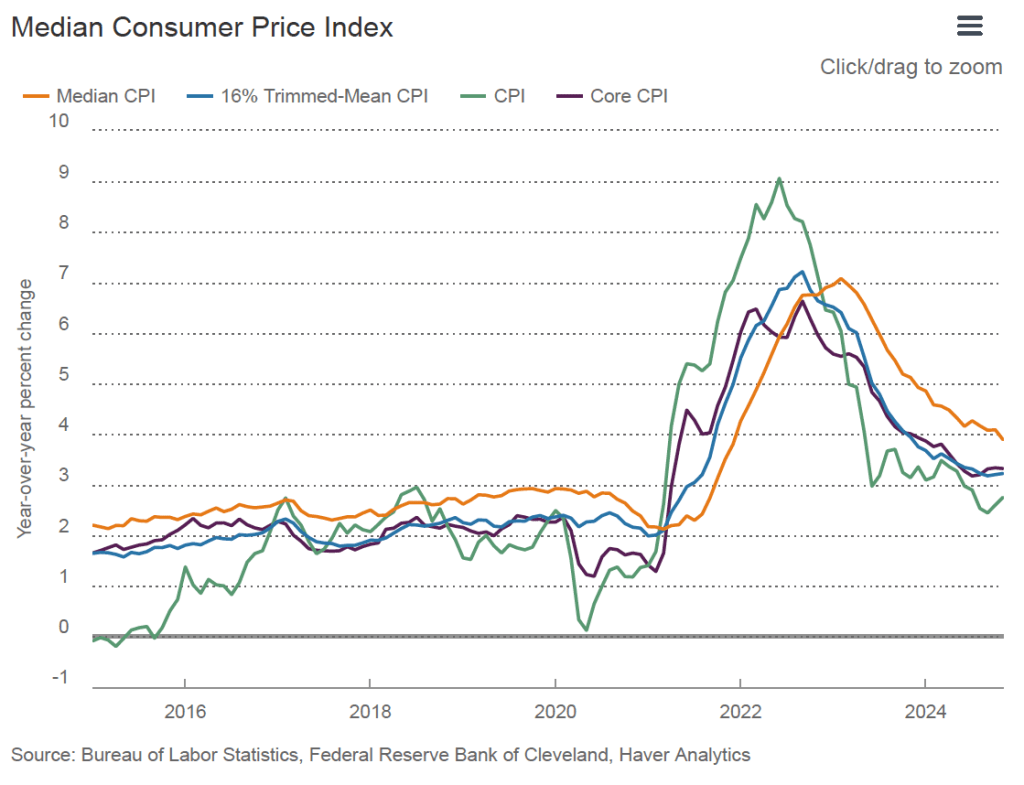
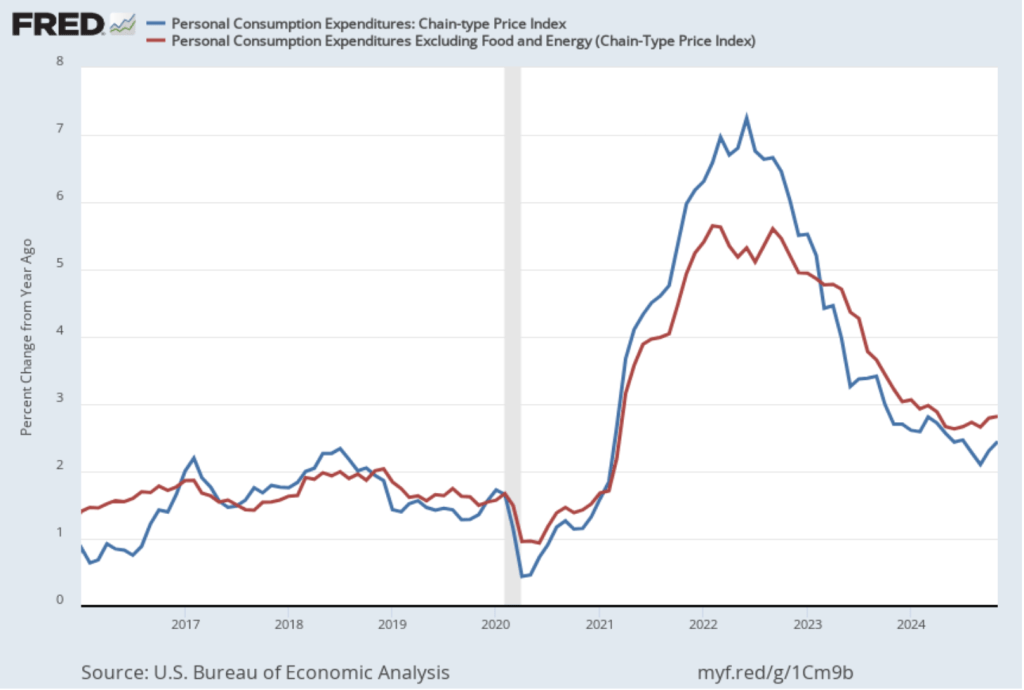
This BEA report also includes data on the private consumption expenditure (PCE) price index, which the FOMC uses to determine whether it is achieving its goal of a 2 percent inflation rate. The following figure shows inflation as measured using the PCE (the blue line) and the core PCE (the red line)—which excludes food and energy prices—since the beginning of 2016. (Note that these inflation rates are measured using quarterly data and as percentage changes from the same quarter in the previous year to match the way the Fed measures inflation relative to its 2 percent target.) Inflation as measured by PCE was 2.4 percent, up slightly from 2.3 percent in the third quarter. Core PCE, which may be a better indicator of the likely course of inflation in the future, was 2.8 percent in the fourth quarter, unchanged since the third quarter. As has been true of other inflation data in recent months, these data show that inflation has declined greatly from its mid-2022 peak while remaining above the Fed’s 2 percent target.
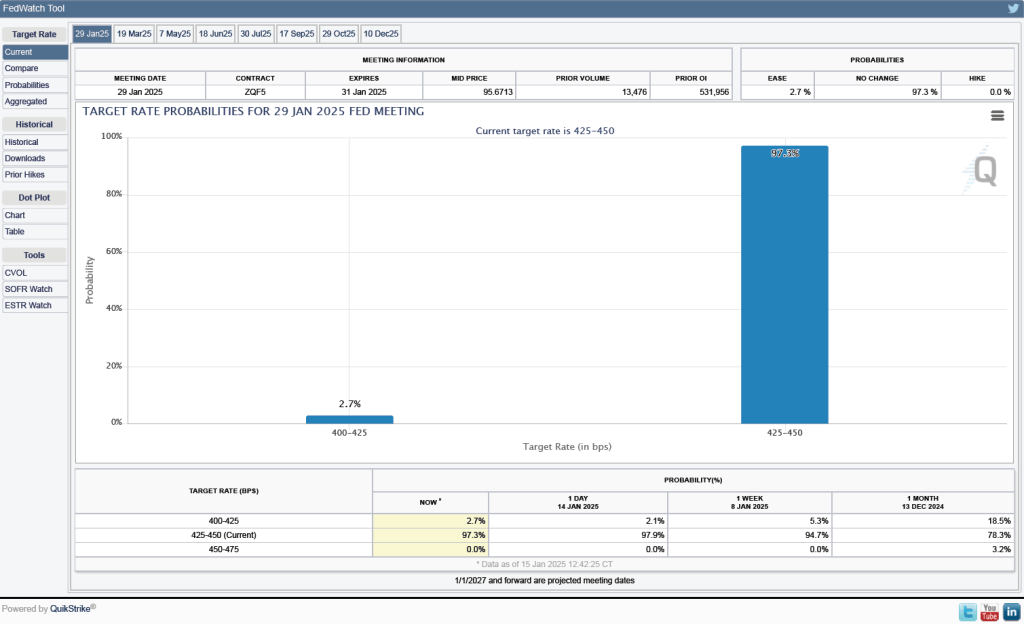
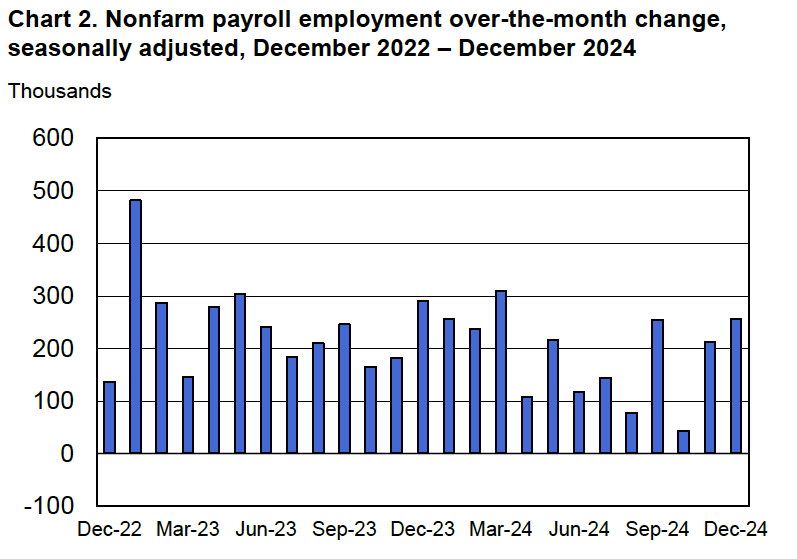
This latest BEA report doesn’t change the consensus view of the overall macroeconomic situation: Production and employment are growing at a steady pace, while inflation remains stubbornly above the Fed’s target.