On January 5, 2025 at the American Economic Association meetings in San Francisco, Jason Furman of Harvard’s Kennedy School, former Federal Reserve Chair Ben Bernanke (now of the Brookings Institution), former Council of Economic Advisers Chair Christina Romer of the University of California, Berkeley, and John Cochrane of Stanford’s Hoover Institition participated in a panel on “Inflation and the Macroeconomy.”
The discussion provides an interesting overview of a number of macroeconomic topics including:
The roles of aggregate demand shocks and aggregate supply shocks in explaining the sharp increase of inflation beginning in the spring of 2021.
The reasons for the Fed’s delay in responding to the increase in inflation.
Why macroeconomic forecasting models and most economists failed to anticipate the rise in inflation.
The role of the Fed’s 2020 monetary policy framework, how the Fed should revise the framework as a result of the review currently underway, and whether the Fed should change its inflation target. (We discuss the Fed’s monetary policy framework in several blog posts, including this one.)
The likely future course of inflation and the potential effects of the Trump Administration’s policies.
The likely consequences of large federal budget deficits.
Threats to Fed independence.
The discussion is fairly long at two hours, but most of it is nontechnical and should be understandable by students who have reached the monetary and fiscal policy chapters of a macroeconomic principles course (Chapters 15 and 16 of Macroeconomics; Chapters 25 and 26 of Economics).
To answer the question in the title: Negative supply shocks—shifts to the left in the short-run aggregate supply (SRSAS) curve—and positive demand shocks—shifts to the right in the aggregate demand (AD) curve—both contributed to the acceleration in inflation that began in the spring of 2021. But were the aggregate supply shifts, such as the semiconductor shortage that reduced the supply of new automobiles, more or less important than the aggregate demand shifts, such as the expansionary monetary and fiscal policies?
Adam Hale Shapiro of the Federal Reserve Bank of San Francisco used a basic piece of microeconomic analysis to estimate the contribution of shifts in aggregate supply and shifts in aggregate demand to inflation during this period. He looked at the prices of the more than 100 categories of goods and services in the personal consumption expenditures(PCE) price index. The PCE price index is a measure of the price level similar to the GDP deflator, except it includes only the prices of goods and services from the consumption category of GDP. Changes in the PCE price index are the Federal Reserve’s preferred measure of the inflation rate because that index includes the prices of more goods and services than are included in the consumer price index (CPI).
Shapiro explains how he used microeconomic reasoning to determine whether prices in one of the more than 100 categories of goods and services were increasing because of shifts in supply or because of shifts in demand:
“Shifts in demand move both prices and quantities in the same direction along the upward-sloping supply curve, meaning prices rise as demand increases. Shifts in supply move prices and quantities in opposite directions along the downward-sloping demand curve, meaning prices rise when supplies decline.”
For example, the figure on the left shows the effect on the market for toys of an increase in the demand for toys. (We discuss how shifts in demand and supply curves in a market affect equilibrium price and quantity in Chapter 3, Section 3.4 of Economics, Macroeconomics, and Microeconomics.) The demand curve for toys shifts to the right from D1 to D2, the equilibrium price increases from P1 to P2, and the equilibrium quantity increases from Q1 to Q2. The figure on the right shows the effect on the market for toys if the price increase results from a decrease in the supply of toys rather than from an increase in demand. The supply curve shifts to the left from S1 to S2, the equilibrium price increases from P1 to P2, and the equilibrium quantity decreases from Q1 to Q2.
Shapiro used statistical methods to determine the part of a change in price or quantity that was unexpected. He took this approach in order to focus on short-run changes in these markets caused by shifts in demand and supply rather than long-run changes resulting from “factors such as technological improvements, cost-of-living adjustments to wages, or demographic changes like population aging.” In some cases, the quantity or the price in a market were very close to their expected values, so Shapiro labeled the cause of a price increase in this market as “ambiguous.”
Shapiro notes that: “Categories that experience frequent supply-driven price changes include food and household products such as dishes, linens, and household paper items. Categories that experience frequent demand-driven price changes include motor vehicle-related products, used cars, and electricity.”
The following figure shows Shapiro’s results for the period from January 2020 through April 2022. The height of each column gives the inflation rate in the month measured as the percentage change in the PCE price index from the same month in the previous year. For example, in March 2022, the inflation rate was 6.6 percent. The height of the yellow segment is the part of inflation in that month attributable to increases in demand, the height of the green segment is the part of the inflation in that month that is attributable to decreases in supply, and the height of the green segment is the part of the inflation that Shapiro can’t assign to either demand or supply. In March 2022, increased in demand accounted for 2.2 percentage points of the total 6.6 percentage point increase in inflation. Decreases in supply accounted for 3.3 percentage points, and the remaining 1.2 percentage points had an ambiguous cause.
We can conclude that, measured this way, the increase in inflation from the spring of 2021 through the spring of 2022 was due more to negative supply shocks than to positive demand shocks.
Source: Adam Hale Shapiro, “How Much Do Supply and Demand Drive Inflation?” Federal Reserve Bank of San Francisco Economic Letter, 22-15, June 21, 2022.
Supports: Chapter 2, Trade-offs, Comparative Advantage, and the Market System [Econ, Micro, Macro, and Essentials]; Chapter 9, Comparative Advantage and the Gains from International Trade [Econ and Micro; Macro Chapter 7; and Essentials Chapter 19]; Chapter 22, Aggregate Expenditure and Output in the Short Run [Macro Chapter 12].
WILL APPLE START MAKING IPHONES IN THE UNITED STATES?
Apple, like many U.S. firms, relies on a global supply chain (sometimes also called a global value chain) comprised of firms in dozens of countries to make the components used in Apple’s products. (See Hubbard/O’Brien Chapter 2, Section 2.3 of Hubbard and O’Brien Economics and Microeconomics). This strategy has allowed Apple to take advantage of both lower production costs and the engineering and manufacturing skills of firms in other countries to produce iPhones, iPads, iWatches, and MacBooks. But during the coronavirus pandemic, Apple found its supply chain disrupted because many of its suppliers located in China were forced to close for several months.
Because of the coronavirus pandemic and the trade war between the United States and China, many U.S. firms, including Apple, were considering moving some of their operations out of China. (The trade war is discussed in Chapter 9, section 9.5 of Hubbard and O’Brien Economics and Microeconomics, Chapter 7, Section 7.5 of Macroeconomics.) As an article on bloomberg.com put it, these firms were “actively seeking ways to diversify their supply chains and reduce their dependence on any single country, no matter how attractive.” For example, two Taiwanese firms, Wistron and Pegatron, which had used factories in China to assemble iPhones were moving some factories to India, Vietnam, and Taiwan.
It seemed unlikely, though, that production of iPhones would move back to the United States. Why not? First, manufacturing employment has been in decline in the United States since long before U.S. firms began using suppliers based in China. In 1947, shortly after the end of World War II, 33 percent of U.S. workers were employed in manufacturing. By 2001, when China became a member of the World Trade Organization, that percentage had already declined to 12 percent. In 2019, it was 9 percent.
Manufacturing production in the United States has held up better than manufacturing employment. The Federal Reserve’s index of manufacturing production increased more than 250 percent between the beginning of 1972 and the beginning of 2020. U.S. manufacturing has been able to increase output while employment has declined because of increases in productivity. The increases in productivity have relied, in part, on increased use of robotics, particularly in assembly line work, such as the production of automobiles. The United States has a comparative advantage in producing goods and services that require skilled labor and involve artificial intelligence, machine learning, and the use of other sophisticated computer programing. Manufacturing that relies on lower-skilled labor, such as textile and shoe production, has been mostly moved overseas.
The Taiwanese firms Foxconn, Wistron, and Pegatron assemble iPhones, primarily in factories in China and elsewhere in Asia where large quantities of unskilled labor are available. Some components of the iPhone that require skilled labor and sophisticated engineering, including the screens, the touchscreen controller, and the Wi-Fi chip, are produced by U.S. firms and shipped to China for final assembly. In fact, surprisingly, the value of the U.S.-made components exceeds the value of assembling the iPhone in Chinese factories. (See Hubbard and O’Brien Economics, Chapter 22, Section 22.3 and Macroeconomics, Chapter 12, Section 12.3).
Factory assembly lines, like those in China making iPhones, need to be flexible to respond quickly to Apple introducing new models. So, in addition, to hundreds of thousands of unskilled workers in its assembly plants, Foxconn and other firms operating in China hire thousands of engineers. Typically, these engineers do not have college degrees, but they have sufficient training to rapidly redesign and reconfigure assembly lines to produce new models. In 2010, when President Barack Obama pressed Steve Jobs, the late Apple CEO, to produce iPhones in the United States, Jobs pointed to lack of sufficient workers with engineering skills to make such production possible. Jobs stated that he would need 30,000 such engineers if Apple were to make iPhones in the United States, but “You can’t find that many in America to hire.”
The situation hasn’t changed much in the past 10 years. As an article in the Wall Street Journal observed in March 2020, in addition to a large number of unskilled workers, Foxconn employs in China, “Tens of thousands of experienced manufacturing engineers [to] oversee the [production] process. Finding a comparable amount of unskilled and skilled labor [elsewhere] is impossible.”
Although some firms were attempting to reduce their reliance on Chinese factories in response to the coronavirus pandemic, because the United States lacks a comparative advantage in the assembly of consumer electronics, it seemed unlikely that those factories would be relocated here. But the coronavirus pandemic may lead some U.S. firms to change their supply chains in other ways. For instance, firms may now put greater value on redundancy. Apple might underwrite the cost to its suppliers of building facilities in several Asian countries to assemble iPhones. In the event of problems occurring in one country, this redundant capacity would allow production to switch from factories in one country to factories in other countries.
Similarly, some firms may rethink their inventory management. Before the 1970s, most manufacturing firms kept substantial inventories of parts and components. Retail firms often kept substantial inventories of goods in warehouses. This approach began to change during the 1970s, as Toyota pioneered just-in-time inventory systems in which firms accept shipments from suppliers as close as possible to the time they will be needed. Most manufacturers in the United States and elsewhere adopted these systems, as did many retailers.
For example, at Walmart, as goods are sold in the stores, this point-of-sale information is sent electronically to the firm’s distribution centers to help managers determine what products to ship to each store. This distribution system allows Walmart to minimize its inventory holdings. Because Walmart sells 15 to 25 percent of all the toothpaste, disposable diapers, dog food, and other products sold in the United States, it has involved many manufacturers in its supply chain. For example, a company such as Procter & Gamble, one of the world’s largest manufacturers of toothpaste, laundry detergent, and toilet paper, receives Wal-Mart’s point-of-sale and inventory information electronically. Procter & Gamble uses that information to determine its production schedules and the quantities and timing of its shipments to Walmart’s distribution centers.
But as the pandemic disrupted supply chains, many manufacturers had to suspend production because they did not receive timely shipments of parts. Similarly, Walmart and other retailers experienced stockouts—sales lost because the goods consumer want to buy aren’t on the shelves.
In 2020, firms were reconsidering their supply chains as they evaluated whether to underwrite the building of redundant capacity among their suppliers and whether to reduce the extent to which they relied on just-in-time inventory systems.
Sources: Debby Wu, “Not Made in China Is Global Tech’s Next Big Trend,” bloomberg.com, March 31, 2020; Yossi Sheffi, “Commentary: Supply-Chain Risks From the Coronavirus Demand Immediate Action,” Wall Street Journal, February 18, 2020; Tripp Mickle and Yoko Kubota, “Tim Cook and Apple Bet Everything on China. Then Coronavirus Hit,” Wall Street, March 3, 2020; and Walter Isaacson, Steve Jobs, New York: Simon & Schuster, 2011, pp. 544-547.
Question: Suppose that you’re a manager at Apple. Given the coronavirus pandemic, Apple is considering whether to underwrite the cost to its suppliers, such as Foxconn, of building redundant factories in countries outside of China.. The goal is to reduce the production problems that occur when factories are concentrated in a single country during a pandemic or other disaster. Your manager asks you to prepare a brief evaluation of this idea. What factors should you take into account in your evaluation?
Supports: Hubbard/O’Brien, Chapter 24, Money, Banks, and the Federal Reserve System; Macroeconomics Chapter 14; Essentials of Economics Chapter 16.
Apply the Concept: WHAT DO BANK RUNS TELL US ABOUT PANIC TOILET PAPER BUYING DURING THE CORONAVIRUS PANDEMIC?
Here’s the key point: Lack of confidence leads to panic buying, but a return of confidence leads to a return to normal buying.
In Chapter 24, Section 24.4 of the Hubbard and O’Brien Economics 8e text (Chapter 14, Section 14.4 of Macroeconomics 8e) we discuss the problem of bank runs that plagued the U.S. financial system during the years before the Federal Reserve began operations 1914. During the 2020 coronavirus epidemic in the United States consumers bought most of the toilet paper available in supermarkets leaving the shelves bare. Toilet paper runs turn out to be surprisingly similar to bank runs.
First, consider bank runs. The United States, like other countries, has a fractional reserve banking system, which means that banks keep less than 100 percent of their deposits as reserves. During most days, banks will experience roughly the same amount of funds being withdrawn as being deposited. But if, unexpectedly, a large number of depositors simultaneously attempt to withdraw their deposits from a bank, the bank experiences a run that it may not be able to meet with its cash on hand. If large numbers of banks experience runs, the result is a bank panic that can shut down the banking system.
Runs on commercial banks in the United States have effectively ended due to the combination of the Federal Reserve acting as a lender of last resort to banks experiencing runs and the Federal Deposit Insurance Corporation (FDIC) insuring bank deposits (currently up to $250,000 per person, per bank). But consider the situation prior to 1914. As a depositor in a bank during that period, if you had any reason to suspect that your bank was having problems, you had an incentive to be at the front of the line to withdraw your money. Even if you were convinced that your bank was well managed and its loans and investments were sound, if you believed the bank’s other depositors thought the bank had a problem, you still had an incentive to withdraw your money before the other depositors arrived and forced the bank to close. In other words, in the absence of a lender of last resort or deposit insurance, the stability of a bank depends on the confidence of its depositors. In such a situation, if bad news—or even false rumors—shakes that confidence, a bank will experience a run.
Moreover, without a system of government deposit insurance, bad news about one bank can snowball and affect other banks, in a process called contagion. Once one bank has experienced a run, depositors of other banks may become concerned that their banks might also have problems. These depositors have an incentive to withdraw their money from their banks to avoid losing it should their banks be forced to close.
Now think about toilet paper in supermarkets. From long experience, supermarkets, such as Kroger, Walmart, and Giant Eagle, know their usual daily sales and can place orders that will keep their shelves stocked. The same is true of online sites like Amazon. By the same token, manufacturers like Kimberly-Clark and Procter and Gamble, set their production schedules to meet their usual monthly sales. Consumers buy toilet paper as needed, confident that supermarkets will always have some available.
Photo of empty supermarket shelves taken in Boston, MA in March 2020. Credit: Lena Buananno
But then the coronavirus hit and in some states non-essential businesses, colleges, and schools were closed and people were advised to stay home as much as possible. Supermarkets remained open everywhere as did, of course, online sites such as Amazon. But as people began to consider what products they would need if they were to remain at home for several weeks, toilet paper came to mind.
At first only a few people decided to buy several weeks worth of toilet paper at one time, but that was enough to make the shelves holding toilet paper begin to look bare in some supermarkets. As they saw the bare shelves, some people who would otherwise have just bought their usual number of rolls decided that they, too, needed to buy several weeks worth, which made the shelves look even more bare, which inspired more to people to buy several weeks worth, and so on until most supermarkets had sold out of toilet paper, as did Amazon and other online sites.
Before 1914 if you were a bank depositor, you knew that if other depositors were withdrawing their money, you had to withdraw yours before the bank had given out all its cash and closed. In the coronavirus epidemic, you knew that if you failed to rush to the supermarket to buy toilet paper, the supermarket was likely to be sold out when you needed some. Just as banks relied on the confidence of depositors that their money would be available when they wanted to withdraw it, supermarkets rely on the confidence of shoppers that toilet paper and other products will be available to buy when they need them. A loss of that confidence can cause a run on toilet paper just as before 1914 a similar loss of confidence caused runs on banks.
In bank runs, depositors are, in effect, transferring a large part of the country’s inventory of currency out of banks, where it’s usually kept, and into the depositors’ homes. Similarly, during the epidemic, consumers were transferring a large part of the country’s inventory of toilet paper out of supermarkets and into the consumers’ homes. Just as currency is more efficiently stored in banks to be withdrawn only as depositors need it, toilet paper is more efficiently stored in supermarkets (or in Amazon’s warehouses) to be purchased only when consumers need it.
Notice that contagion is even more of a problem in a toilet paper run than in a bank run. People can ordinarily only withdraw funds from banks where they have a deposit, but consumers can buy toilet paper wherever they can find it. And during the epidemic there were news stories of people traveling from store to store—often starting early in the morning—buying up toilet paper.
Finally, should the government’s response to the toilet paper run of 2020 be similar to its response to the bank runs of the 1800s and early 1900s? To end bank runs, Congress established (1) the Fed—to lend banks currency during a run—and (2) the FDIC—to insure deposits, thereby removing a depositor’s fear that the depositor needed to be near the head of the line to withdraw money before the bank’s cash holdings were exhausted.
The situation is different with toilet paper. Supermarkets are eventually able to obtain as much toilet paper as they need from manufacturers. Once production increases enough to restock supermarket shelves, consumers—many of whom already have enough toilet paper to last them several weeks—stop panic buying and ample quantities of toilet paper will be available. Once consumers regain confidence that toilet paper will be available when they need it, they have less incentive to hoard it. Just as a lack of confidence leads to panic buying, a return of confidence leads to a return to normal buying.
Although socialist countries such as Venezuela, Cuba, and North Korea suffer from chronic shortages of many goods, market economies like the United States experience shortages only under unusual circumstances like an epidemic or natural disaster.
Note: For more on bank panics, see Hubbard and O’Brien, Money, Banking, and Financial Markets, 3rd edition, Chapter 12 on which some of this discussion is based.
Sources: Sharon Terlep, “Relax, America: The U.S. Has Plenty of Toilet Paper,” Wall Street Journal, March 16, 2020; Matthew Boyle, “You’ll Get Your Toilet Paper, But Tough Choices Have to Be Made: Grocery CEO,” bloomberg.com, March 18, 2020; and Michael Corkery and Sapna Maheshwari, “Is There Really a Toilet Paper Shortage?” New York Times, March 13, 2020.
Question
Suppose that as a result of their experience during the coronavirus pandemic, the typical household begins to store two weeks worth of toilet paper instead of just a few days worth as they had previously been doing. Will the result be that toilet paper manufacturers permanently increase the quantity of toilet paper that they produce each week?
Instructors can access the answers to these questions by emailing Pearson at christopher.dejohn@pearson.com and stating your name, affiliation, school email address, course number.
Supports: Hubbard/O’Brien, Chapter 23, Aggregate Demand and Aggregate Supply Analysis; Macroeconomics Chapter 13; Essentials of Economics Chapter 15.
Apply the Concept: Using the Aggregate Demand and Aggregate Supply Model to Analyze the Coronavirus Pandemic
Here’s the key point: The coronavirus caused large shifts in short-run aggregate supply and in aggregate demand, so this virus caused by far the largest decline in real GDP and largest increase in unemployment over such a brief period in U.S. history.
In early 2020, the United States experienced an epidemic from a novel coronavirus that causes the disease Covid-19. We can use the aggregate demand and aggregate supply model to analyze some of the key macroeconomic effects on the U.S. economy from this epidemic. As we’ve seen, economists distinguish between recessions caused by an aggregate supply shock, such as an unexpected increase in oil prices, or an aggregate demand shock, such as a decline in spending on new houses. The effects of the coronavirus combined both an aggregate supply shock and an aggregate demand shock.
To this point, we have discussed negative aggregate supply shocks that shift only the short-run aggregate supply curve to the left, leaving the aggregate demand curve unaffected. It’s usually reasonable to assume that the aggregate demand curve doesn’t shift when analyzing the effects of the two main types of supply shocks: (1) a supply shock caused by an increase in the cost of producing goods and services; or (2) a supply shock that reduces the capacity of firms to produce goods and services.
An example of the first type of supply shock is an increase in oil prices. Higher oil prices increase the cost of producing many goods and services, shifting the short-run aggregate supply curve to the left. (See panel (a) of Figure 23.7 in the Hubbard and O’Brien 8th edition text). Total spending in the economy declines, which we show as a movement along the aggregate demand curve (not as a shift in the aggregate demand curve). That movement is the result of the higher price level reducing the spending of households and firms on consumption, investment, and net exports.
The second type of supply shock reduces the capacity of firms and is typically the result of a natural disaster such as the Tohoku earthquake that Japan experienced in 2011. The earthquake triggered a tsunami that disabled the nuclear power plant in the city of Fukushima. The disruption in the power supply to several cities, including Tokyo took months to resolve. During this period, the ability of many Japanese firms to produce goods and services was reduced, causing the short-run aggregate supply curve to shift to the left. Notice that a natural disaster will also have some effect on aggregate demand if there are deaths (about 16,000 people in Japan died as a result of the Tohoku earthquake and tsunami) or if some firms are physically destroyed, making their workers unemployed, thereby reducing the workers’ incomes and their consumption spending. But because the resulting shift of the aggregate demand curve is likely to be small relative to the shift in the short-run aggregate supply curve, it makes sense to concentrate on the effects of the shift in short-run aggregate supply.
The coronavirus pandemic was an unprecedented supply shock to the U.S. economy. The virus originated in the city of Wuhan in China. A number of U.S. firms rely on Chinese suppliers in the Wuhan area. In January 2020, as the government of China closed factories in that area to control the spread of the virus, some U.S. firms, including Apple and Nike, announced that they would be unable to meet their production goals because some of their suppliers had shut down. By March, as the virus began to become widespread in the United States, governors in a number of states ordered all non-essential firms to close.
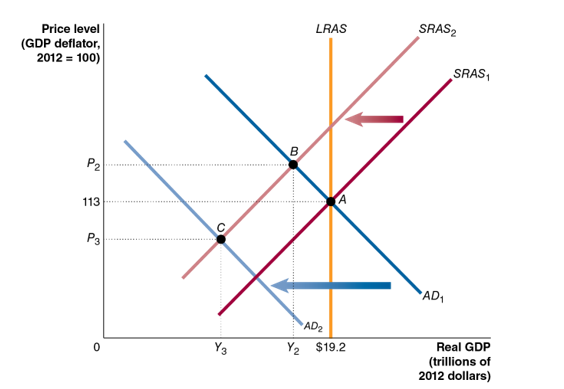
The following figure illustrates the effects of the virus on U.S. real GDP and the price level. In the figure, at the beginning of 2020, the economy was in long-run macroeconomic equilibrium, with the short-run aggregate supply curve, SRAS1, intersecting the aggregate demand curve, AD1, at point A on the long-run aggregate supply curve, LRAS. Equilibrium occurred at real GDP of $19.2 trillion and a price level of 113. By disrupting the global supply chains of U.S. firms and by leading governments to order the closure of many businesses, the virus caused the short-run aggregate supply curve to shift to the left from SRAS1 to SRAS2. (Note that in the following discussion, we are using the basic aggregate demand and aggregate supply model. In this model, there is no economic growth, so the long-run aggregate supply curve (LRAS) doesn’t shift.)
If the virus had caused a supply shock of the first type that we described earlier—affecting the economy in a way similar to a large increase in oil prices—the new short-run equilibrium would have occurred at point B. Real GDP would have declined from $19.2 trillion to Y2 and the price level would have risen from 113 to P2. (We prepared this content and graph in early April, so we don’t yet know the full effects of the virus on the economy. We therefore don’t attempt to put actual values on the new short-run equilibrium real GDP and price level.)
But point B was not the new short-run equilibrium for several reasons:
Reduced consumption spending The government closed many businesses, directly reducing output resulting in millions of workers losing their jobs. As workers experienced falling incomes, they reduced their consumption spending.
Reduced investmentspending Many residential and business construction projects had to be suspended, reducing investment spending.
Reduced exports U.S. exports declined because the pandemic also led to closures of businesses in Europe, Canada, Japan, and other U.S. trading partners.
As a result of these factors, the United States experienced a sharp decline in total spending in the economy, shifting the aggregate demand curve to the left from AD1 to AD2. In analyzing the supply shock resulting from the coronavirus, we have to include the effect on aggregate demand, which we ignore when considering supply shocks caused by higher oil prices or by a natural disaster, such as an earthquake.
Because the coronavirus pandemic caused both the SRAS and the AD curves to shift to the left, the new short-run equilibrium occurred at point C, with real GDP having fallen to Y3 and the price level having declined to P3. Note that if the shift of the SRAS curve had been larger than the shift of the AD curve, real GDP would have fallen further and the price level would have risen, rather than fallen.
The coronavirus pandemic resulted in very large shifts in short-run aggregate supply and in aggregate demand, so this virus caused by far the largest decline in real GDP and largest increase in unemployment over such a brief period in the history of the United States. The U.S. economy also suffered a large decline in real GDP and a substantial increase in unemployment during the Great Depression of the 1930s. But the decline in the U.S. economy during that economic contraction had been stretched out over the period from August 1929 to March 1933, rather than happening suddenly as was true with the contraction caused by the coronavirus.
Sources: Ruth Simon and Austen Hufford, “Not Just Nike and Apple: Small U.S. Firms Disrupted by Coronavirus,” Wall Street Journal, February 21, 2020; Eric Morath, Jon Hilsenrath, and Sarah Chaney, “Record 3.28 Million File for U.S. Jobless Benefits,” Wall Street Journal, March 26, 2020; and “158 Million Americans Told to Stay Home, but Trump Pledges to Keep It Short,” New York Times, March 26, 2020.
Question
During the spring of 2020, many state and local governments ordered most non-essential businesses to close. Suppose that, as a result, the short-run aggregate supply curve, SRAS, shifted to the left by more than did the aggregate demand curve, AD. On the graph shown here, draw in a new SRAS given this assumption. Label this curve SRAS3. Label the new equilibrium level of real GDP Y4 and the new equilibrium price level P4. Briefly explain the relationship between Y3 and Y4 and between P3 and P4, as shown in your graph.
Instructors can access the answers to these questions by emailing Pearson at christopher.dejohn@pearson.com and stating your name, affiliation, school email address, course number.