Image of GDP generated by GTP-4o
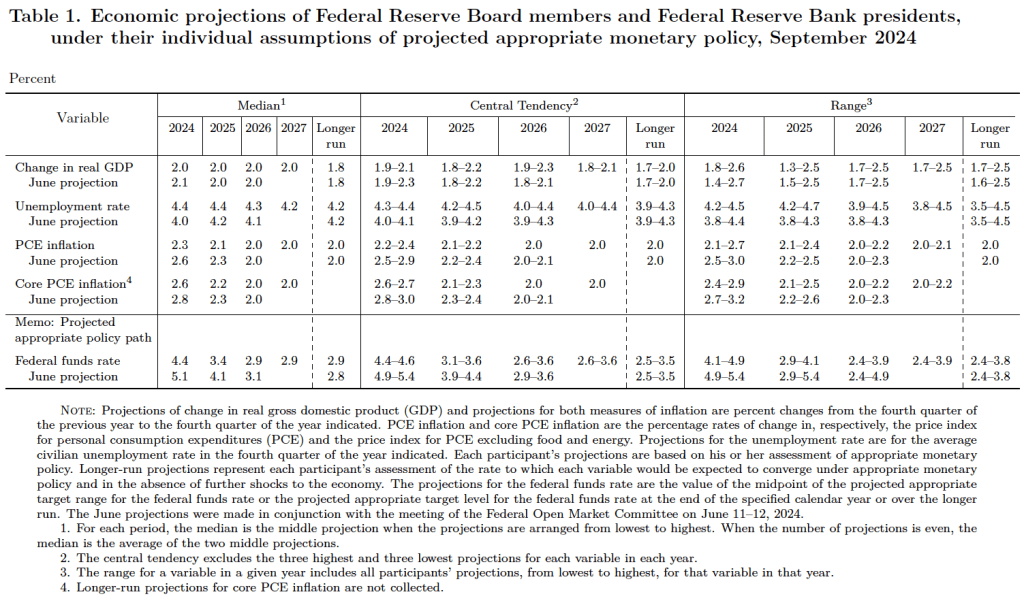
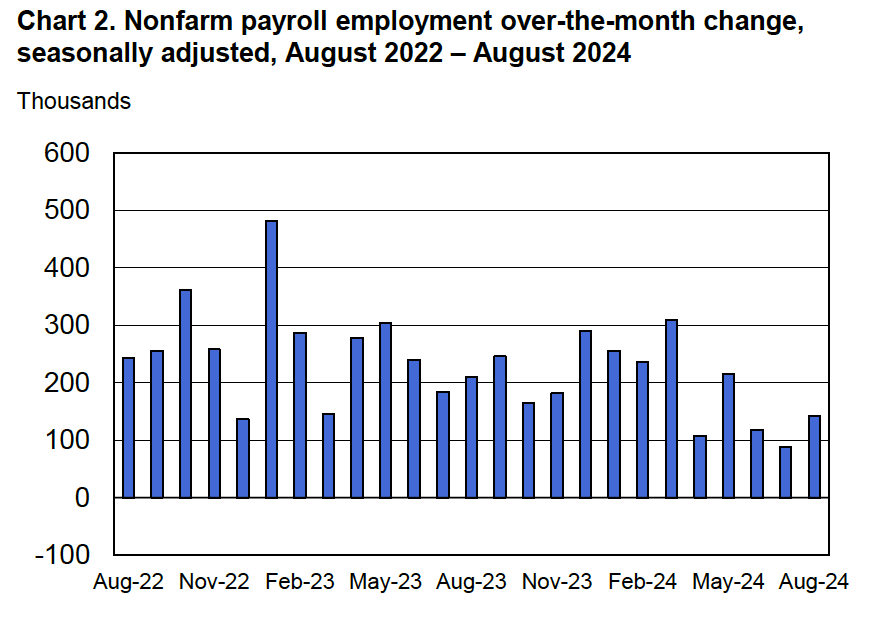
This week, two data releases paint a picture of the U.S. economy as possibly slowing slightly, but still demonstrating considerable strength. The Bureau of Economic Analysis (BEA) released its advance estimate of GDP for the third quarter of 2024. (The report can be found here.) The BEA estimates that real GDP increased by 2.8 percent at an annual rate in the third quarter—July through September. That was down from the 3.0 percent increase in real GDP in the second quarter and below the 3.1 percent that economists surveyed by the Wall Street Journal had expected. The following figure from the BEA report shows the growth rate of real GDP in each quarter since the fourth quarter of 2020.
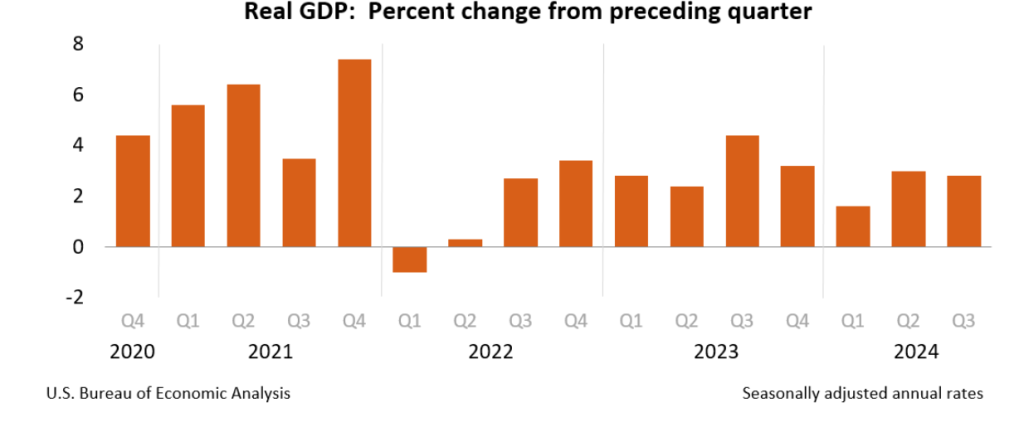
Two other points to note: In June, the Congressional Budget Office (CBO) had forecast that the growth rate of real GDP in the third quarter would be only 2.1 percent. The CBO forecasts that, over the longer run, real GDP will grow at a rate of 1.7 to 1.8 percent per year. So, the growth rate of real GDP according to the BEA’s advance estimate (which, it’s worth recalling, is subject to potentially large revisions) was above expectations from earlier this year and above the likely long run growth rate.
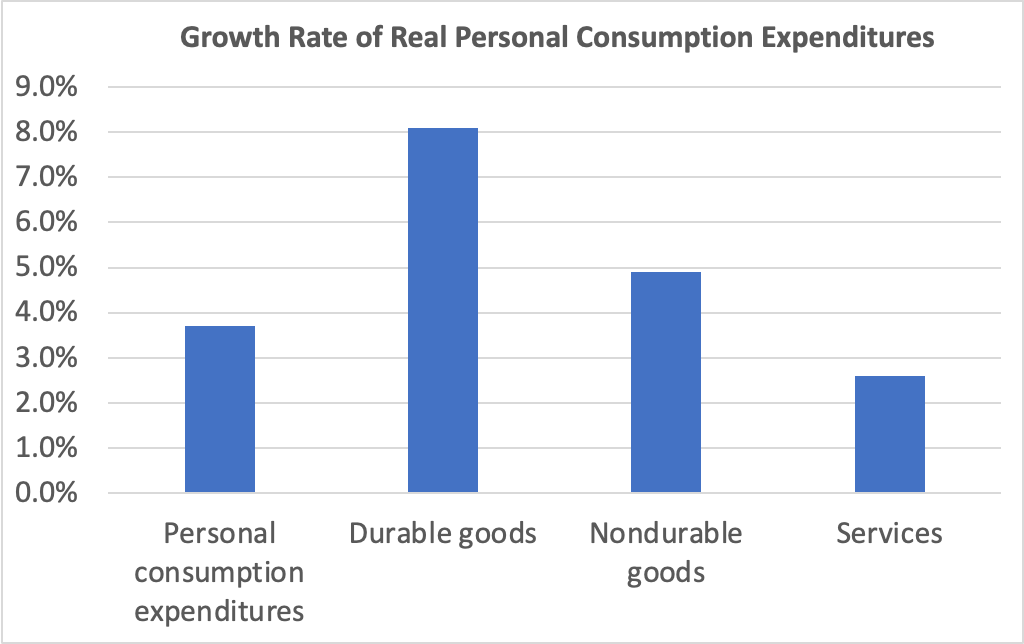
Consumer spending was the largest contributor to third quarter GDP growth. The following figure shows growth rates of real personal consumption expenditures and the subcategories of expenditures on durable goods, nondurable goods, and services. There was strong growth in each component of consumption spending. The 8.1 percent increase in expenditures on durables was particularly strong. It was the second quarter in a row of strong growth in spending on durables after a decline of –1.8 percent in the first quarter.
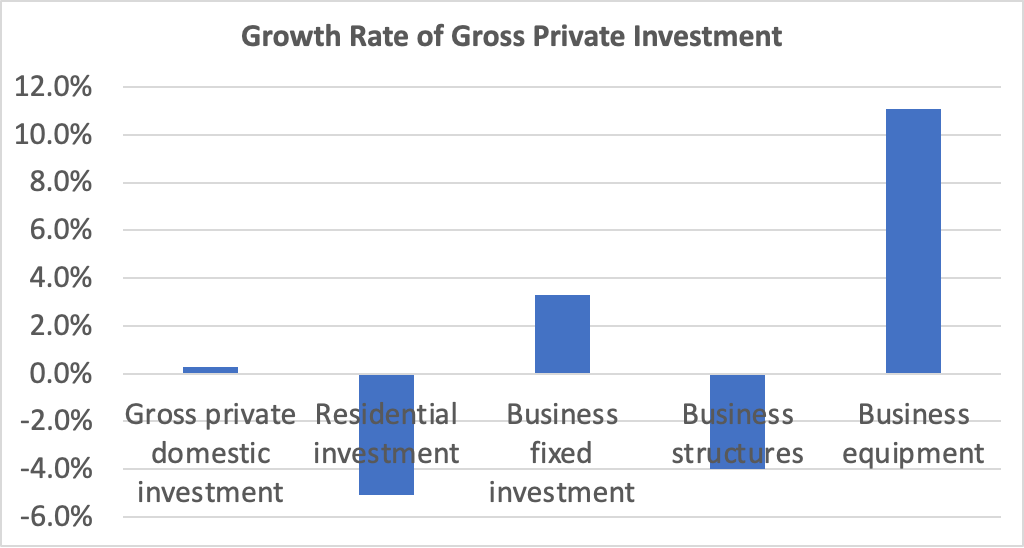
Investment spending and its components were a more mixed bag, as shown in the following figure. Investment spending is always more volatile than consumption spending. Overall, gross private domestic investment increased at a slow rate of 0.3 percent—the slowest rate since a decline in the first quarter of 2023. Residential investment decreased by 5.1 percent, reflecting difficulties in residential construction due to mortgage interest rates remaining high. Business fixed investment grew 3.1 percent, powered by an increase of 11.1 percent in spending on business equipment. Spending on structures—such as factories and office buildings—had increased rapidly over the past two years before slowing to a 0.2 percent increase in the second quarter and a decline of 4.0 percent in the fourth quarter.
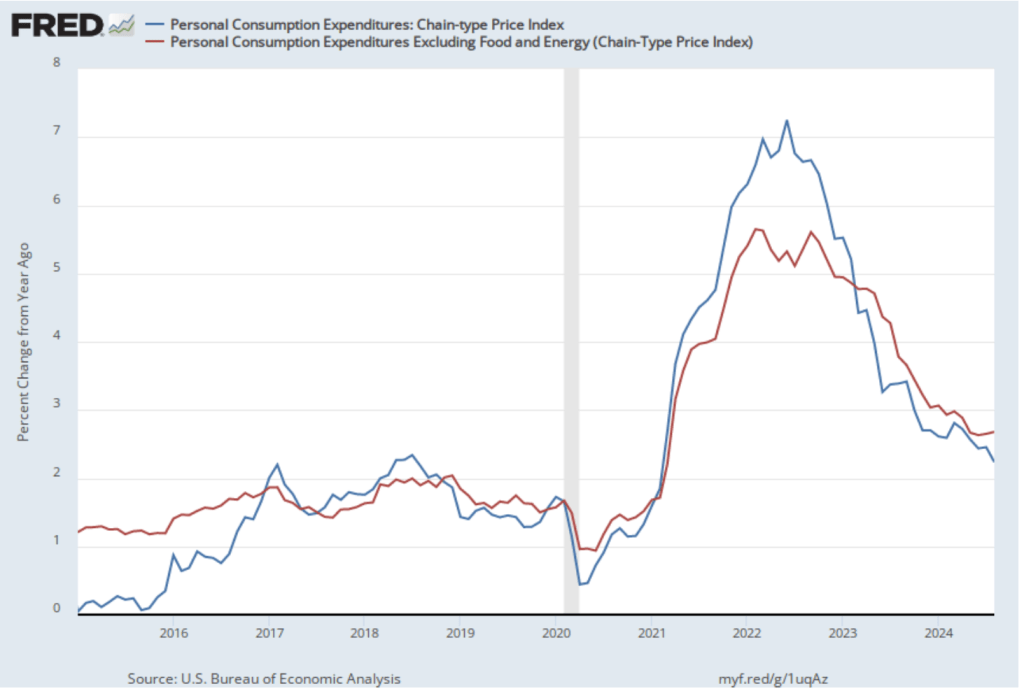
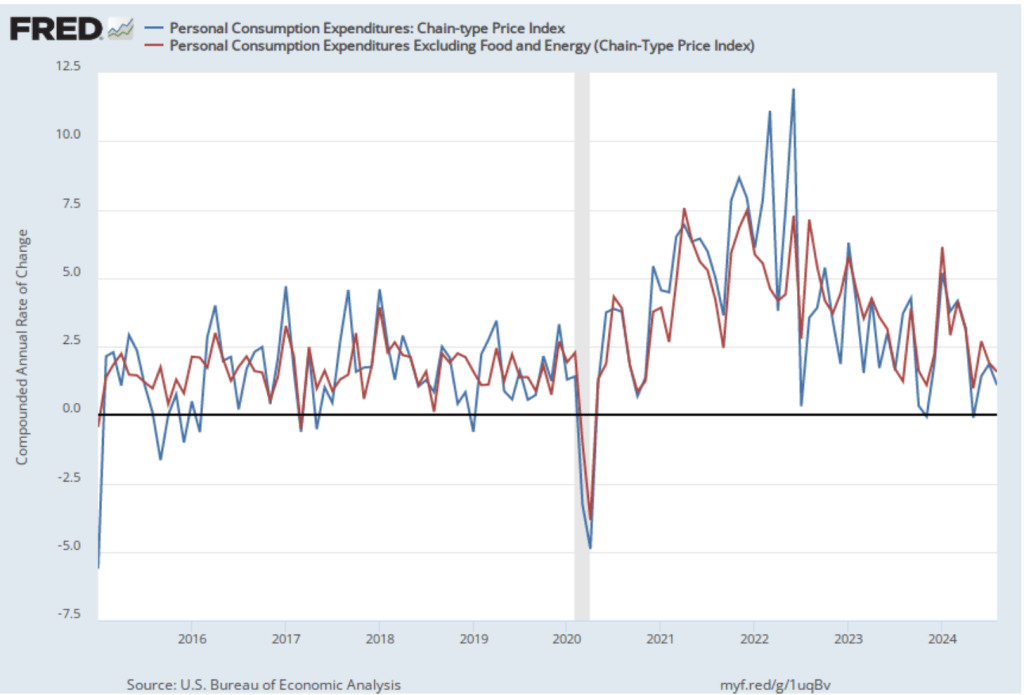
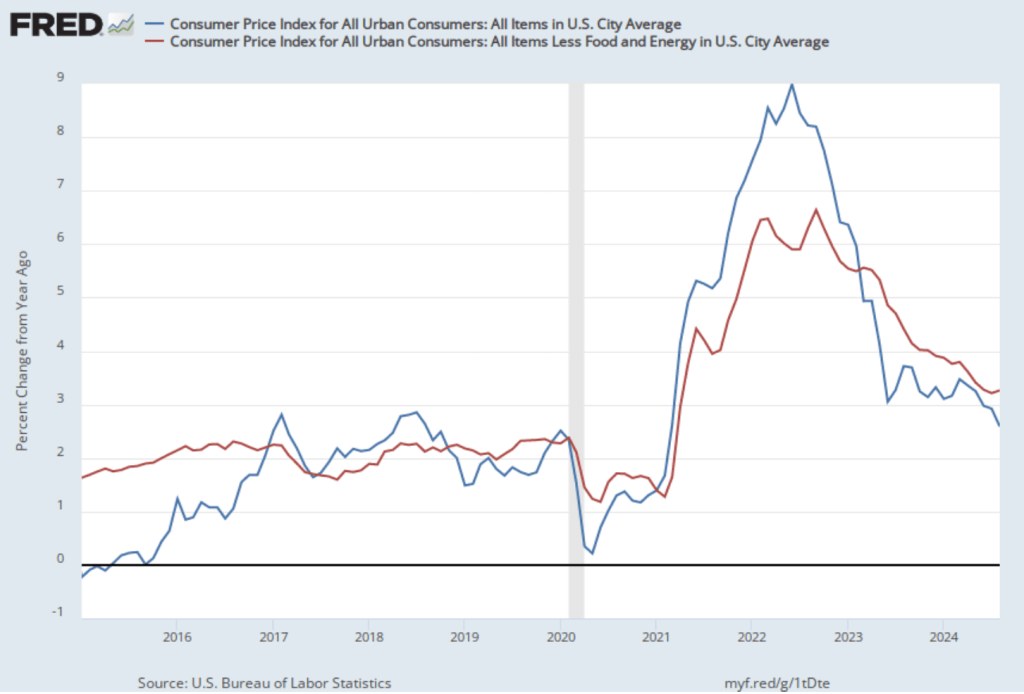
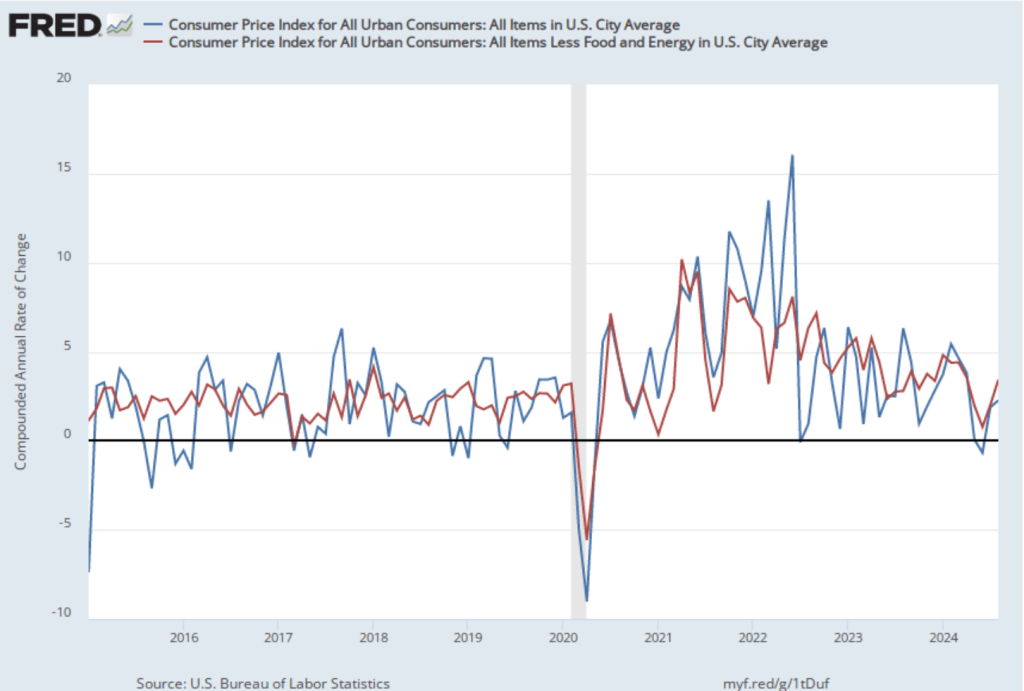
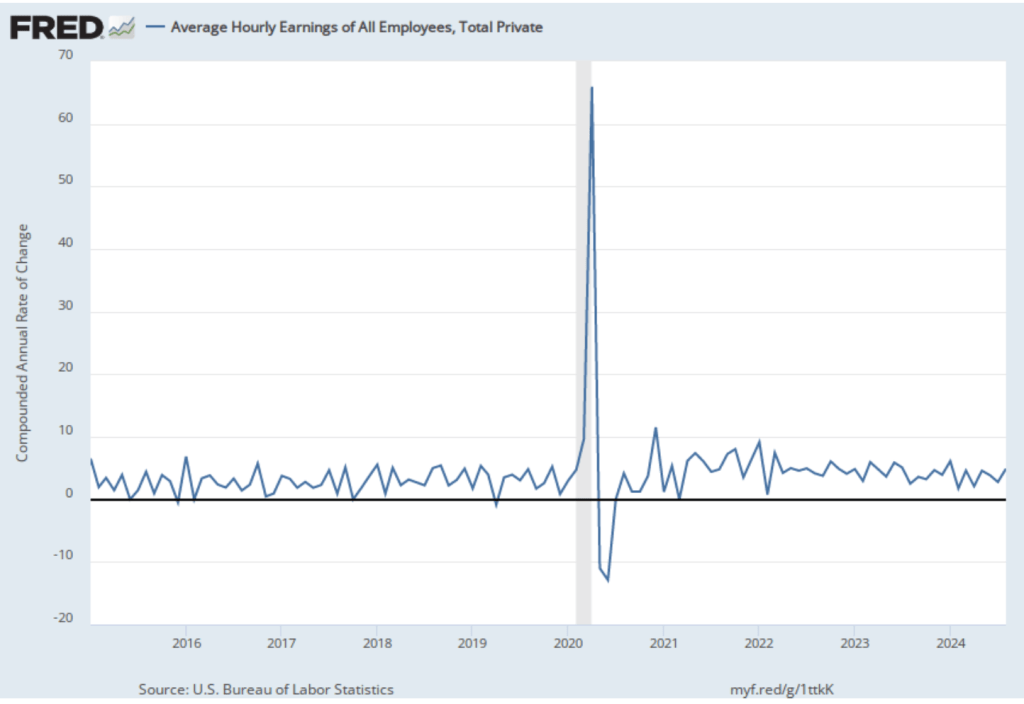
The GDP report also contained data on the private consumption expenditure (PCE) price index, which the FOMC uses to determine whether it is achieving its goal of a 2 percent inflation rate. The following figure shows inflation as measured using the PCE and the core PCE—which excludes food and energy prices—since the beginning of 2016. (Note that these inflation rates are measured using quarterly data and as compound annual rates of change.) Despite the strong growth in real GDP, inflation as measured by PCE was only 1.5 percent, below the 2.5 percent increase in the second quarter and below the Federal Reserve’s 2.0 percent inflation target. Core PCE, which may be a better indicator of the likely course of inflation in the future, declined to 2.2 percent in the third quarter from 2.8 percent in the second quarter. The third quarter increase was slightly above the rate that economists surveyed by the Wall Street Journal had expected.

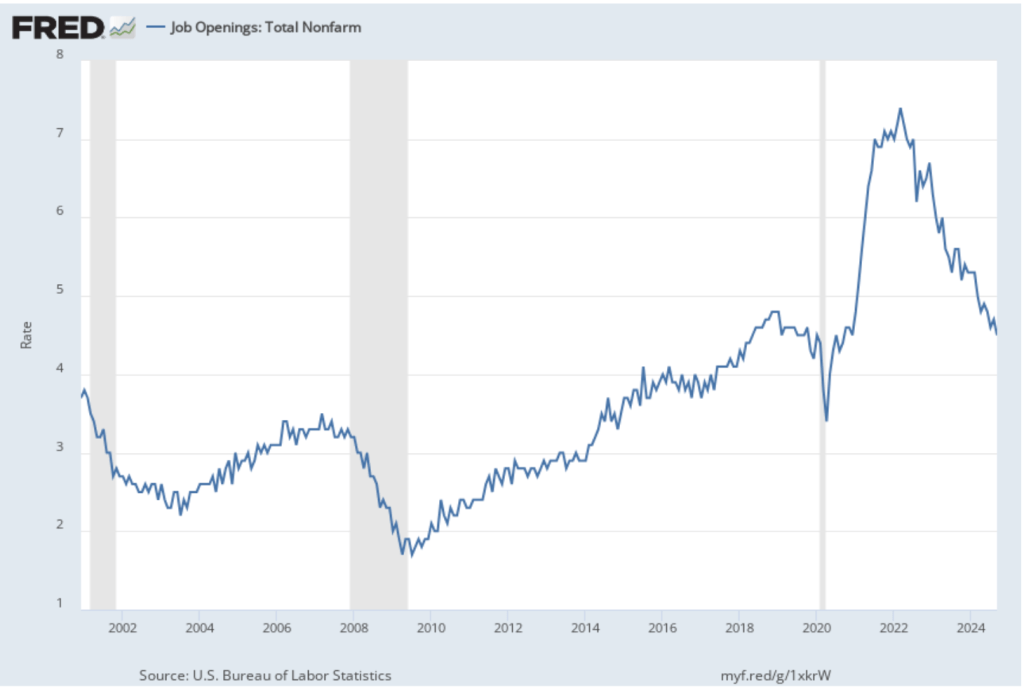
This week, the Bureau of Labor Statistics (BLS) released its “Job Openings and Labor Turnover” (JOLTS) report for September 2024. The report provided data indicating some weakening in the U.S. labor market. The following figure shows the rate of job openings. The BLS defines a job opening as a full-time or part-time job that a firm is advertising and that will start within 30 days and the rate of job openings as the number of job openings divided by the number of job openings plus the number of employed workers, multiplied by 100. The 4.9 percent job opening rate in September continued the slow decline from the peak rate of 7.4 percent in March 2022. The rate is also slightly below the rate during late 2018 and 2019 before the Covid pandemic.
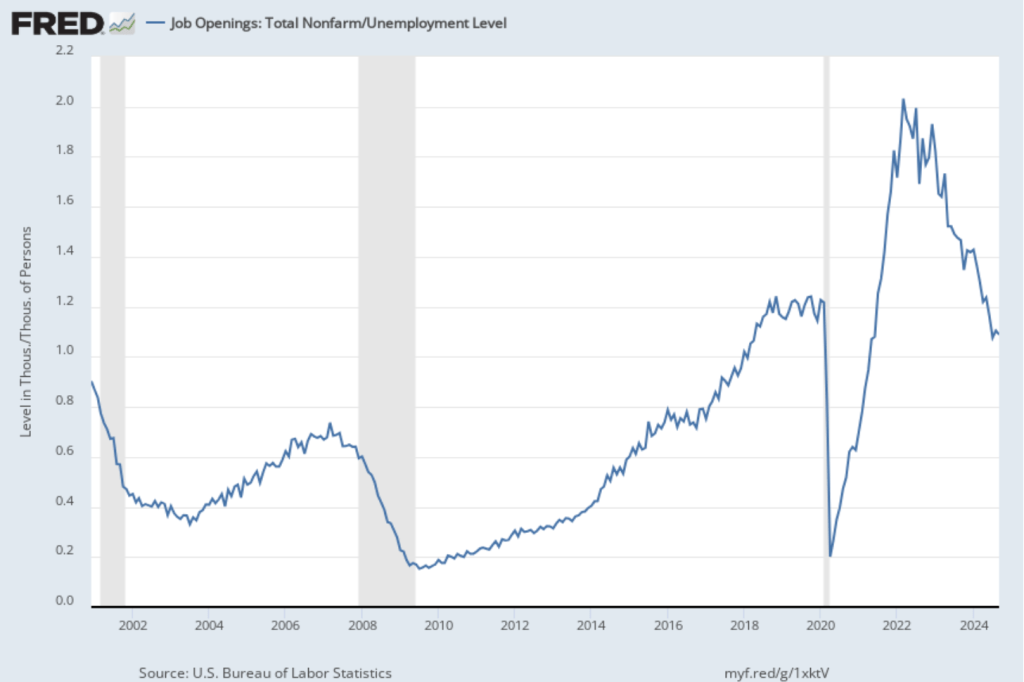
In the following figure, we compare the total number of job openings to the total number of people unemployed. The figure shows a slow decline from a peak of more than 2 job openings per unemployed person in the spring of 2022 to 1.1 job openings per employed person in September 2024, somewhat below the levels in 2019 and early 2020, before the pandemic. Note that the number is still above 1.0, indicating that the demand for labor is still high, although no higher than during the strong labor market of 2019.
Finally, note from the figure that over the period during which the BLS has been conducting the JOLTS survey, the rate of job openings has declined just before and during recessions. Does that fact indicate that the decline in the job opening rate in recent months is signaling that a recession is likely to begin soon? We can’t say with certainty, particularly because the labor market was severely disrupted by the pandemic. The decline in the job openings rate since 2022 is more likely to reflect the labor market returning to more normal conditions than a weakening in hiring that signals a recession is coming.
To summarize these data:
- Real GDP growth is strong, although below what economists had been projecting.
- Inflation as measured by the PCE is below the Fed’s 2 percent target, although core inflation remains slightly above the target.
- The job market has weakened somewhat, although there is no strong indication that a recession will happen in the near future.