Image generated by GTP-4o illustrating inflation
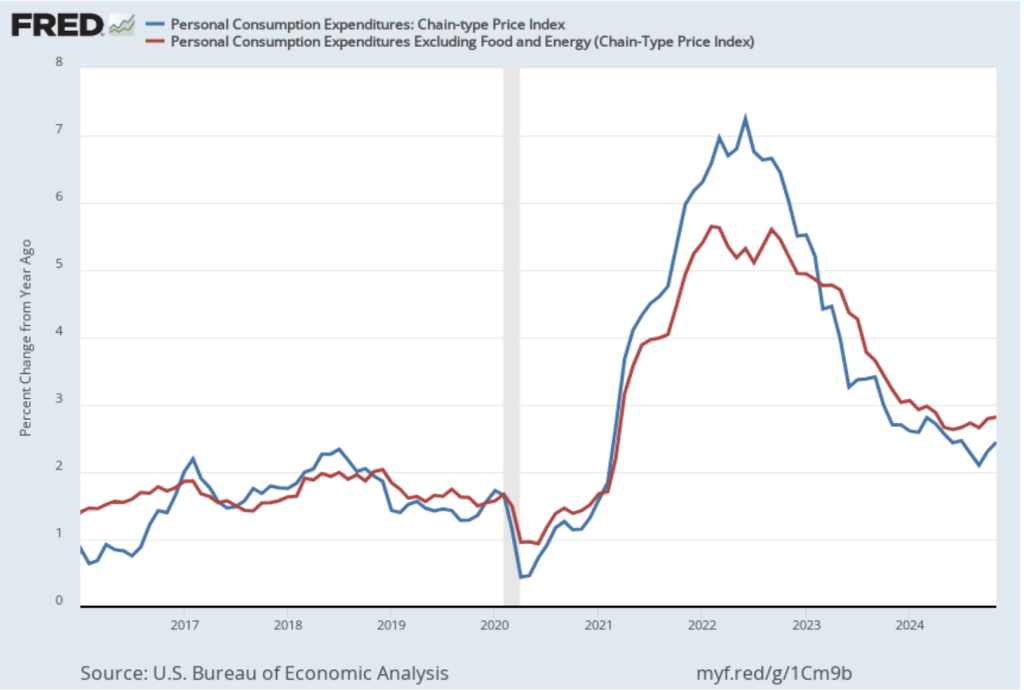
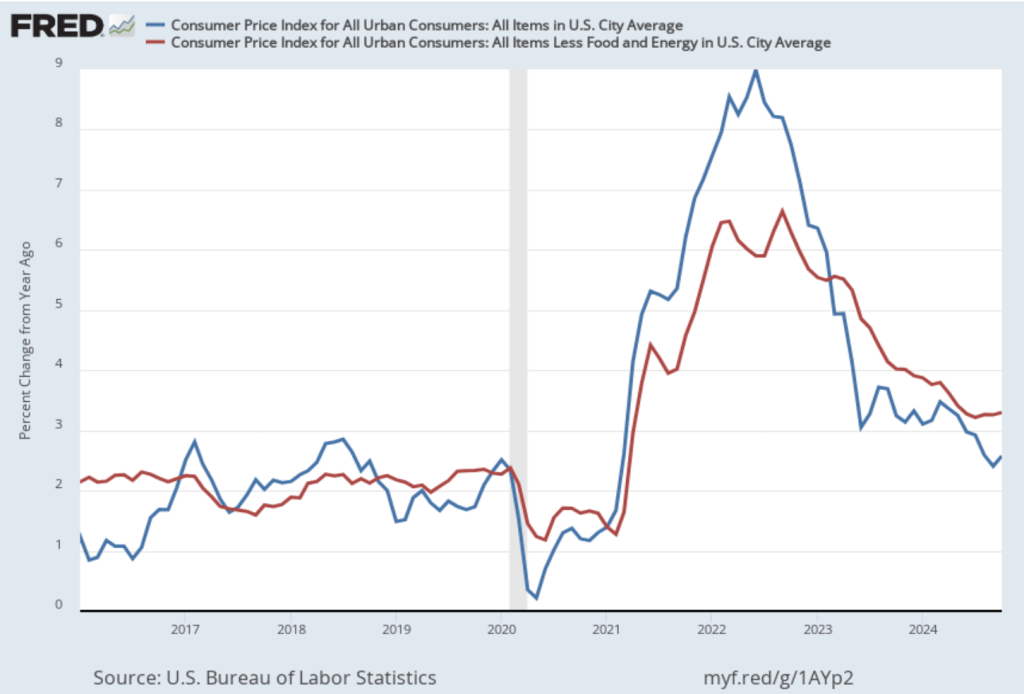
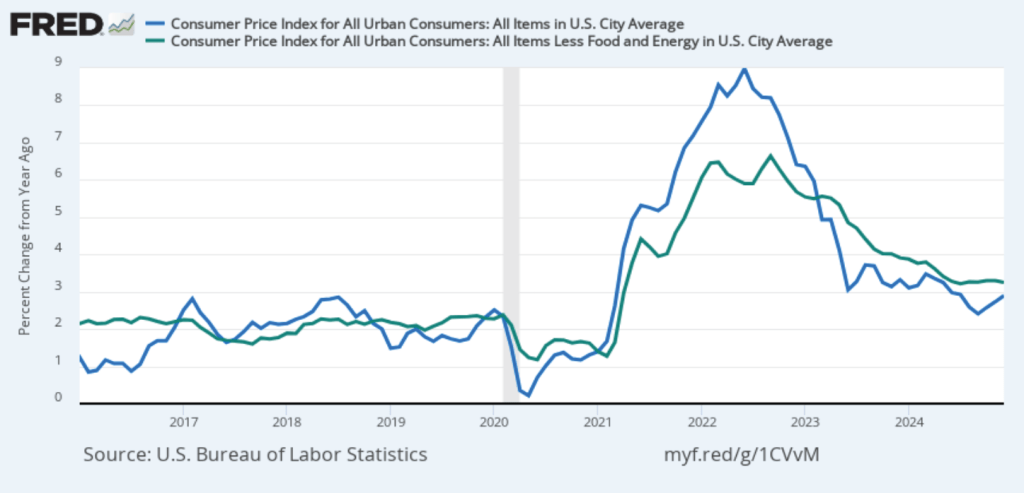
On January 15, the Bureau of Labor Statistics (BLS) released its monthly report on the consumer price index (CPI). The following figure compares headline inflation (the blue line) and core inflation (the green line).
- The headline inflation rate, which is measured by the percentage change in the CPI from the same month in the previous month, was 2.9 percent in December—up from 2.7 percent in November.
- The core inflation rate, which excludes the prices of food and energy, was 3.2 percent in December—down from 3.3 percent in November.
Headline inflation was slightly above and core inflation was slightly below what economists surveyed had expected.
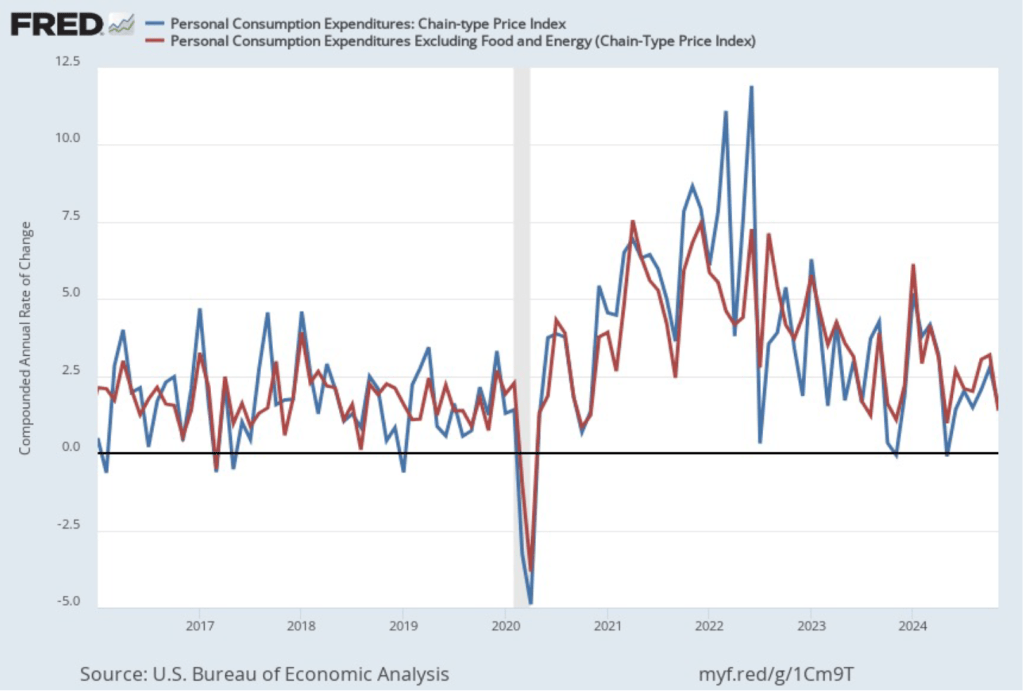
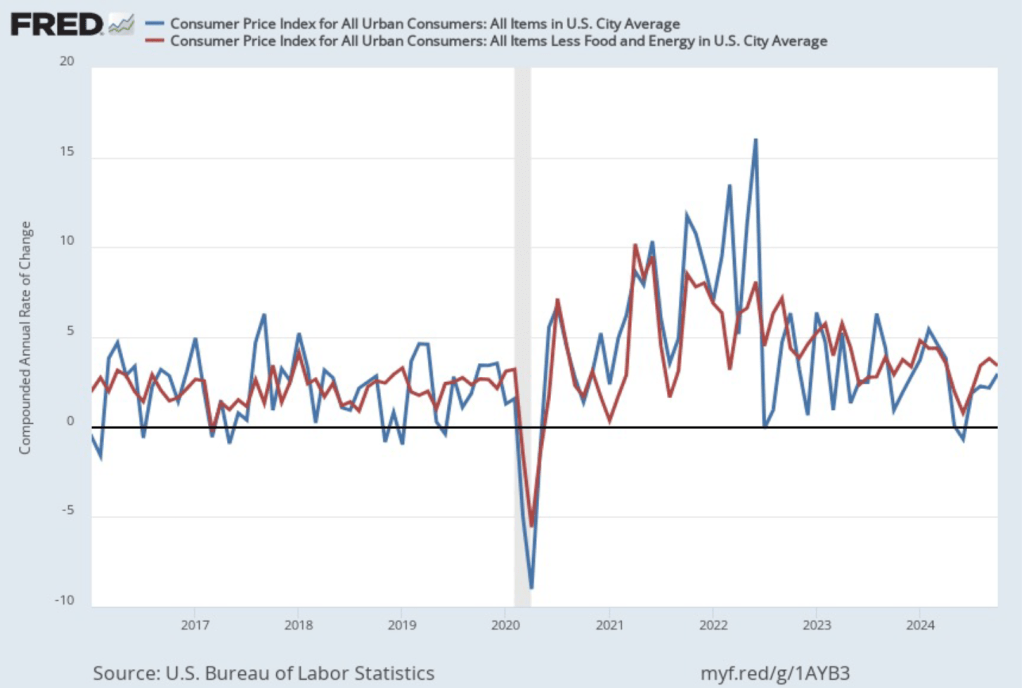
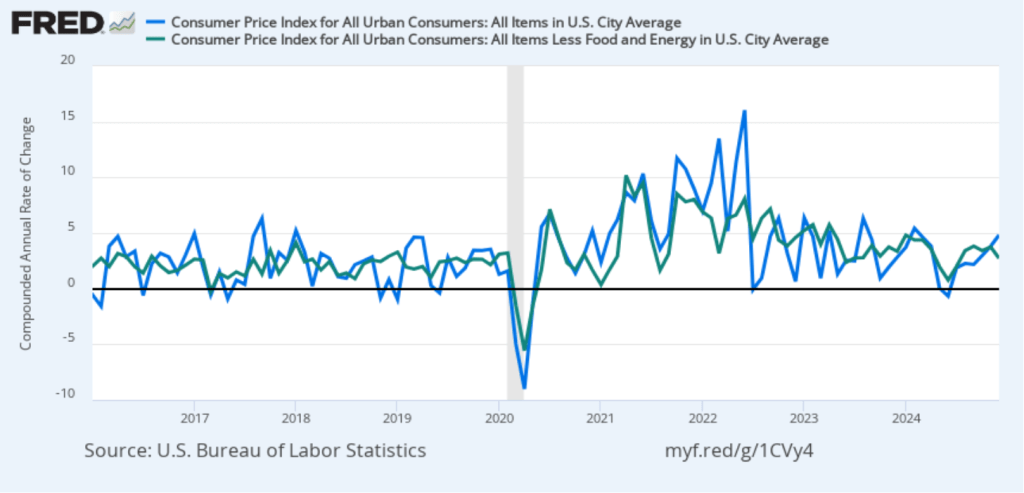
In the following figure, we look at the 1-month inflation rate for headline and core inflation—that is the annual inflation rate calculated by compounding the current month’s rate over an entire year. Calculated as the 1-month inflation rate, headline inflation (the blue line) jumped from 3.8 percent in November to 4.8 percent in December. Core inflation (the green line) decreased from 3.8 percent in November to 2.7 percent in December.
Overall, considering 1-month and 12-month inflation together, the most favorable news is the low value of the 1-month core inflation rate. The most concerning news is a sharp increase in 1-month headline inflation, which brought that measure to its highest reading since February 2024. On balance, this month’s CPI report doesn’t do much to challenge the conclusion of other recent inflation reports that progress on lowering inflation has slowed or, possibly, stalled. So, the probability of a “no landing” outcome, with inflation remaining above the Fed’s target for an indefinite period, seems to have at least slightly increased.
Of course, it’s important not to overinterpret the data from a single month. The figure shows that 1-month inflation is particularly volatile. Also note that the Fed uses the personal consumption expenditures (PCE) price index, rather than the CPI, to evaluate whether it is hitting its 2 percent annual inflation target.
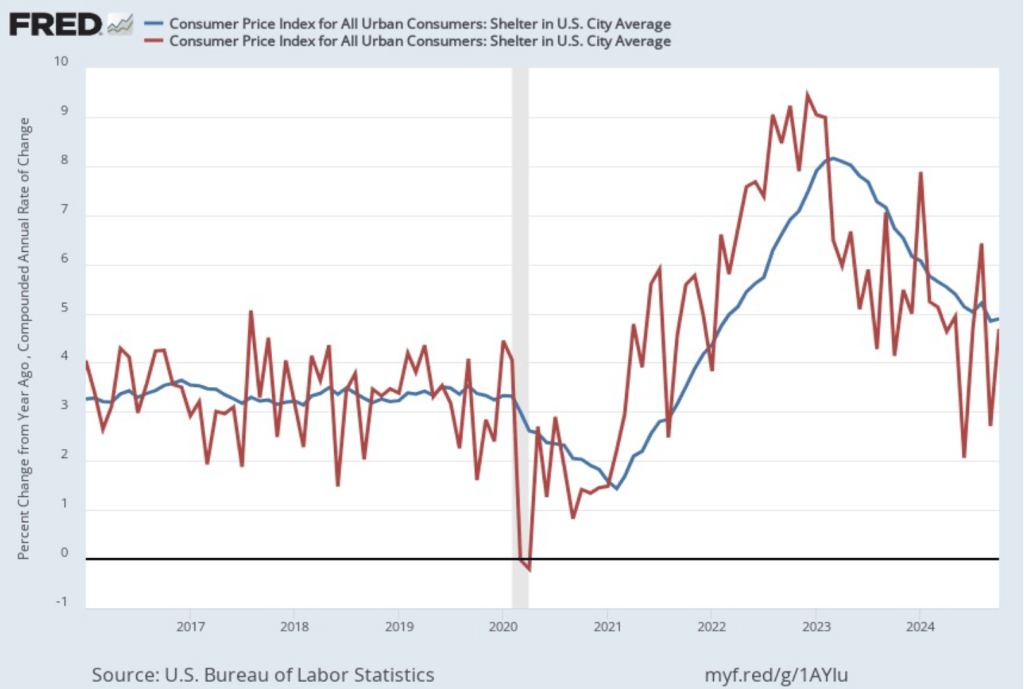
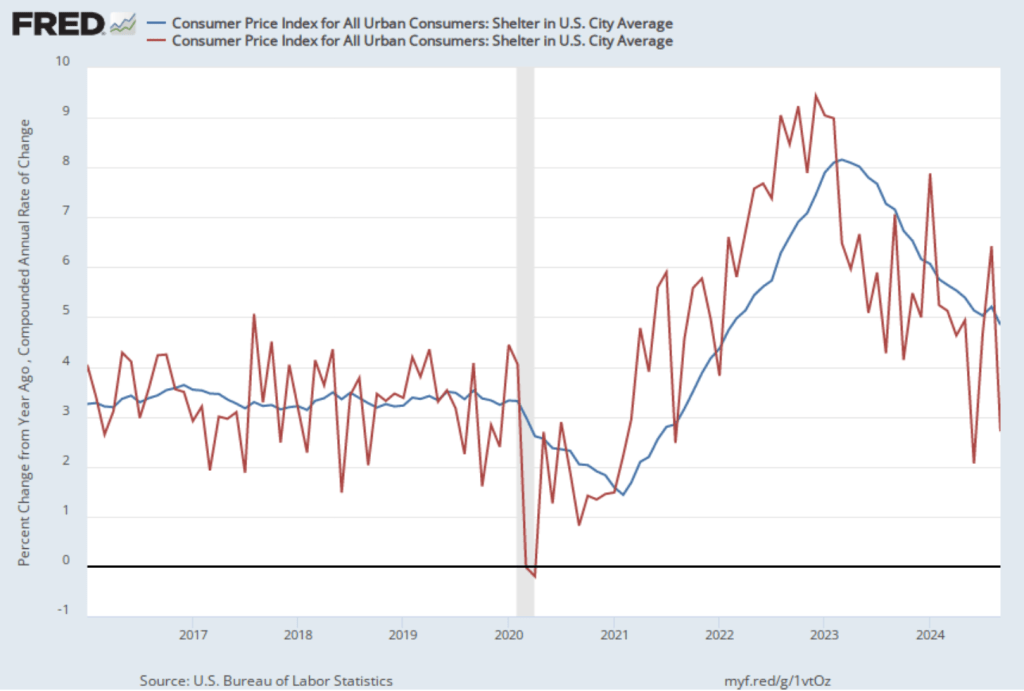
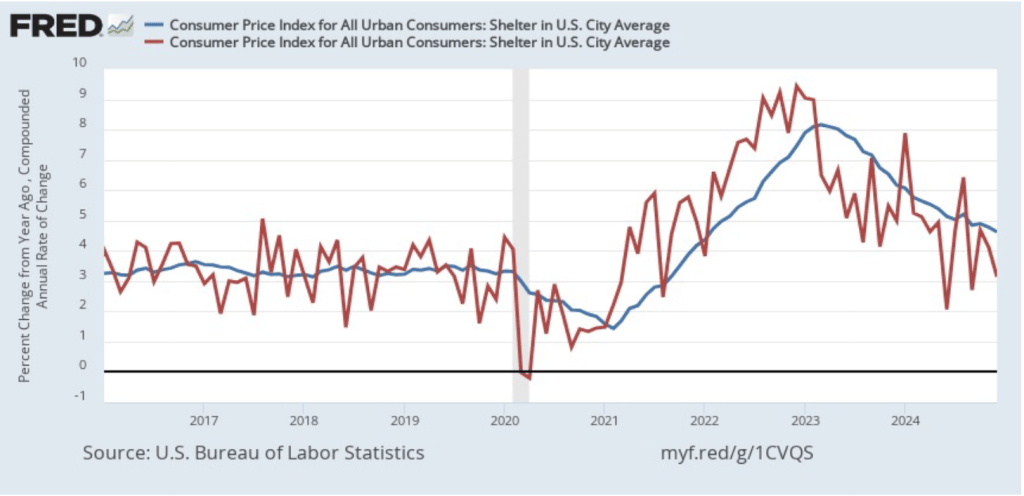
As we’ve discussed in previous blog posts, Federal Reserve Chair Jerome Powell and his colleagues on the Fed’s policymaking Federal Open Market Committee (FOMC) have been closely following inflation in the price of shelter. The price of “shelter” in the CPI, as explained here, includes both rent paid for an apartment or a house and “owners’ equivalent rent of residences (OER),” which is an estimate of what a house (or apartment) would rent for if the owner were renting it out. OER is included in the CPI to account for the value of the services an owner receives from living in an apartment or house.
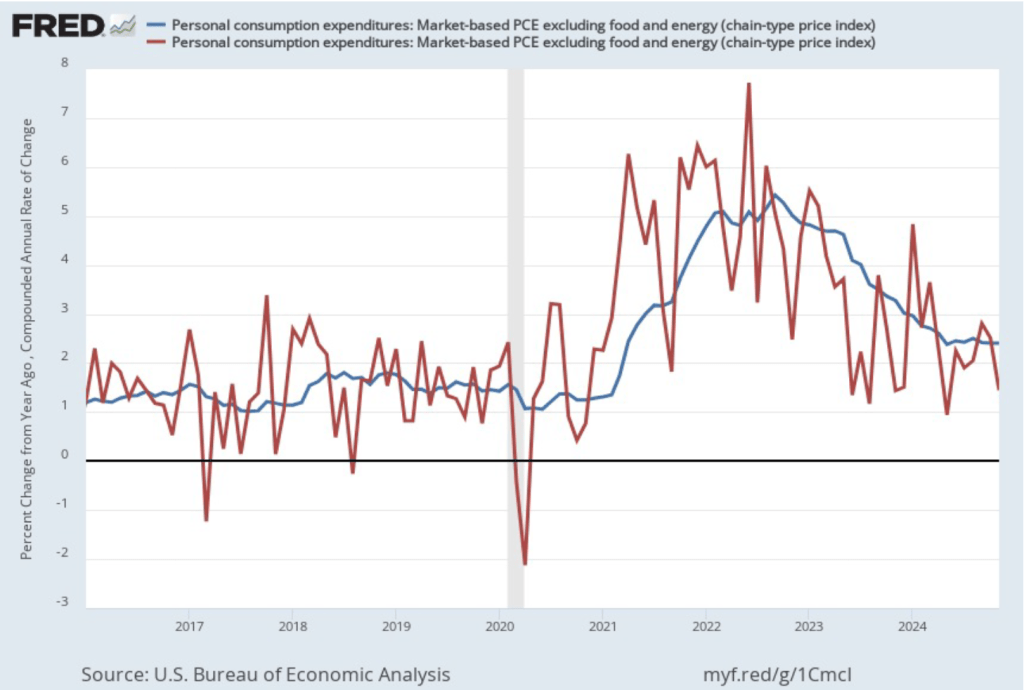
As the following figure shows, inflation in the price of shelter has been a significant contributor to headline inflation. The blue line shows 12-month inflation in shelter, and the red line shows 1-month inflation in shelter. Twelve-month inflation in shelter has been declining since the spring of 2023, but in December it was still high at 4.6 percent. One-month inflation in shelter—which is much more volatile than 12-month inflation in shelter—fell from 4.1 percent in November to 3.1 percent in December.
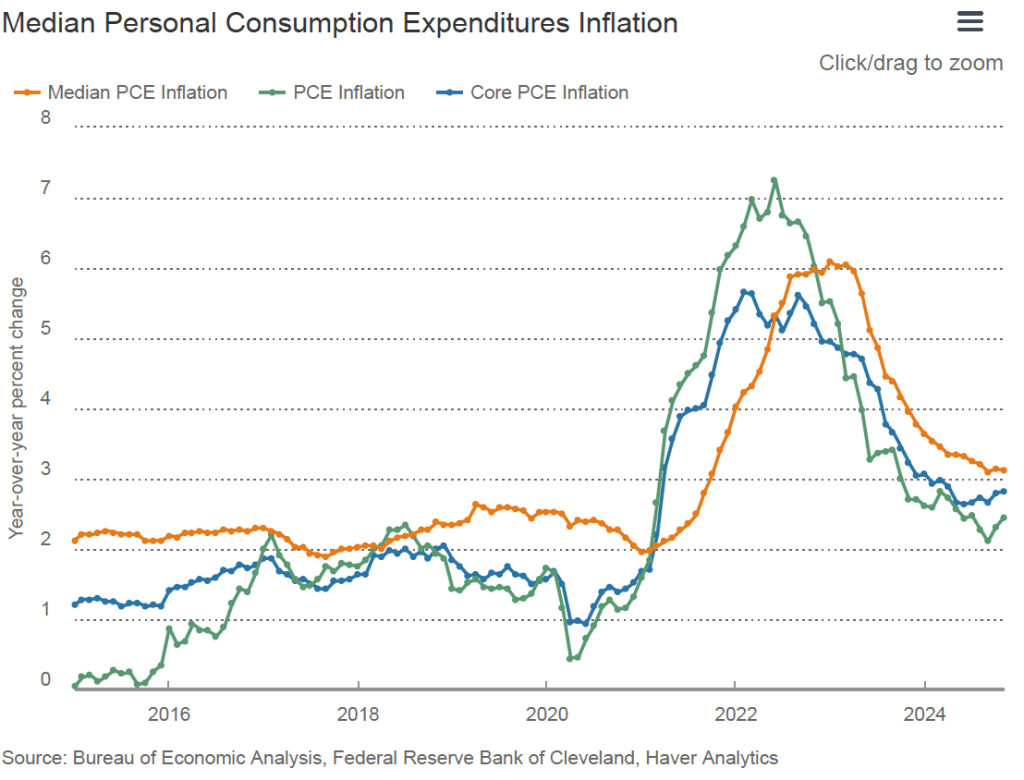
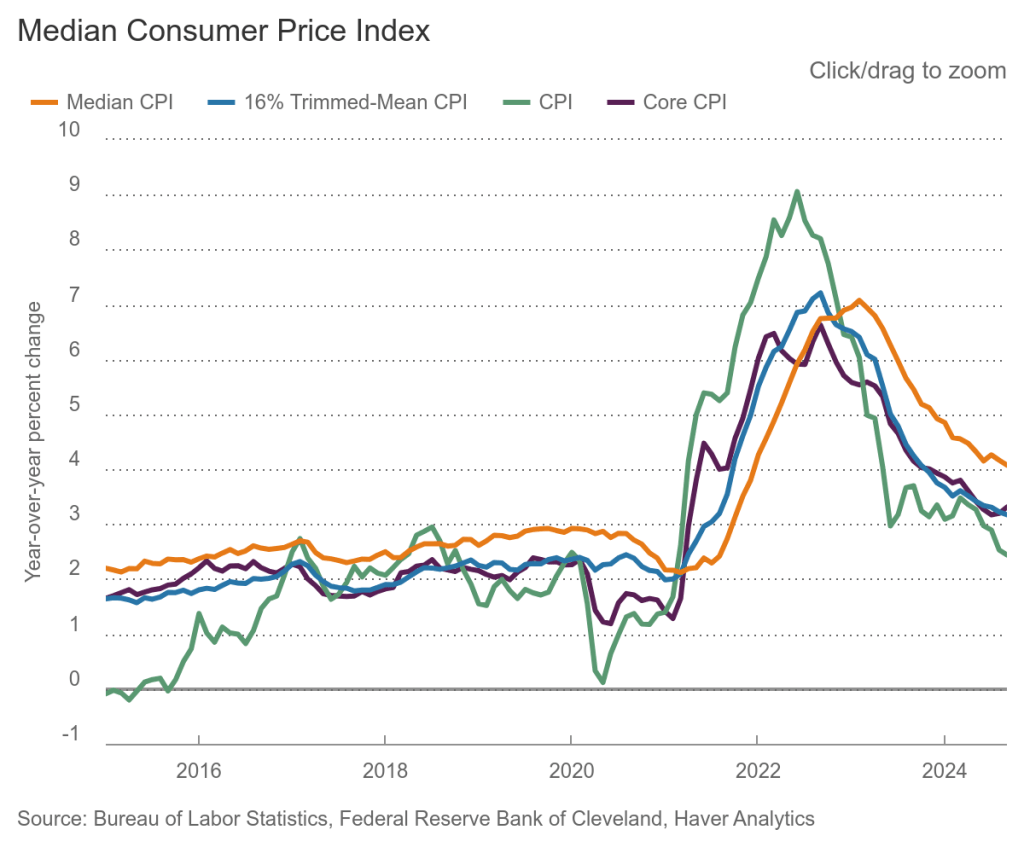
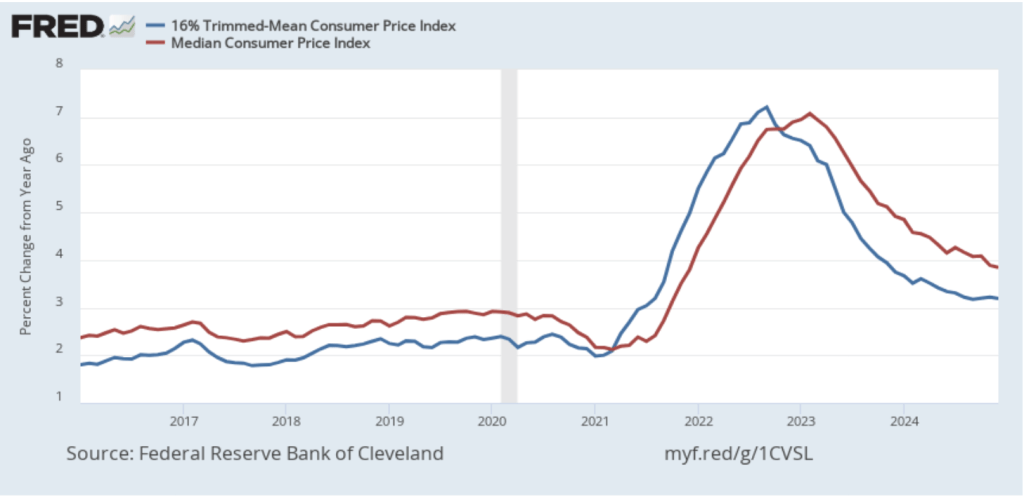
To better estimate of the underlying trend in inflation, some economists look at median inflation and trimmed mean inflation.
- Median inflation is calculated by economists at the Federal Reserve Bank of Cleveland and Ohio State University. If we listed the inflation rate in each individual good or service in the CPI, median inflation is the inflation rate of the good or service that is in the middle of the list—that is, the inflation rate in the price of the good or service that has an equal number of higher and lower inflation rates.
- Trimmed mean inflation drops the 8 percent of goods and services with the highest inflation rates and the 8 percent of goods and services with the lowest inflation rates.
The following figure shows that 12-month median inflation (the red line) declined slightly from 3.9 percent in November to 3.8 percent in December. Twelve-month trimmed mean inflation (the blue line) was unchanged at 3.2 percent for the fifth month in a row.
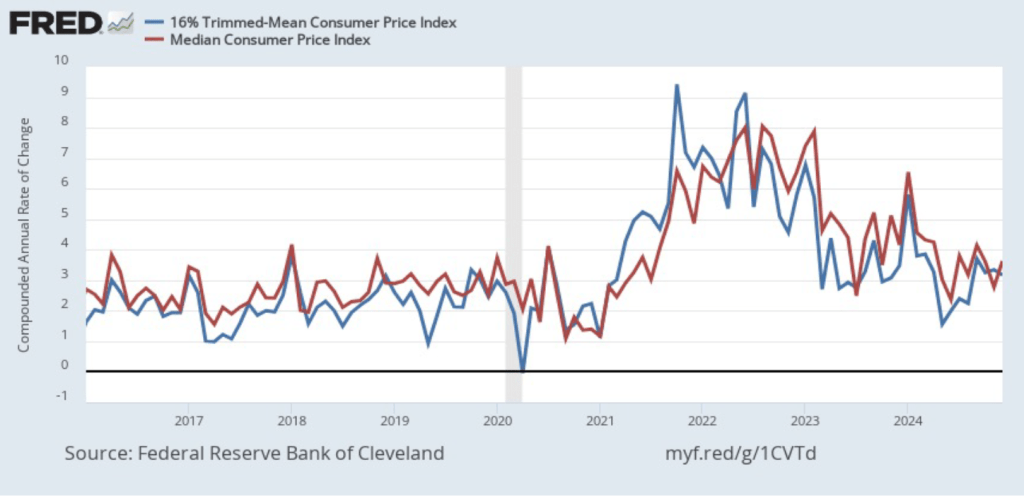
The following figure shows 1-month median and trimmed mean inflation. One-month median inflation rose from 2.8 percent in November to 3.6 percent in December. One-month trimmed mean inflation fell slightly from 3.3 percent in November to 3.2 percent in December. These data provide confirmation that (1) CPI inflation at this point is likely running higher than a rate that would be consistent with the Fed achieving its inflation target, and (2) that progress toward the target has slowed.
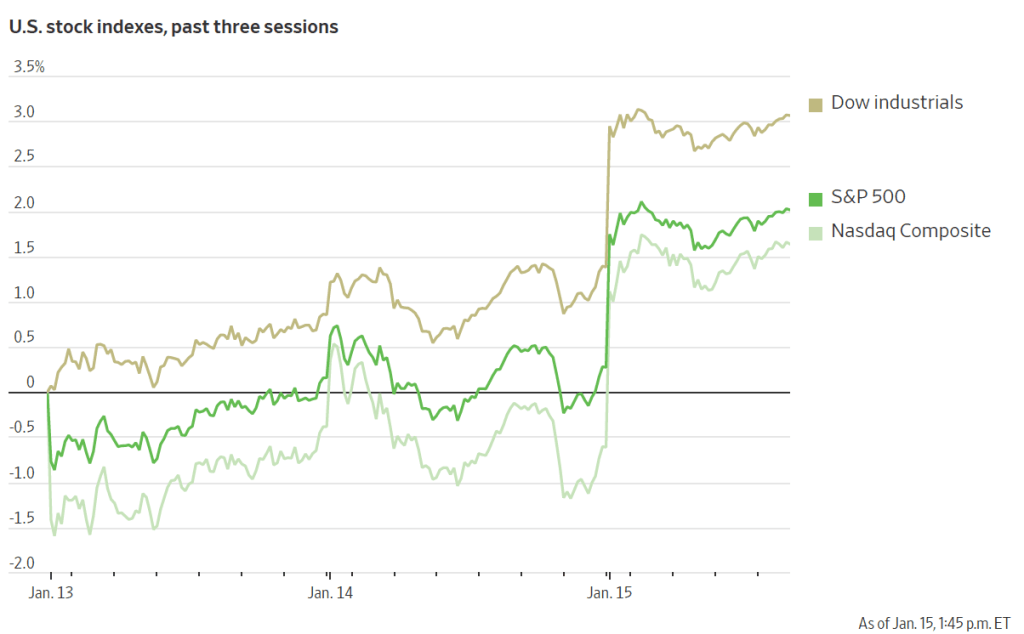
What are the implications of this CPI report for the actions the FOMC may take at its next meeting on January 28-29? The stock market rendered a quick verdict, as the following figure from the Wall Street Journal shows. As soon as the market opened on Wednesday morning, all three of the most widely followed stock market indexes jumped—as indicated by the vertical segments in the figure. Investors seem to be focusing on core CPI inflation being lower than expected, which should increase the probability that the FOMC will cut its target for the federal funds rate at either its March or May meeting. Lower inflation and lower interest rates would be good news for stock prices.
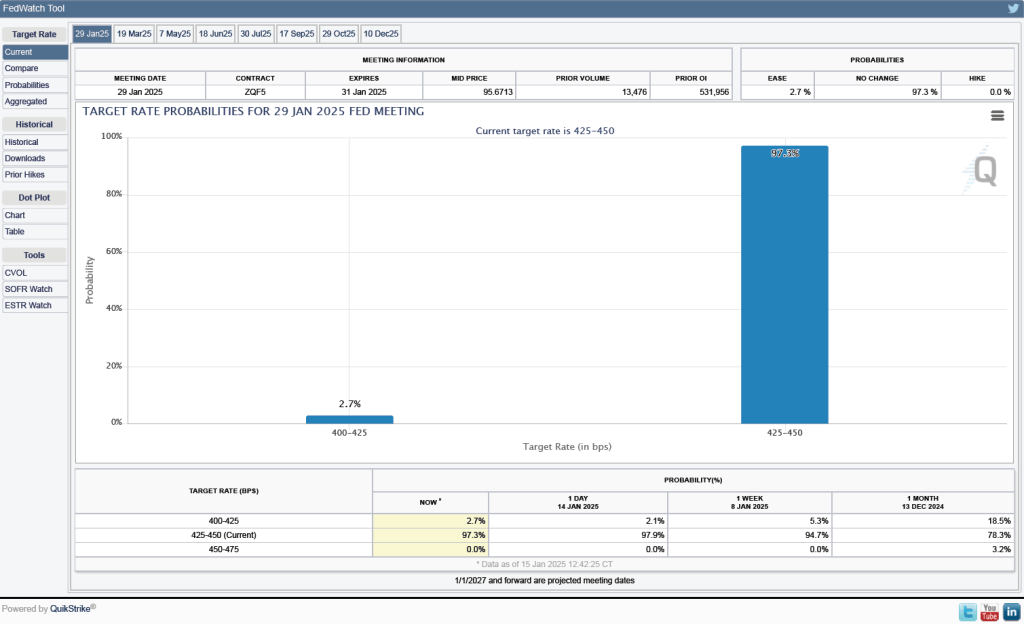
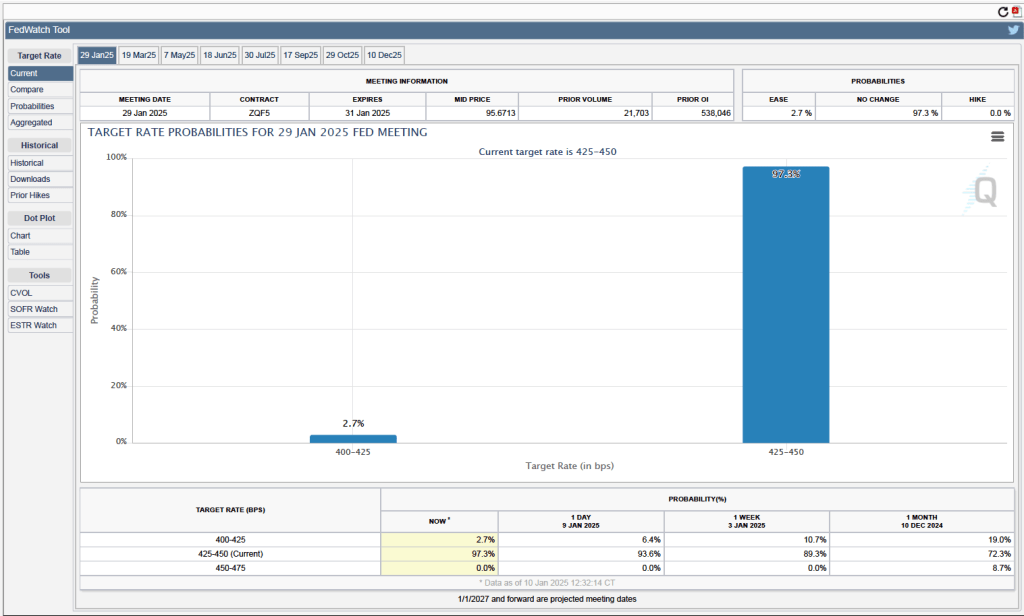
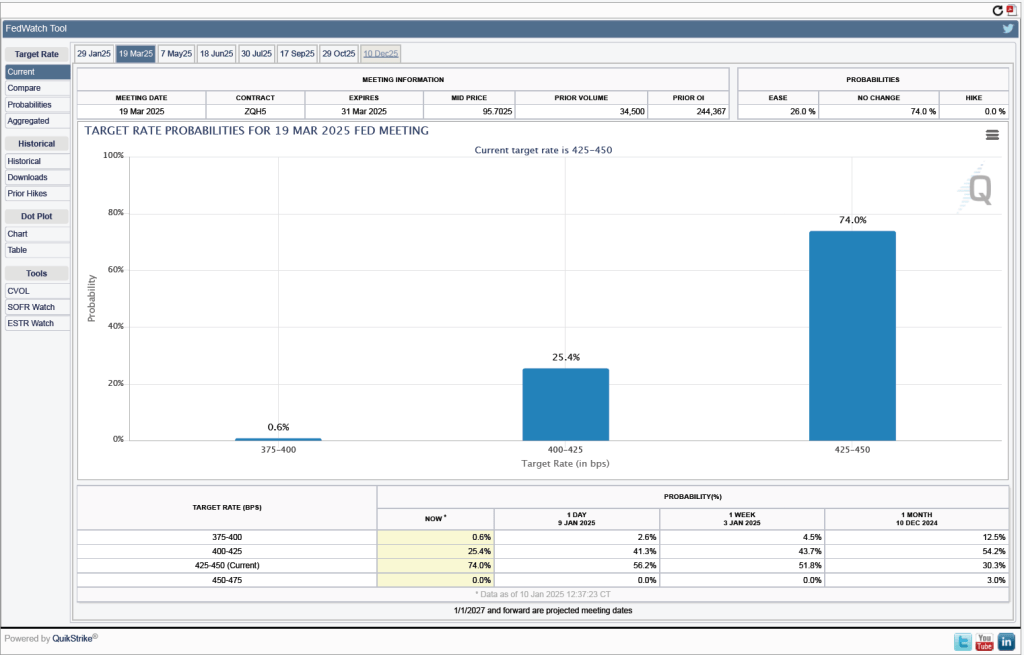
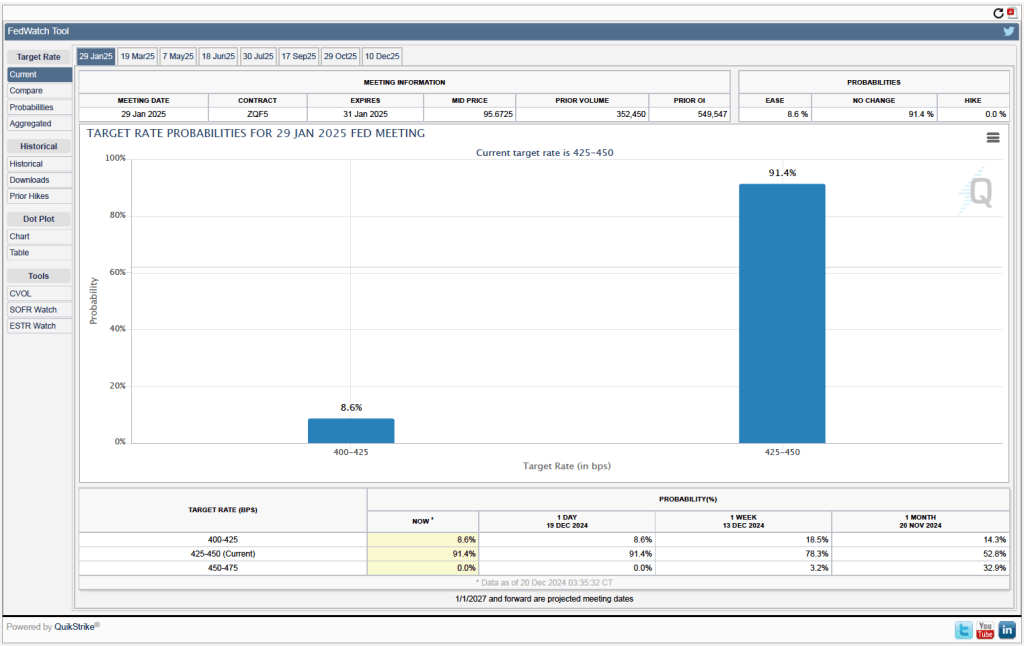
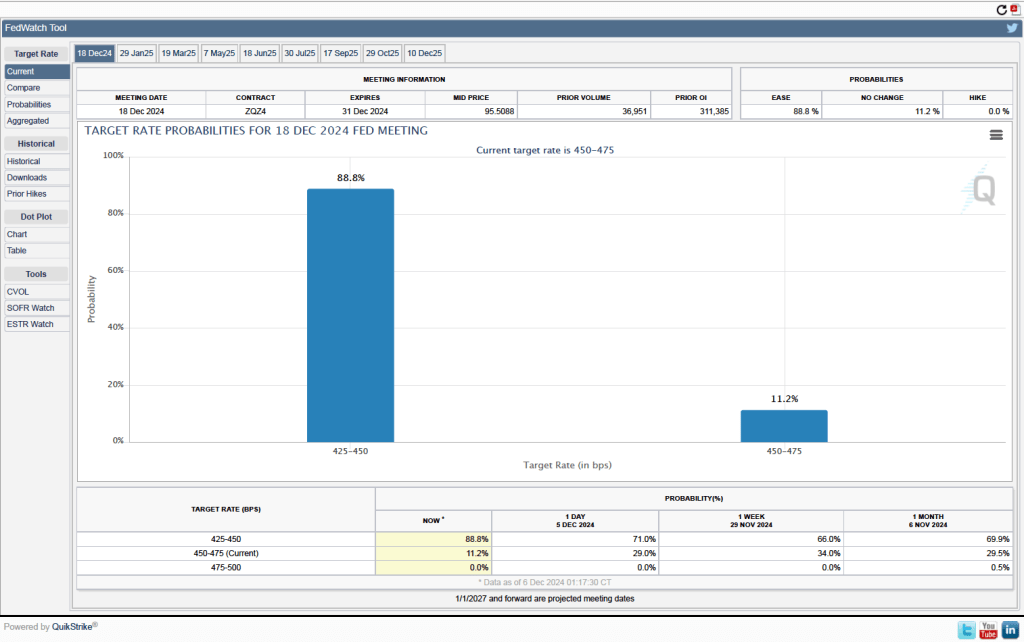
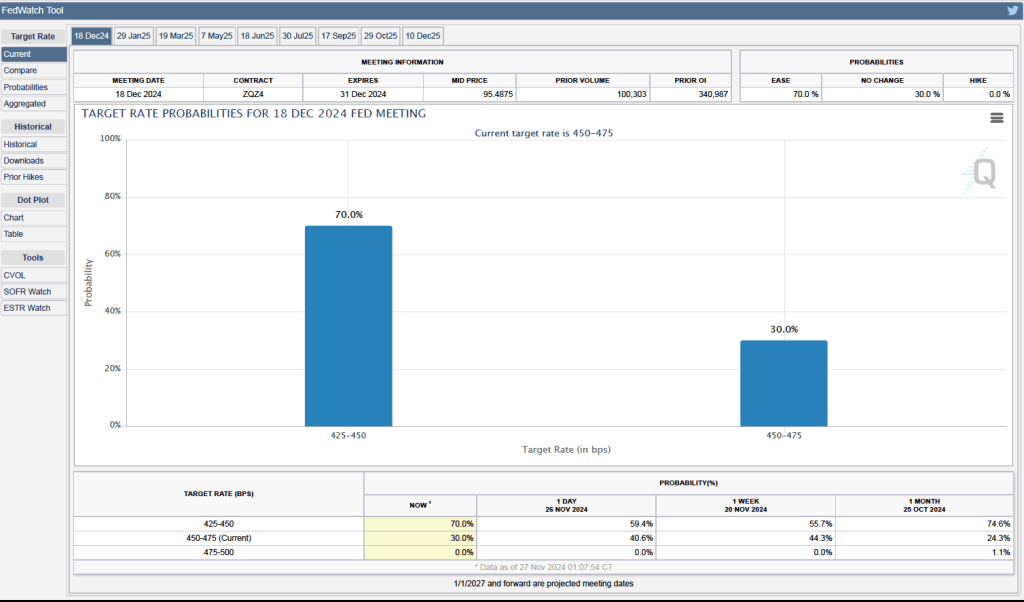
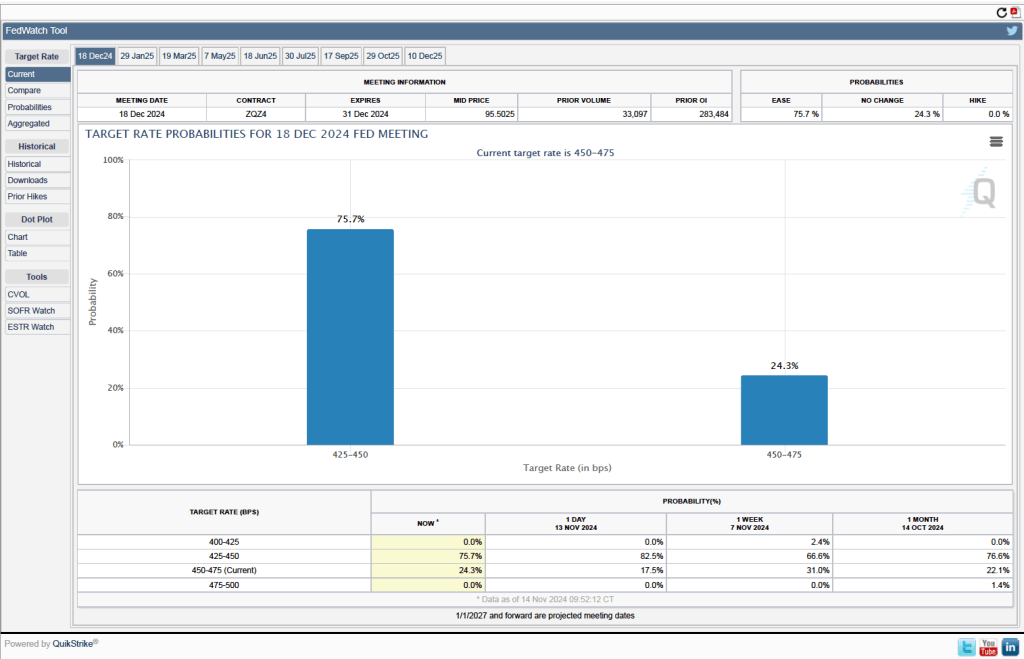
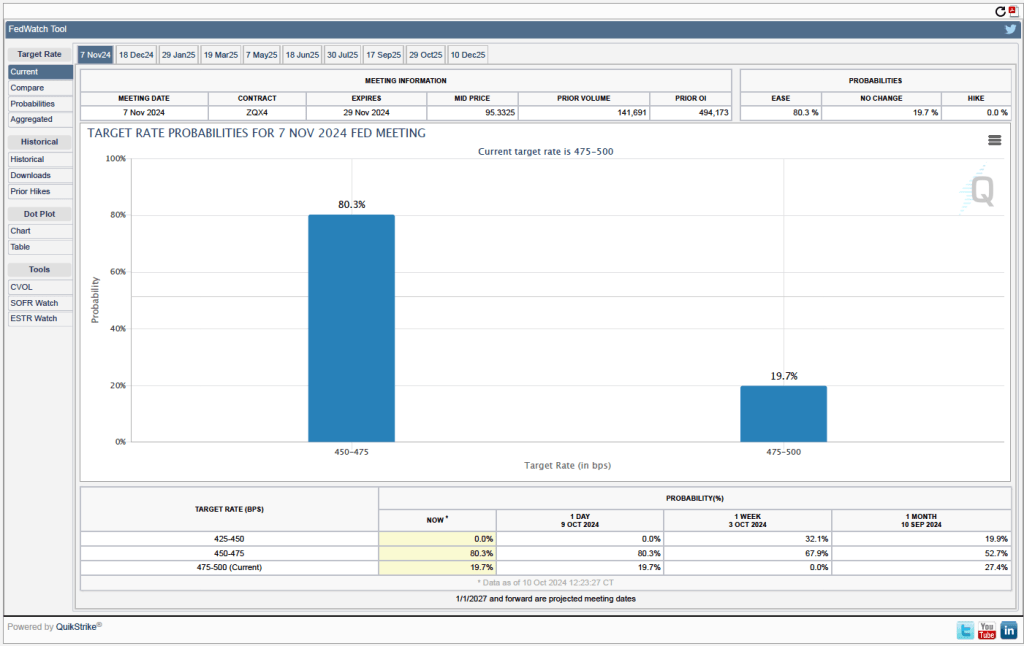
Investors who buy and sell federal funds futures contracts still do not expect that the FOMC will cut its target for the federal funds rate at its next meeting, as indicated by the following figure. (We discuss the futures market for federal funds in this blog post.) Today, investors assign a probability of 93.7 percent to the FOMC leaving its target range for the federal funds rate unchanged at 4.25 percent to 4.50 percent at its January 28-29 meeting, and a probability of only 2.7 percent to the committee cutting its target range by 0.25 percentage point (25 basis points).