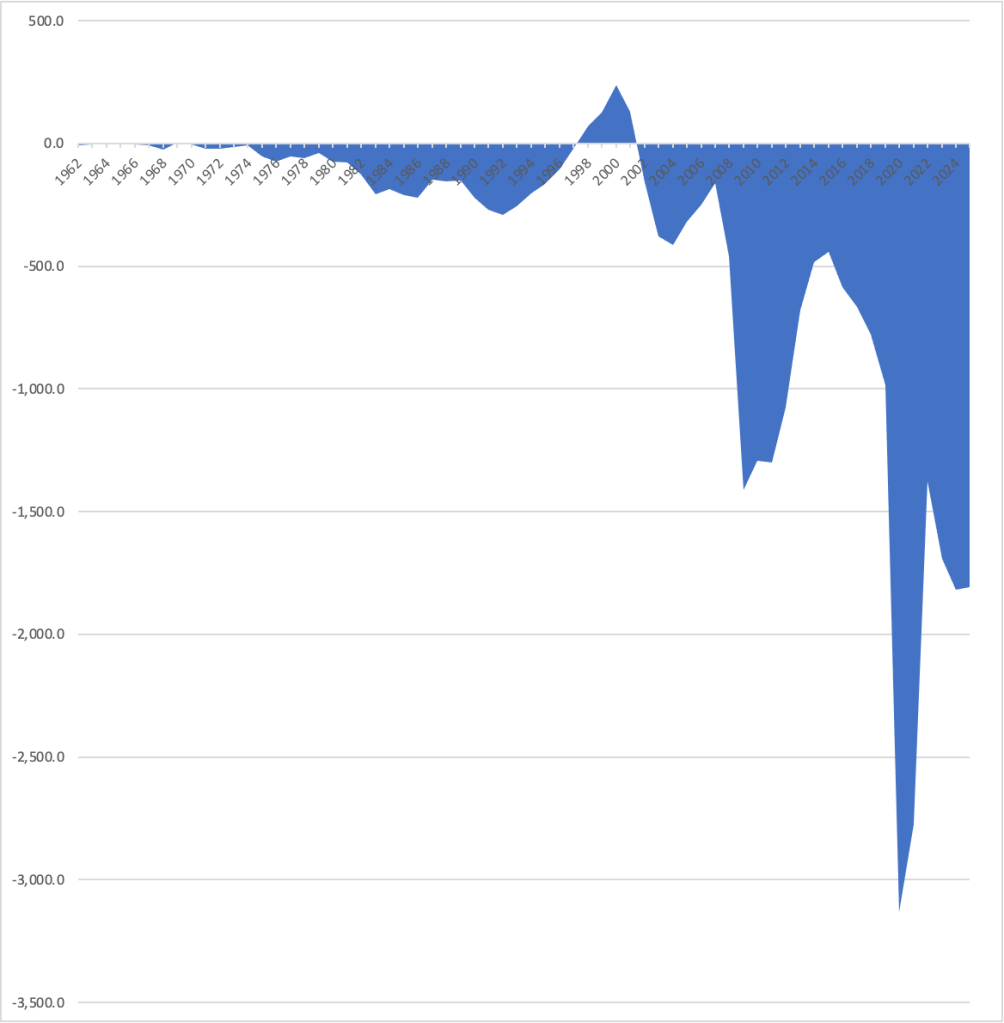
The federal government’s fiscal year runs from October 1 to September 30. Today (October 8), the Congressional Budget Office (CBO) released its estimate of the deficit for the fiscal year ending September 30, 2025. The deficit fell slightly from $1,817 billion in 2024 to $1,809 in 2025. As the following figure shows, the budget deficit in 2025 remains very large, particularly at a time when the U.S. economy is at or very close to full employment, although well below the record deficit of $3,133 billion in 2020.
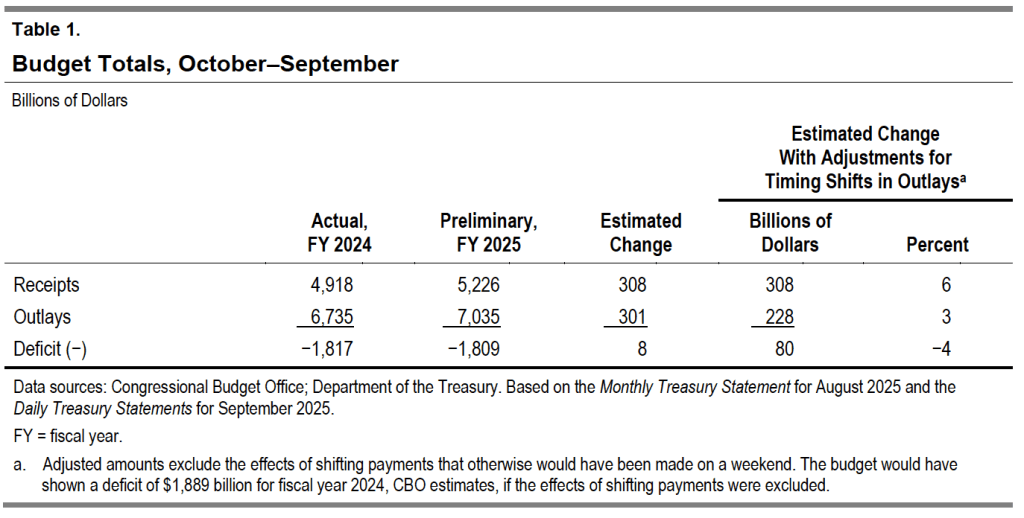
The following table from the CBO report shows that in 2025 federal receipts increased slightly more than federal outlays, leading to a slightly smaller deficit.
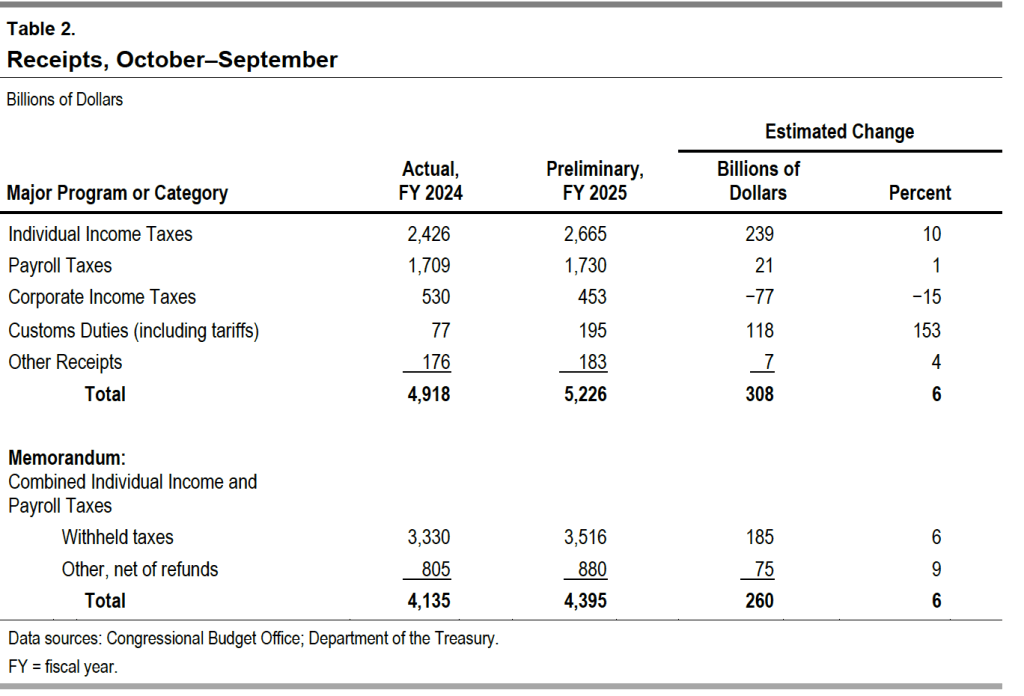
The next table shows the changes in the major categories of federal receipts. Individual income and payroll taxes—which fund the Social Security and Medicare programs, as well as the federal government’s contributions to state unemployment insurance plans—both increased, while corporate income tax receipts fell. The biggest change was in custom duties, which more than doubled following the Trump administration’s sharp increase in tariff rates beginning on April 2.
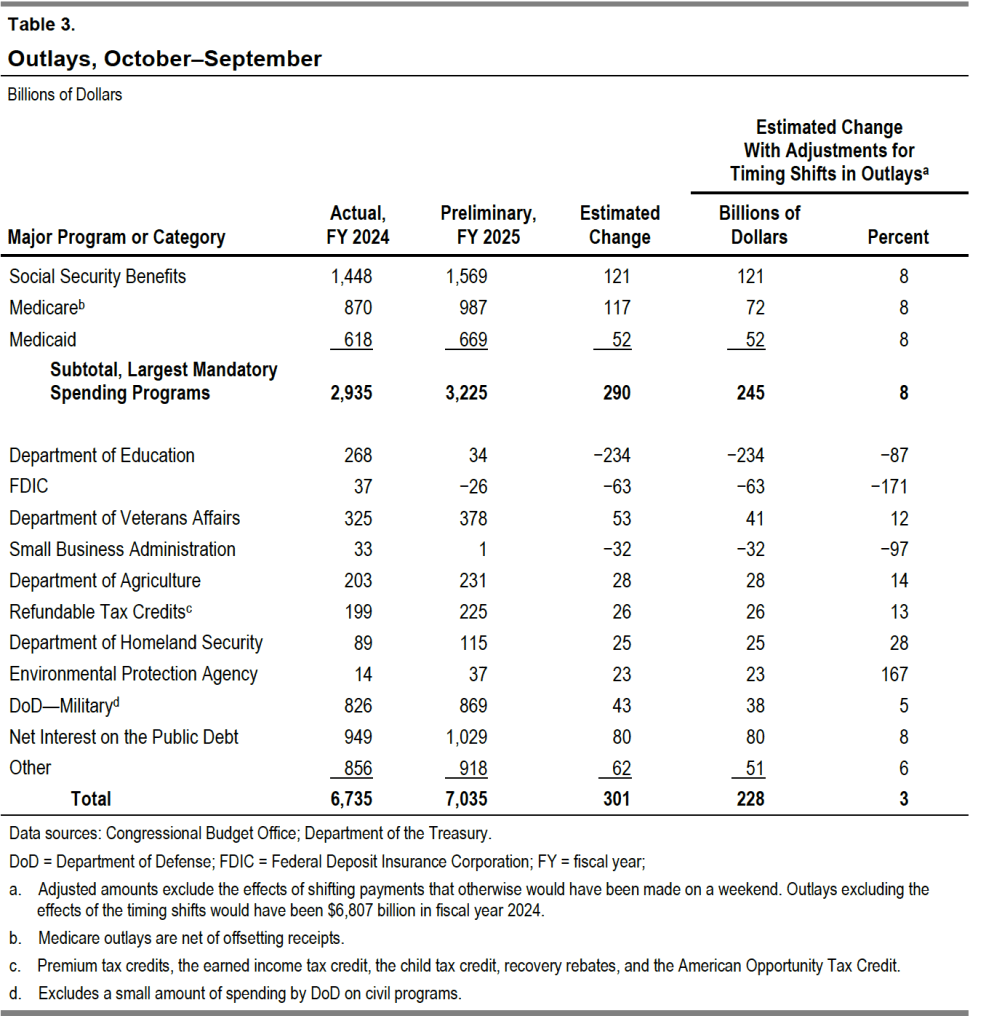
The next table shows the changes in the major categories of federal outlays. Spending on the Social Security, Medicare (health insurance for older people), and Medicaid (health insurance for lower-income people) programs continue to rapidly increase. Spending on Medicare is now more than $100 billion greater than spending on defense. Interest on the public debt continues to increase as the debt increases and interest rates remain well above their pre-2021 levels.
Glenn, along with co-authors Douglas Elmendorf of Harvard’s Kennedy School and Zachary Liscow of the Yale Law School, has written a new National Bureau of Economic Research working paper: “Policies to Reduce Federal Budget Deficits by Increasing Economic Growth”
Here’s the abstract:
Could policy changes boost economic growth enough and at a low enough cost to meaningfully reduce federal budget deficits? We assess seven areas of economic policy: immigration of high-skilled workers, housing regulation, safety net programs, regulation of electricity transmission, government support for research and development, tax policy related to business investment, and permitting of infrastructure construction. We find that growth-enhancing policies almost certainly cannot stabilize federal debt on their own, but that such policies can reduce the explicit tax hikes, spending cuts, or both that are needed to stabilize debt. We also find a dearth of research on the likely impacts of potential growth-enhancing policies and on ways to design such policies to restrain federal debt, and we offer suggestions for ways to build a larger base of evidence.
Logo of the Congressional Budget Office from cbo.gov.
The federal government’s fiscal year runs from October 1 to September 30 of the following calendar year. The Congressional Budget Office (CBO) estimates that the federal government’s budget deficit for fiscal 2024, which just ended, was $1.8 trillion. (The Office of Management and Budget (OMB) will release the official data on the budget later this month.)
The federal budget deficit increased by about $100 billion from fiscal 2023, although the comparison of the deficits in the two years is complicated by the question of how to account for the $333 billion in student debt cancellation that President Biden ordered (which would reduce federal revenues by that amount) but which wasn’t implemented because of a decision by the U.S. Supreme Court.
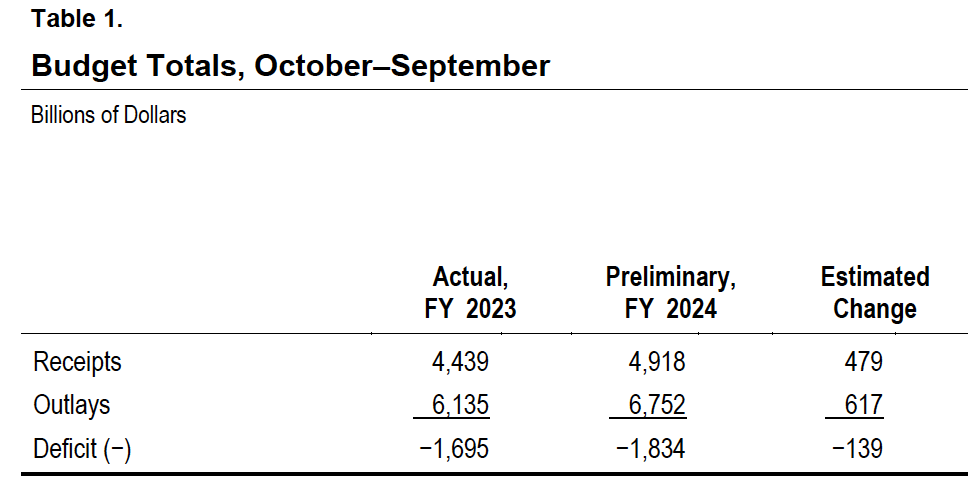
The following table from the CBO report compares federal receipts and outlays for fiscal years 2023 and 2024. Recipts increased by $479 billion from 2023 to 2024, but outlays increased by $617 billion, resulting in an increase of $139 billion in the federal budget deficit.
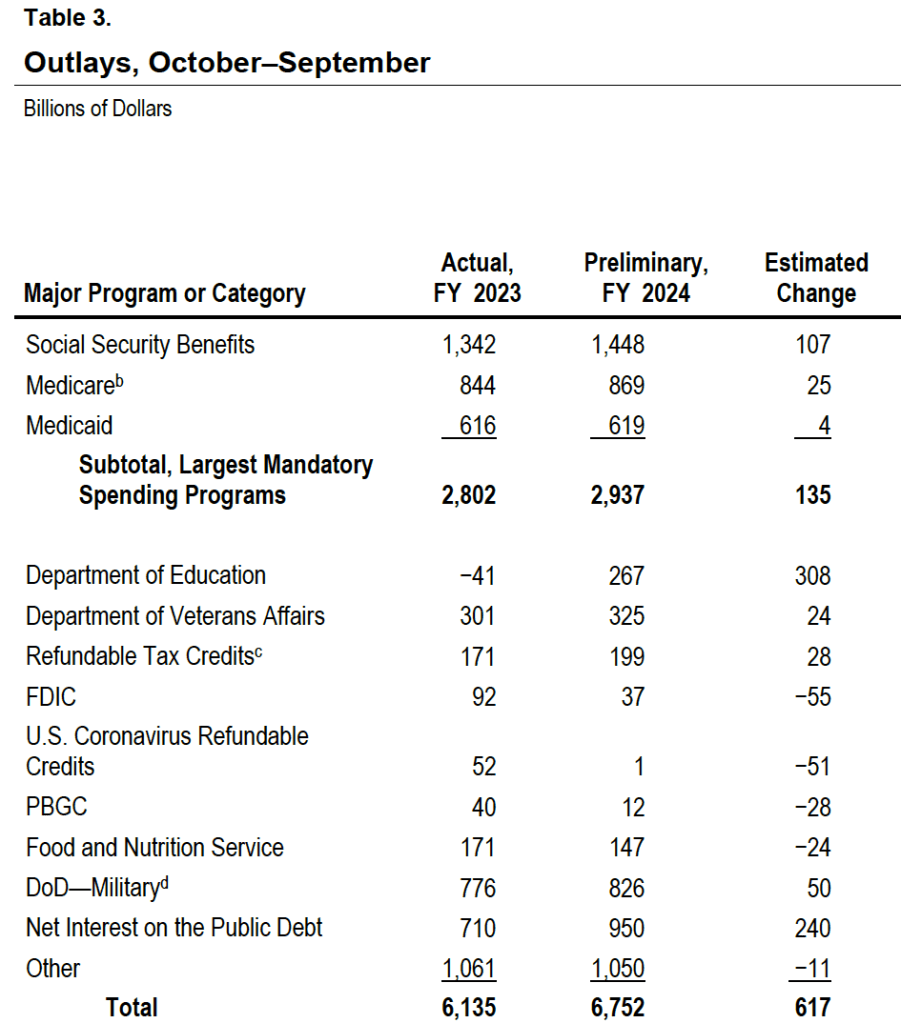
The following table shows the increases in the major spending categories in the federal budget. Spending on the Social Security, Medicare, and Medicaid programs increased by a total of $135 billion. The large increase in spending on the Department of Education is distorted by accounting for the reversal of the student debt cancellation following a Suprement Court ruling, as previously mentioned. The FDIC is the Federal Deposit Insurance Corporation, which had larger than normal expenditures in 2023 due the failure of several regional banks. (We discuss this episode in several earlier blog posts, including this one.) Interest on the public debt increased by $240 billion because of increases in the debt as a result of persistently high federal deficits and because of increases in the interest rates the Treasury has paid on new issues of bill, notes, and bonds necessary to fund those deficits. (We discuss the federal budget deficit and federal debt in Macroeconomics, Chapter 16, Section 16.6 (Economics, Chapter 26, Section 26.6).)
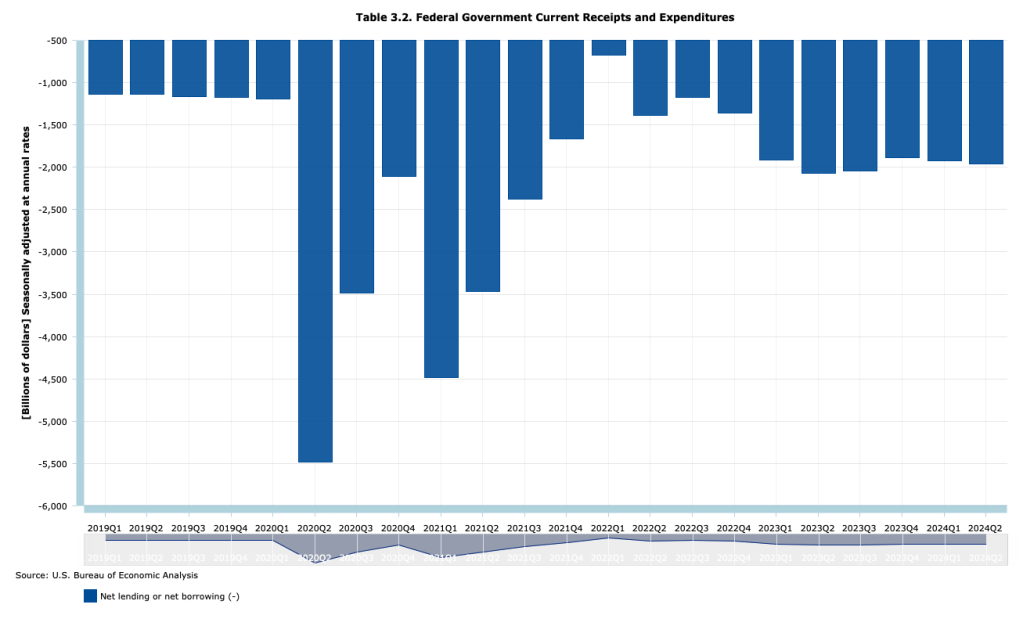
A troubling aspect of the large federal budget deficits is that they are occurring during a time of economic expansion when the economy is at full employment. The following figure, using data from the Bureau of Economic Analysis (BEA), shows that at an annual rate, the federal budget deficit has beening running between $1.9 trillion and $2.1 trillion each quarter since the first quarter of 2023, well after most of the federal spending increases to meet the Covid pandemic ended.
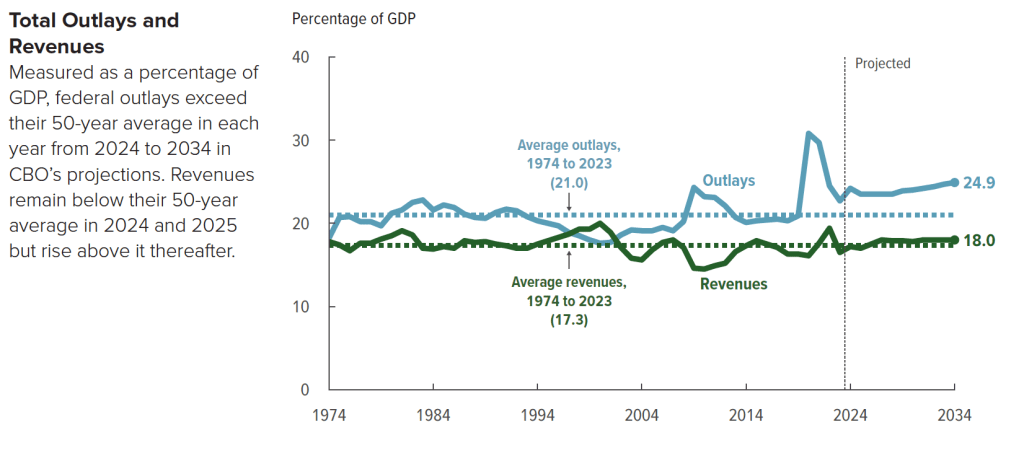
The following figure from the CBO shows trends in federal revenue and spending. From 1974 to 2023, federal spending averaged 21.o percent of GDP, but is forecast to rise to 24.9 percent of GDP by 2023. Federal revenue averaged 17.3 percent of GDP from 1974 to 2023 and is forecast to rise to 18.0 percent of GDP in 2034. As a result, the federal budget deficit, which had averaged 3.7 percent of GDP between 1974 and 2023 (already high in a longer historical context) will nearly double to 6.9 percent of GDP in 2034.
Slowing the growth of federal spending may prove difficult politically because the majority of spending increases are from manadatory spending on Social Security and Medicare, and from interest on the debt. Discretionary outlays are scheduled to decline in future years according to current law, but may well also increase if Congress and future presidents increase defense spending to meet the foreign challenges the country faces.
One possible course of future policy that would result in smaller future federal deficits is outlined in this post and the material at the included links.
During 2023, GDP and employment have continued to expand. Between the second quarter of 2022 and the second quarter of 2023, nominal GDP increased by 6.1 percent. From July 2022 to July 2023, total employment increased by 3.3 million as measured by the establishment (or payroll) survey and by 3.0 as measured by the household survey. (In this post, we discuss the differences between the employment measures in the two surveys.)
We would expect that with an expanding economy, federal tax revenues would rise and federal expenditures on unemployment insurance and other transfer programs would decline, reducing the federal budget deficit. (We discuss the effects of the business cycle on the federal budget deficit in Macroeconomics, Chapter 16, Section 16.6, Economics, Chapter 26, Section 26.6, and Essentials of Economics, Chapter 18, Section 18.6.) In fact, though, as the figure from the Congressional Budget Office (CBO) at the top of this post shows, the federal budget deficit actually increased substantially during 2023 in comparison with 2022. The federal budget deficit from the beginning of government’s fiscal year on October 1, 2022 through July 2023 was $1,617 billion, more than double the $726 billion deficit during the same period in fiscal 2022.
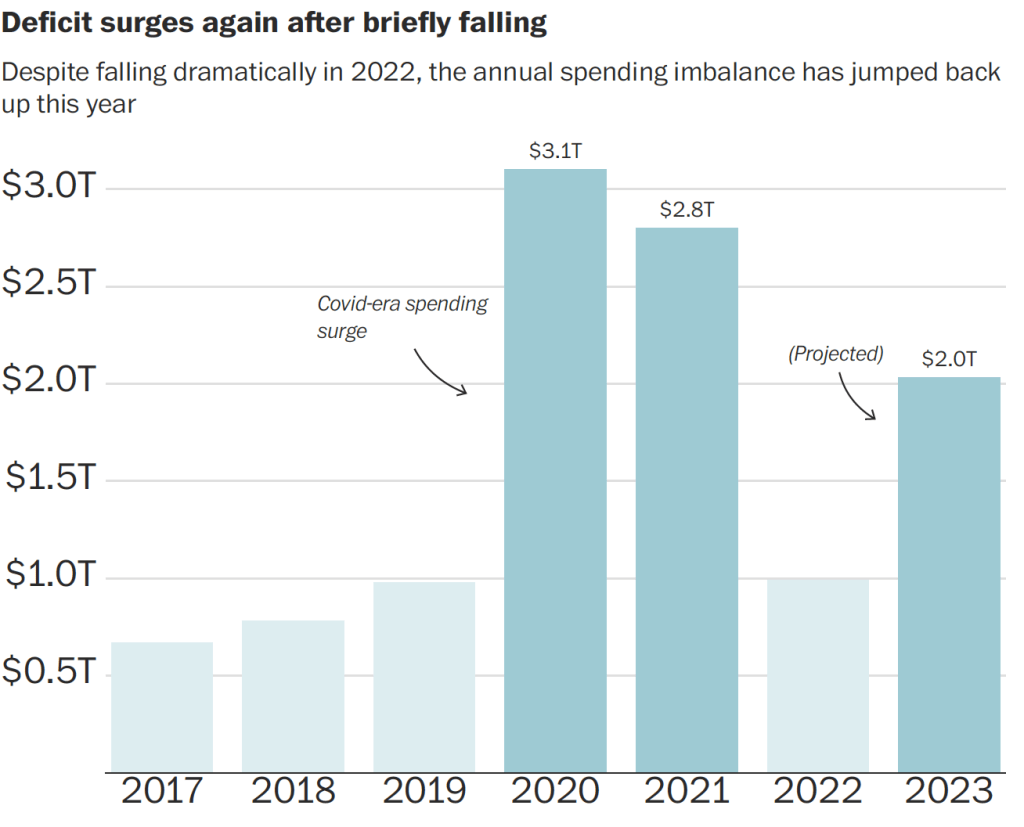
The following figure from an article in the Washington Post uses data from the Committee for a Responsible Federal Budget to illustrate changes in the federal budget deficit in recent years. The figure shows the sharp decline in the federal budget deficit in 2022 as the economic recovery from the Covid–19 pandemic increased federal tax receipts and reduced federal expenditures as emergency spending programs ended. Given the continuing economic recovery, the surge in the deficit during 2023 was unexpected.
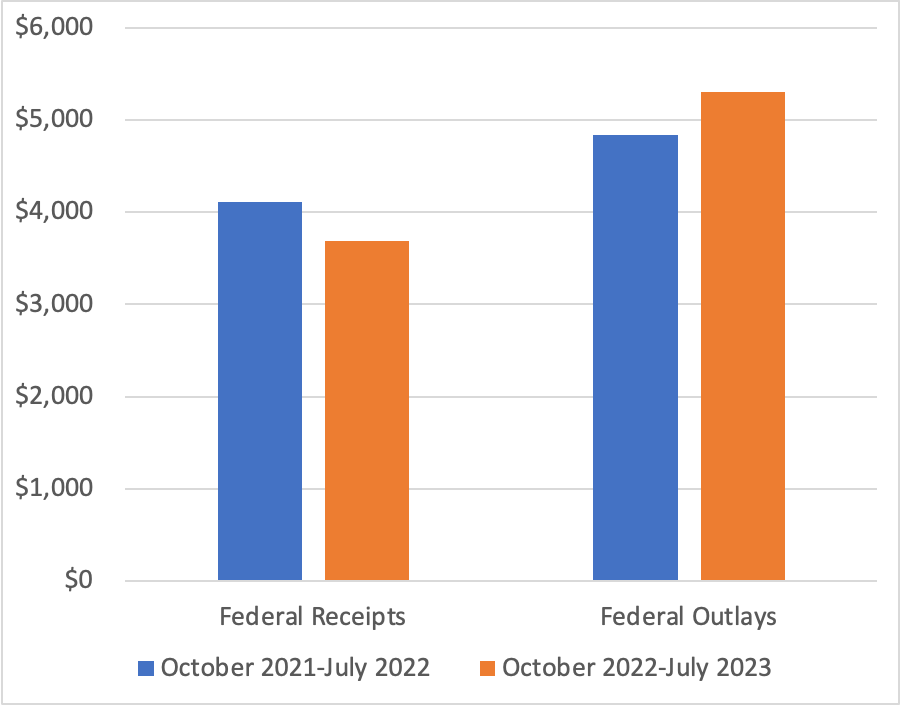
As the following figure shows, using CBO data, federal receipts—mainly taxes—are 10 percent lower this year than last year, and federal outlays—including transfer payments—are 11 percent higher. For receipts to fall and outlays to increase during an economic expansion is very unusual. As an article in the Wall Street Journal put it: “Something strange is happening with the federal budget this year.”
Note: The values on the vertical axis are in billions of dollars.
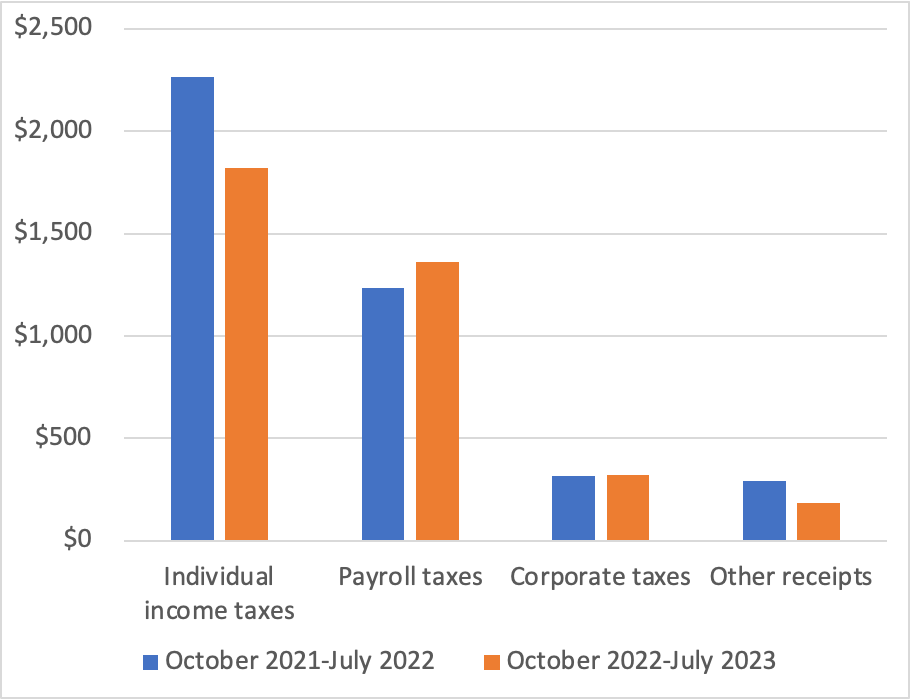
The following figure shows a breakdown of the decline in federal receipts. While corporate taxes and payroll taxes (primarily used to fund the Social Security and Medicare systems) increased, personal income tax receipts fell by 20 percent, and “other receipts” fell by 37 percent. The decline in other receipts is largely the result of a decline in payments from the Federal Reserve to the U.S. Treasury from $99 billion in 2022 to $1 billion in 2023. As we discuss in Macroeconomics, Chapter 17, Section 17.4 (Economics, Chapter 27, Section 27.4), Congress intended the Federal Reserve to be independent of the rest of the government. Unlike other federal agencies and departments, the Fed is self-financing rather than being financed by Congressional appropriations. Typically, the Fed makes a profit because the interest it earns on its holdings of Treasury securities is more than the interest it pays banks on their reserve deposits. After paying its operating costs, the Fed pays the rest of its profit to the Treasury. But as the Fed increased its target for the federal funds rate beginning in March 2022, it also increased the interest rate it pays banks on their reserve deposits. Because most of the securities it holds pay low interest rates, the Fed has begun running a deficit, reducing the payments it makes to the Treasury.
Note: The values on the vertical axis are in billions of dollars.
The reasons for the sharp decline in individual income taxes are less clear. The decline was in the “nonwithheld category” of individual income taxes; federal income taxes withheld from worker paychecks increased. People who are self-employed or who receive substantial income from sources such as capital gains from selling stocks, make quarterly estimated income tax payments. It’s these types of personal income taxes that have been unexpectedly low. Accordingly, smaller capital gains may be one explanation for the shortfall in federal revenues, but a more complete explanation won’t be possible until more data become available later in the year.
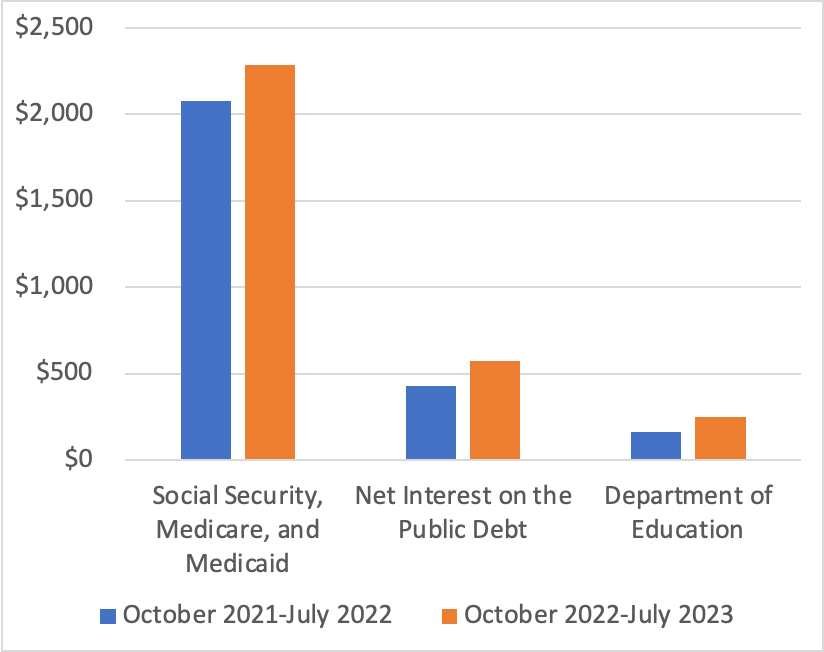
The following figure shows the categories of federal outlays that have increased the most from 2022 to 2023. The largest increase is in spending on Social Security, Medicare, and Medicaid, with spending on Social Security alone increasing by $111 billion. This increase is due partly to an increase in the number of retired workers receiving benefits and partly to the sharp rise in inflation, because Social Security is indexed to changes in the consumer price index (CPI). Spending on Medicare increased by $66 billion or a surprisingly large 18 percent. Interest payments on the public debt (also called the federal government debt or the national debt) increased by $146 billion or 34 percent because interest rates on newly issued Treasury securities rose as nominal interest rates adjusted to the increase in inflation and because the public debt had increased significantly as a result of the large budget deficits of 2020 and 2021. The increase in spending by the Department of Education reflects the effects of the changes the Biden administration made to student loans eligible for the income-driven repayment plan. (We discuss the income-driven repayment plan for student loans in this blog post.)
Note: The values on the vertical axis are in billions of dollars.
The surge in federal government outlays occurred despite a $120 billion decline in refundable tax credits, largely due to the expiration of the expansion of the child tax credit Congress enacted during the pandemic, a $98 billion decline in Treasury payments to state and local governments to help offset the financial effects of the pandemic, and $59 billion decline in federal payments to hospitals and other medical facilities to offset increased costs due to the pandemic.
In this blog post from February, we discussed the challenges posed to Congress and the president by the CBO’s forecasts of rising federal budget deficits and corresponding increases in the federal government’s debt. The unexpected expansion in the size of the federal budget deficit for the current fiscal year significantly adds to the task of putting the federal government’s finances on a sound basis.
Main Gun Mount Assembly Plant, Northern Pump Co. Plant, Fridley, Minnesota, 1942. (Photo from the Franklin D. Roosevelt Presidential Library & Museum.)
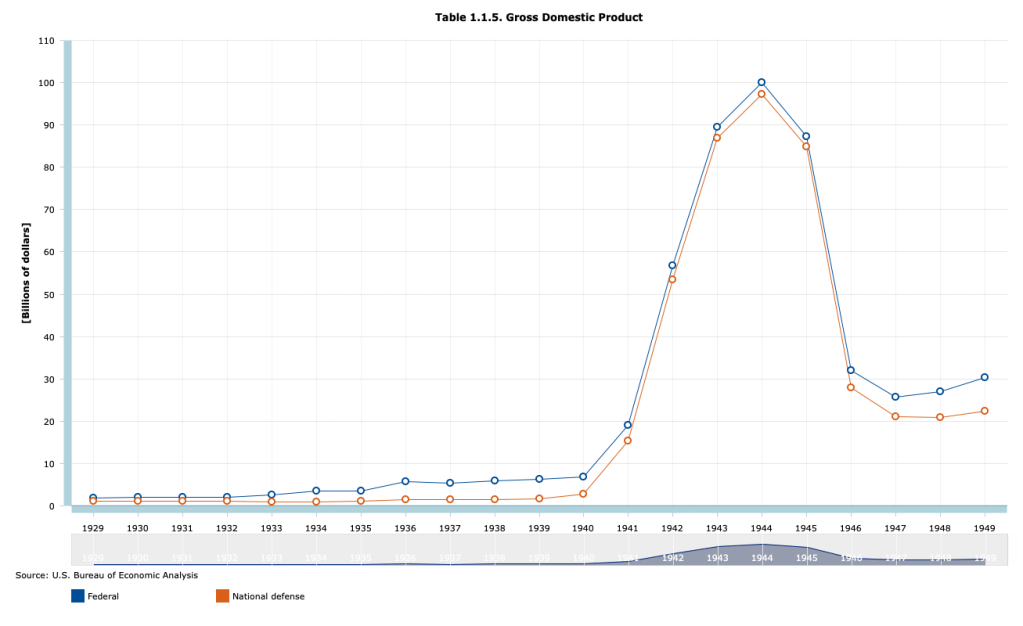
To fight World War II, the federal government had to dramatically increase spending. As the following figure shows, total federal spending rose from $6.8 billion in 1940 to a peak of $100.1 billion in 1944. National defense spending made up most of the increase, rising from $2.8 billion in 1940 to $97.3 billion in 1944.
Part of the increased spending was paid for by increases in taxes. Total federal tax receipts rose from $6.2 billion in 1940 to $35.8 billion in 1945. Individual income taxes rose from $1.0 billion in 1940 to 18.6 billion in 1945. Tax rates were raised and the minimum income at which people had to pay tax on their income was reduced. From the introduction of the federal individual income tax in 1913 until 1940, only people who had at least upper middle class incomes paid any federal income taxes. Following the passage by Congress of the Revenue Act of 1942, most workers had to pay federal income taxes. In 1940, 7.4 million people had to pay federal individual income taxes. In 1945, 42.7 million people had to. For the first time, the federal government withheld taxes from workers paychecks. Previously, all taxes were due on March 15th of the year following the year being taxed. Milton Friedman, who in the 1970s won the Nobel Prize in Economics, was part of the team at the U.S. Treasury that designed and implemented the system of withholding income taxes. Withholding of individual income taxes has continued to the present day.
Although large, the increases in federal taxes were insufficient to fund the massive military spending required to win the war. As a result, the U.S. Treasury had to greatly increase its sales of Treasury bonds. Recall from Macroeconomics, Chapter 16, Section 16.6 (Economics, Chapter 26, Section 26.6 and Essentials of Economics, Chapter 18, Section 18.6) that the total value of outstanding Treasury bonds is called the federal government debt, sometimes called the national debt. The part of federal government debt held by the public rather than by government agencies, such as the Social Security Trust Funds, is call the public debt. In order to gauge the effects of the debt on the economy, economists typically look at the size of the public debt relative to GDP. The following figure shows the public debt as a percentage of GDP for the years from 1929 to 2022.
The figure shows that the ratio of debt to GDP increased sharply from 1929 to the mid-1930s, reflecting the federal budget deficits resulting from the Great Depression, and then soared beginning in 1940. Debt peaked at 113 percent of GDP in 1945 and then began a long decline that lasted until 1974, when debt had fallen to 23 percent of GDP. The ratio of debt to GDP then fluctuated until the Great Recession of 2007-2009 when it began a steady increase that turned into a surge during and after the Covid-19 pandemic. (We discuss the causes of the recent surge in debt in this blog post.)
What caused the long decline in the ratio of debt to GDP that began in 1946 and continued until 1974? The usual explanation is that the decline was not primarily due to the federal government paying off a signficiant portion of the debt. The public debt did decline from a peak of $241.9 billion in 1946 to $214.3 billion in 1949 but there were no significant declines in the level of the public debt after 1949. Instead the ratio of debt to GDP declined because GDP grew faster than did the debt.
Recently in a National Bureau of Economic Research Working Paper, “Did the U.S. Really Grow Out of Its World War II Debt?” Julien Acalin and Laurence M. Ball of Johns Hopkins University have analyzed the issue more closely. They conclude that economic growth played a smaller role in reducing the debt-to-GDP ratio than has previously been thought. In particular, they highlight the fact that for significant periods through the 1970s, the Treasury was able to pay a real interest rate on the debt that was lower than market rates. Lower real interest rates reduced the amount by which the debt might otherwise have grown.
As we discuss in Money, Banking, and the Financial System, Chapter 13, Section 13.2, in April 1942, to support the war effort, the Federal Reserve announced that it would fix interest rates on Treasury securities at low levels: 0.375 percent on Treasury bills and 2.5 percent on Tresaury bonds. This policy continued after the end of the war in 1945 until the Fed was allowed to abandon the policy of pegging the interest rates on Treasury securities following the March 1951 Treasury-Federal Reserve Accord. Acalin and Ball also note that even after the Accord, there were periods in which actual inflation was well above expected inflation, causing the real interest rate the Treasury was paying on debt to be below the expected real interest rate. In other words, part of the falling debt-to-GDP ratio was financed by investors receiving lower returns on their purchases of Treasury securities than they had expected to.
Acalin and Ball conclude that if the Treasury had not done the relatively small amount of debt repayment mentioned earlier and if it had had to pay market real interest rates on the debt, debt would have declined to only 74 percent of GDP in 1974, rather than to 23 percent.
Sources: The debt and GDP data are from the Congressional Budget Office, which can be found here, and from the Office of Management and the Budget, which can be found here.
In 1974, Congress created the Congressional Budget Office (CBO). The CBO was given the responsibility of providing Congress with impartial economic analysis as it makes decisions about the federal government’s budget. One of the most widely discussed reports the CBO issues is the Budget and Economic Outlook. The report provides forecasts of future federal budget deficits and changes in the federal government’s debt that the budget deficits will cause. The CBO’s budget and debt forecasts rely on the agency’s forecasts of future economic conditions and assumes that Congress will make no changes to current laws regarding taxing and spending. (We discuss this assumption further below.)
On February 15, the CBO issued its latest forecasts. The forecasts showed a deterioration in the federal government’s financial situation compared with the forecasts the CBO had issued in May 2022. (You can find the full report here.) Last year, the CBO forecast that the federal government’s cumulative budget deficit from 2023 through 2032 would be $15.7 trillion. The CBO is now forecasting the cumulative deficit over the same period will be $18.8 trillion. The three main reason for the increase in the forecast deficits are:
1. Congress has increased spending—particularly on benefits for military veterans.
2) Cost-of-living adjustments for Social Security and other government programs have increased as a result of higher inflation.
3) Interest rates on Treasury debt have increased as a result of higher inflation.
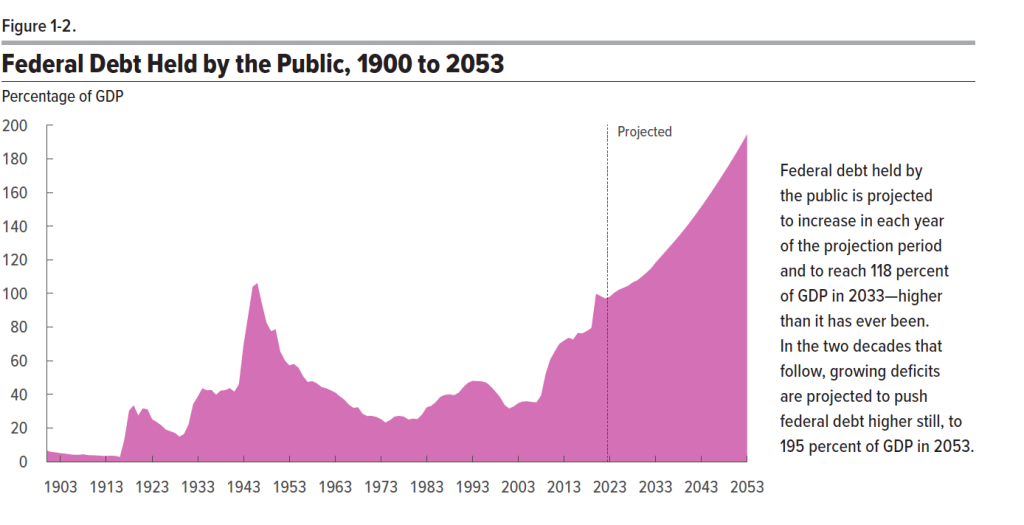
The CBO forecasts that federal debt held by the public will increase from 98 percent of GDP in 2023 to 118 percent in 2033 and eventually to 198 percent in 2053. Note that economists prefer to measure the size of the debt relative to GDP rather than in as absolute dollar amounts for two main reasons: First, measuring debt relative to GDP makes it easier to see how debt has changed over time in relation to the growth of the economy. Second, the size of debt relative to GDP makes it easier to gauge the burden that the debt imposes on the economy. When debt grows more slowly than the economy, as measured by GDP, crowding effects are likely to be relatively small. We discuss crowding out in Macroeconomics, Chapter 10, Section 10.2 and Chapter 16, Section 16. 5 (Economics, Chapter 20, Section 20.2 and Chapter 26, Section 26.5). The two most important factors driving increases in the ratio of debt to GDP are increased spending on Social Security, Medicare, and Medicaid, and increased interest payments on the debt.
The following figure is reproduced from the CBO report. It shows the ratio of debt to GDP with actual values for the period 1900-2022 and projected values for the period 2023-2053. Note that the only other time the ratio of debt to GDP rose above 100 percent was in 1945 and 1946 as a result of the large increases in federal government spending required to fight World War II.
The increased deficits and debt over the next 10 years are being driven by government spending increasing as a percentage of GDP, while government revenues (which are mainly taxes) are roughly stable as a percentage of GDP. The following figure from the report shows actual federal outlays and revenues as a percentage of GDP for the period 1973-2022 and projected outlays and revenues for the period 2023-2033. Note that from 1973 to 2022, outlays averaged 21.0 percent of GDP and revenues averaged 17.4 percent of GDP, resulting in an average deficit of 3.6 percent of GDP. By 2033, outlays are forecast to rise to 24.9 percent of GDP–well above the 1973-2022 average–whereas revenues are forecast to be only 18.1 percent, for a forecast deficit of 6.8 percent of GDP.
The increase in outlays is driven primarily by increases in mandatory spending, mainly spending on Social Security, Medicare, Medicaid, and veterans’ benefits and increases in interest payments on the debt. The CBO’s forecast assumes that discretionary spending will gradually decline over the next 10 years as percentage of GDP. Discretionary spending includes federal spending on defense and all other government programs apart from those, like Social Security, where spending is mandated by law.
To avoid the persistent deficits, and increasing debt that results, Congress would need to do one (or a combination) of the following:
1. Reduce the currently scheduled increases in mandatory spending (in political discussions this alternative is referred to as entitlement reform because entitlements is another name for manadatory spending).
2. Decrease discretionary spending, the largest component of which is defense spending.
3. Increases taxes.
There doesn’t appear to be majority support in Congress for taking any of these steps.
The CBO’s latest forecast seems gloomy, but may actually understate the likely future increases in the federal budget deficit and federal debt. The CBO’s forecast assumes that future outlays and taxes will occur as indicated in current law. For example, the forecast assumes that many of the tax cuts Congress passed in 2017 will expire in 2025 as stated in current law. Many political observers doubt that Congress will allow the tax cuts to expire as scheduled because to do so would result in increases in individual income taxes for most people. (Here is a recent article in the Washington Post that discusses this point. A subscription may be required to access the full article.) The CBO also assumes that defense spending will not increase beyond what is indicated by current law. Many political observers believe that, in fact, Congress may feel compelled to substantially increase defense spending as a result of Russia’s invasion of Ukraine in February 2022 and the potential military threat posed by China.
The CBO forecast also assumes that the U.S. economy won’t experience a recession between 2023 and 2033, which is possible but unlikely. If the economy does experience a recession, federal outlays for unemployment insurance and other programs will increase and federal personal and corporate income tax revenues will fall. The CBO’s forecast also assumes that the interest rate on the 10-year Treasury note will be under 4 percent and that the federal funds rate will be under 3 percent (interest rates on short-term Treasury debt move closely with changes in the federal funds rate). If interest rates turn out to be higher than these forecasts, the federal government’s interest payments will increase, further increasing the deficit and the debt.
In short, the federal government is clearly facing the most difficult budgetary situation since World War II.