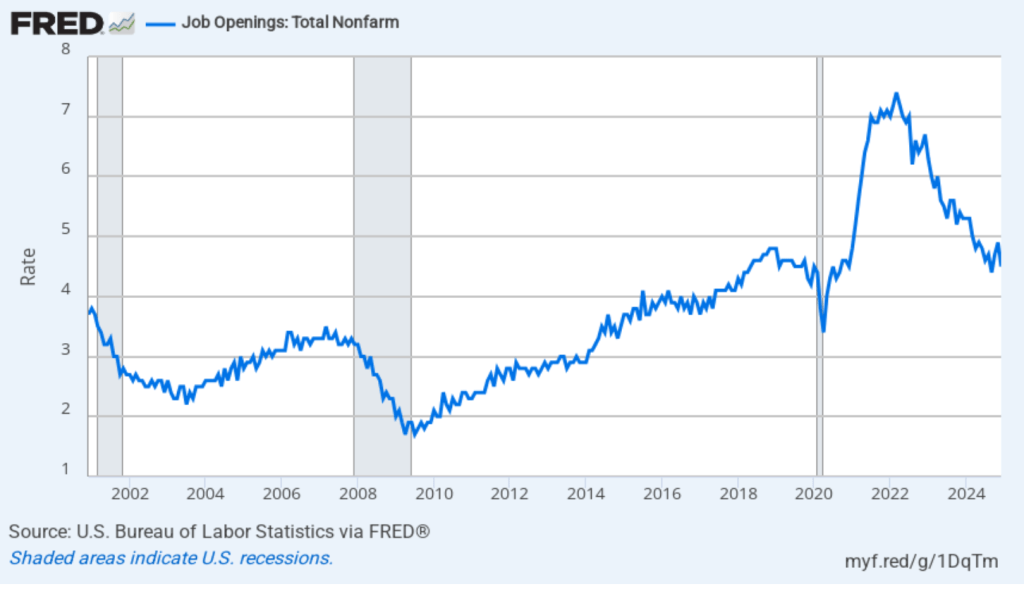
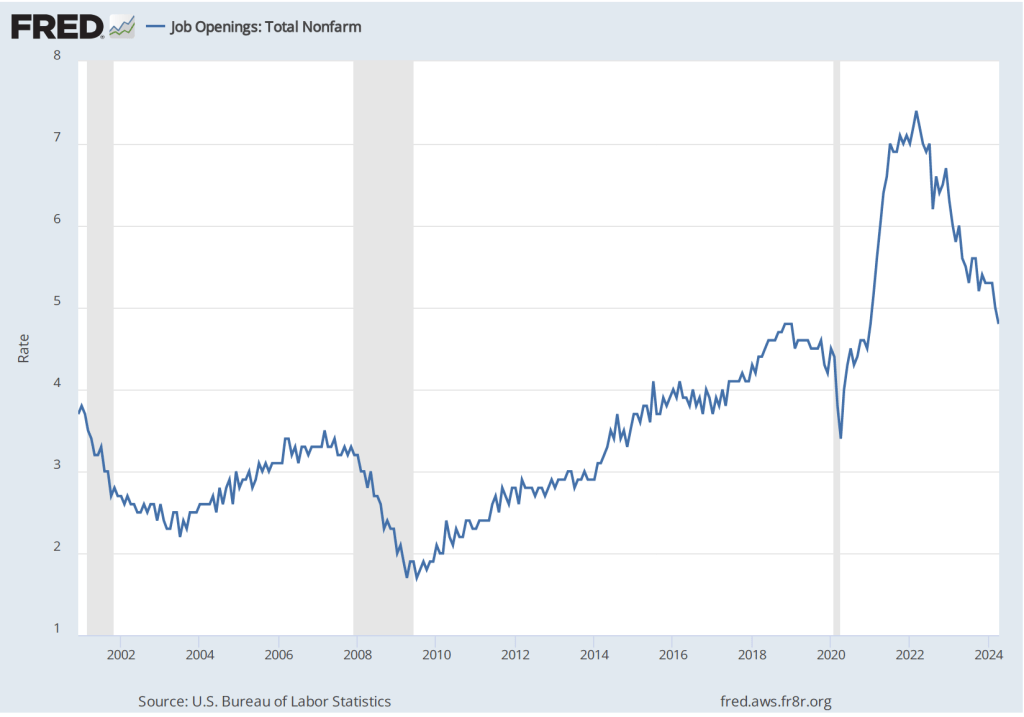
Earlier this week, the Bureau of Labor Statistics (BLS) released its “Job Openings and Labor Turnover” (JOLTS) report for December 2024. The report indicated that labor market conditions remain strong, with most indicators being in line with their values from 2019, immediately before the pandemic. The following figure shows that, at 4.5 percent, the rate of job openings remains in the same range as during the previous six months. While well down from the peak job opening rate of 7.4 percent in March 2022, the rate of job openings was the same as during the summer of 2019 and above the rates during most of the period following the Great Recession of 2007–2009.
(The BLS defines a job opening as a full-time or part-time job that a firm is advertising and that will start within 30 days. The rate of job openings is the number of job openings divided by the number of job openings plus the number employed workers, multiplied by 100.)
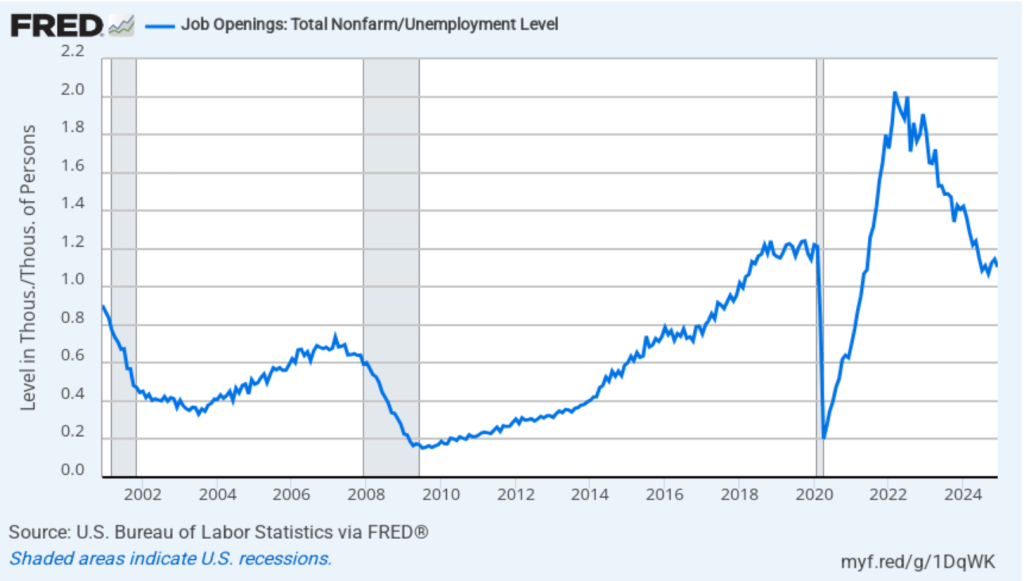
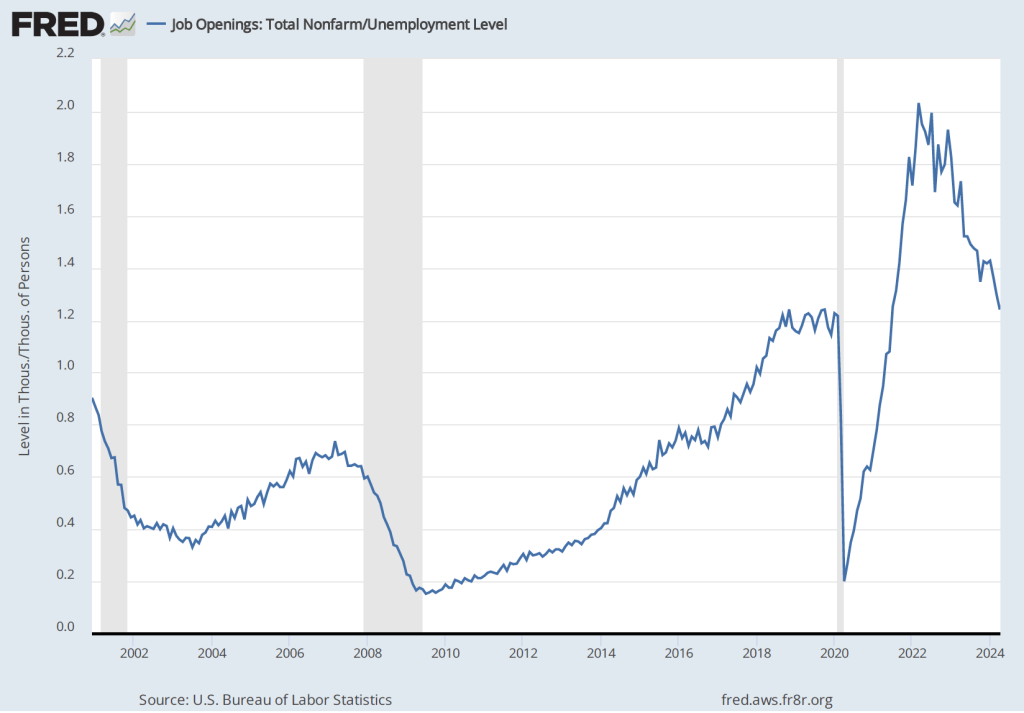
In the following figure, we compare the total number of job openings to the total number of people unemployed. The figure shows a slow decline from a peak of more than 2 job openings per unemployed person in the spring of 2022 to 1.1 job openings per unemployed person in December 2024—about the same as in 2019 and early 2020, before the pandemic. Note that the number is still above 1.0, indicating that the demand for labor is still high, although no higher than during the strong labor market of 2019.
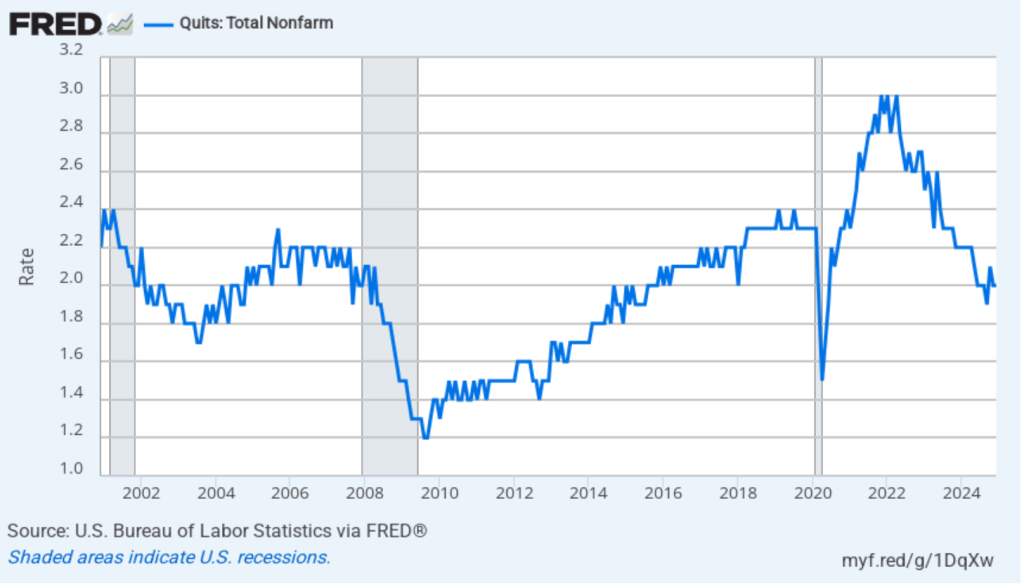
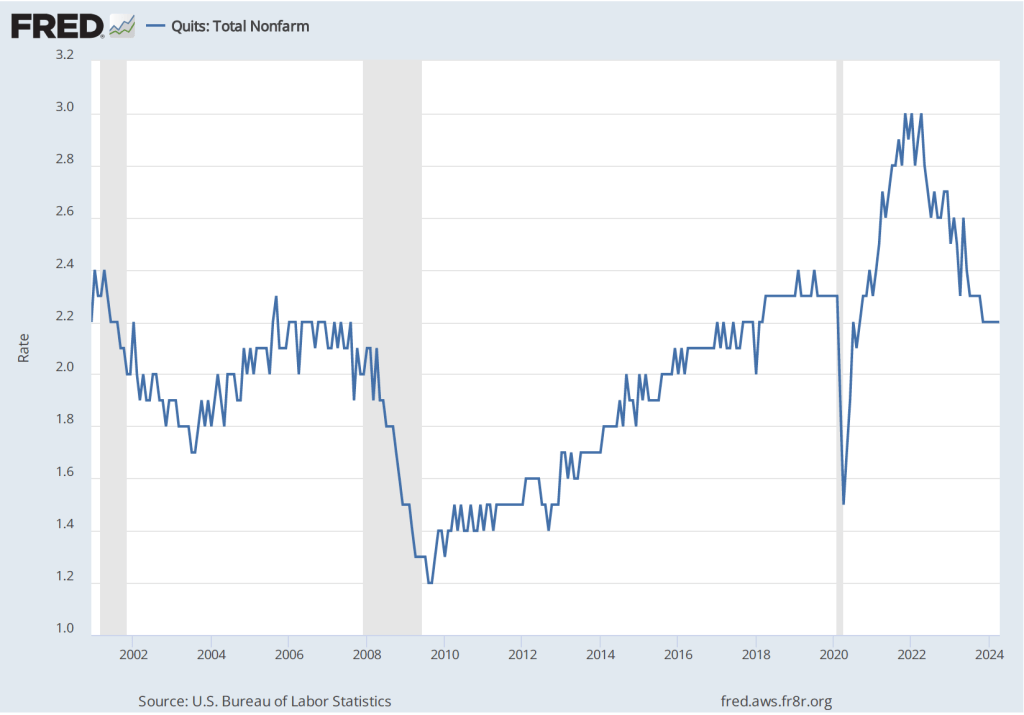
The rate at which workers are willing to quit their jobs is an indication of how they perceive the ease of finding a new job. As the following figure shows, the quit rate declined slowly from a peak of 3 percent in late 2021 and early 2022 to 2.0 percent in July 2024, the same value as in December 2024. That rate is below the rate during 2019 and early 2020. By this measure, workers’ perceptions of the state of the labor market may have deteriorated slightly in recent months.
The JOLTS data indicate that the labor market is about as strong as it was in the months prior to the start of the pandemic, but it’s not as historically tight as it was through most of 2022 and 2023. In recent months, workers may have become less optimistic about finding a new job if they quit their current job. The “Great Quitting,” which was widely discussed in the business press during the period of high quit rates in 2022 and 2023 would seem to be over.
On Friday morning, the BLS will release its “Employment Situation” report for January, which will provide additional data on the state of the labor market. (Note that the data in the JOLTS report lag the data in the “Employment Situation” report by one month.)
The “Employment Situation” report (often referred to as the “jobs report”), released monthly by the Bureau of Labor Statistics (BLS), is always closely followed by economists and policymakers because it provides important insight in the current state of the U.S. economy. The jobs report for August, which was released in early September, showed signs that the labor market was cooling. The report played a role in the decision by the Fed’s policy-making Federal Open Market Committee to cut its target for the federal funds rate by 0.50 percentage point (50 basis points) at its meeting on September 17-18. A 0.25 percentage point (25 basis points) cut would have been more typical.
In a press conference following the meeting, Fed Chair Jerome Powell explained that one reason that the Fed’s policy-making Federal Open Market Committee (FOMC) cut its for the federal funds rate by 50 basis points rather than by 25 basis points was the state of the labor market: “In the labor market, conditions have continued to cool. Payroll job gains averaged 116,000 per month over the past three months, a notable step-down from the pace seen earlier in the year.”
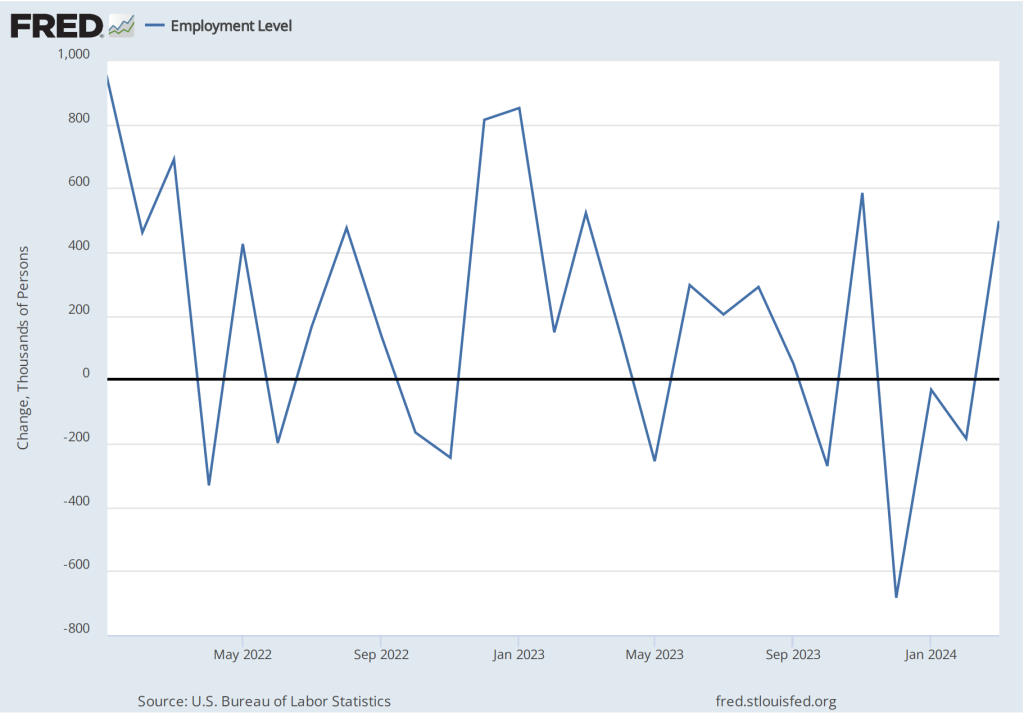
The September jobs report released this morning (October 4) indicates that conditions in the labor market appear to have turned around. The jobs report has two estimates of the change in employment during the month: one estimate from the establishment survey, often referred to as the payroll survey, and one from the household survey. As we discuss in Macroeconomics, Chapter 9, Section 9.1 (Economics, Chapter 19, Section 19.1), many economists and policymakers at the Federal Reserve believe that employment data from the establishment survey provides a more accurate indicator of the state of the labor market than do either the employment data or the unemployment data from the household survey. (The groups included in the employment estimates from the two surveys are somewhat different, as we discuss in this post.)
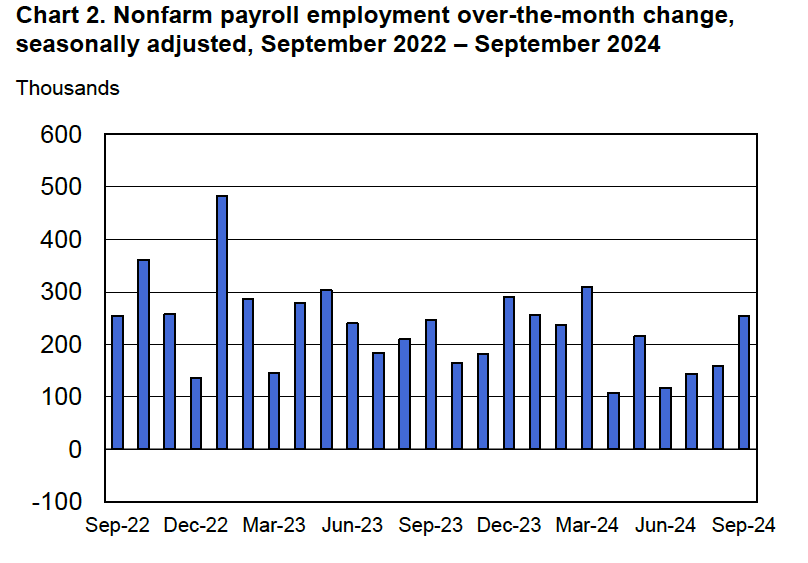
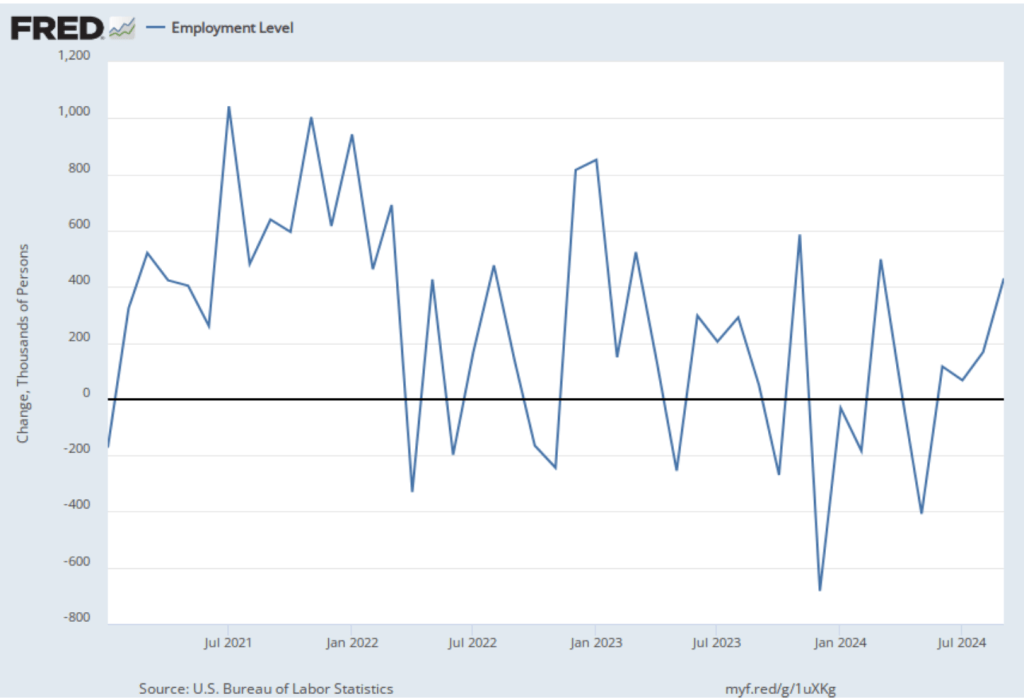
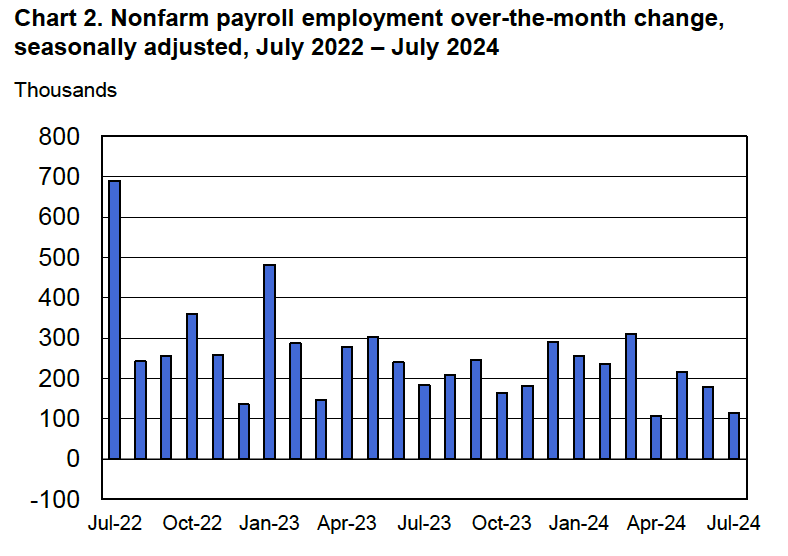
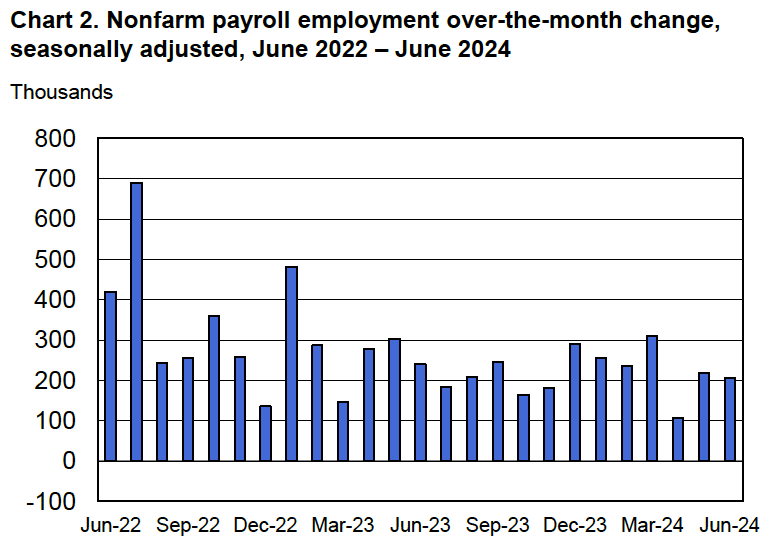
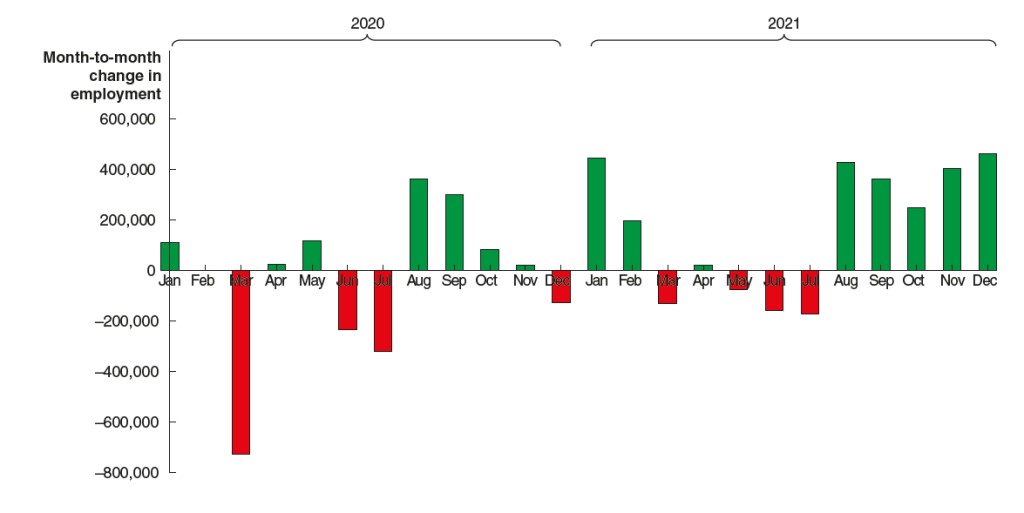
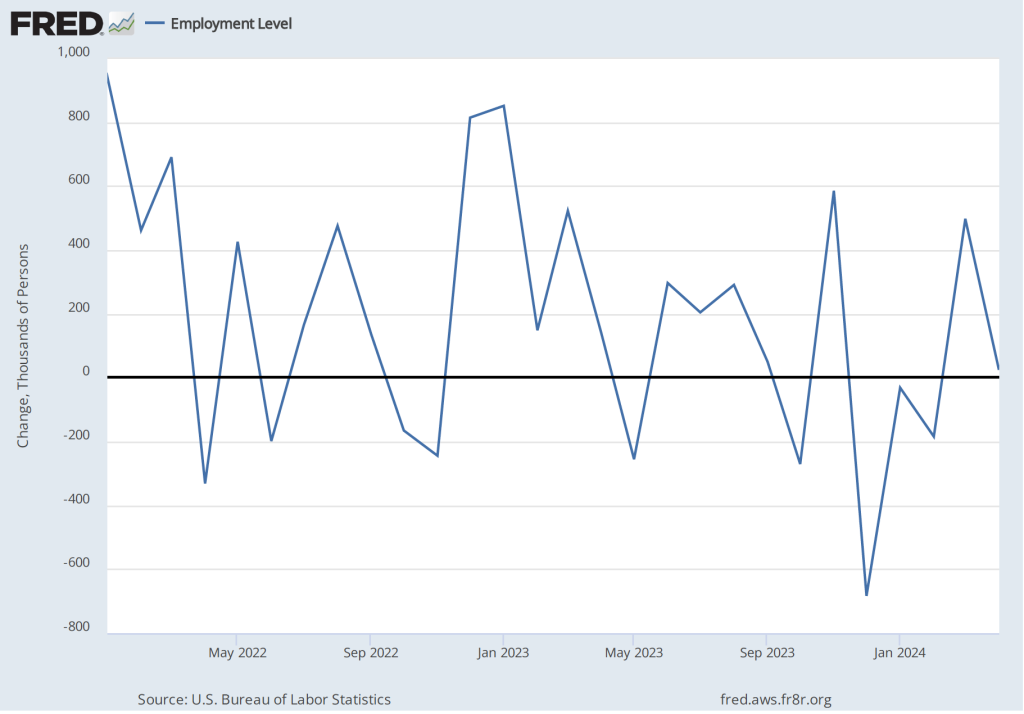
Economists surveyed by the Wall Street Journal and by Bloomberg had forecast a net increase in payroll employment of 150,000 and an unchanged unemployment rate of 4.2 percent. The BLS reported a higher net increase of 250,000 jobs and a tick down of the unemployment rate to 4.1 percent. In addition, the BLS revised upward its estimates of the employment increases in July and August by a total of 72,000. (The BLS notes that: “Monthly revisions result from additional reports received from businesses and government agencies since the last published estimates and from the recalculation of seasonal factors.”) The following figure, taken from the BLS report, shows the net changes in employment for each month during the past two years.
What had seemed from the BLS’s initial estimates to be slow growth in employment from April to June has been partly reversed by revisions. With the current estimates, employment has been increasing since July at a pace that should reduce any concerns that U.S. economy is on the brink of a recession.
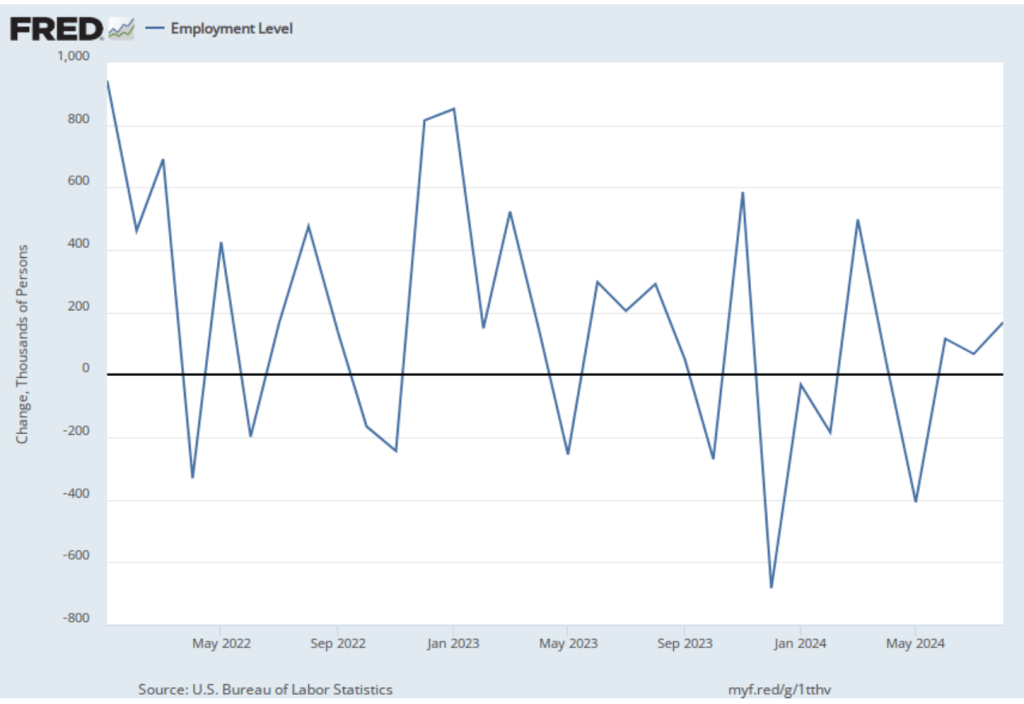
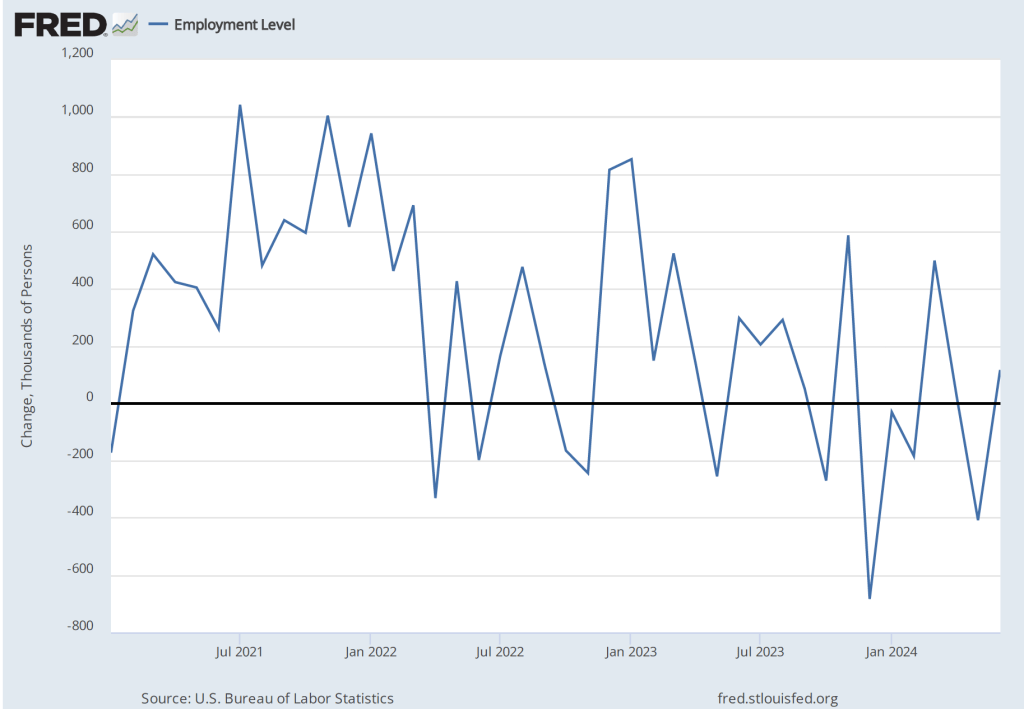
As the following figure shows, the net change in jobs from the household survey moves much more erratically than does the net change in jobs from the establishment survey. The net change in jobs as measured by the household survey increased from 168,000 in August to 430,000 in September. So, in this case the direction of change in the two surveys was the same, with both showing strong increases in the net number of jobs created in September.
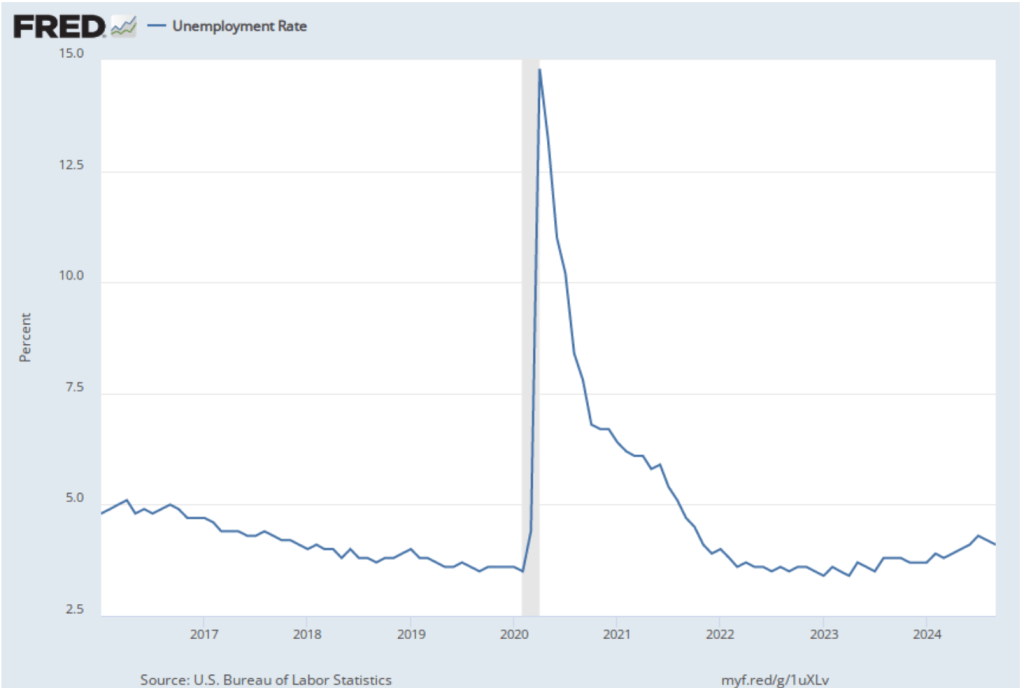
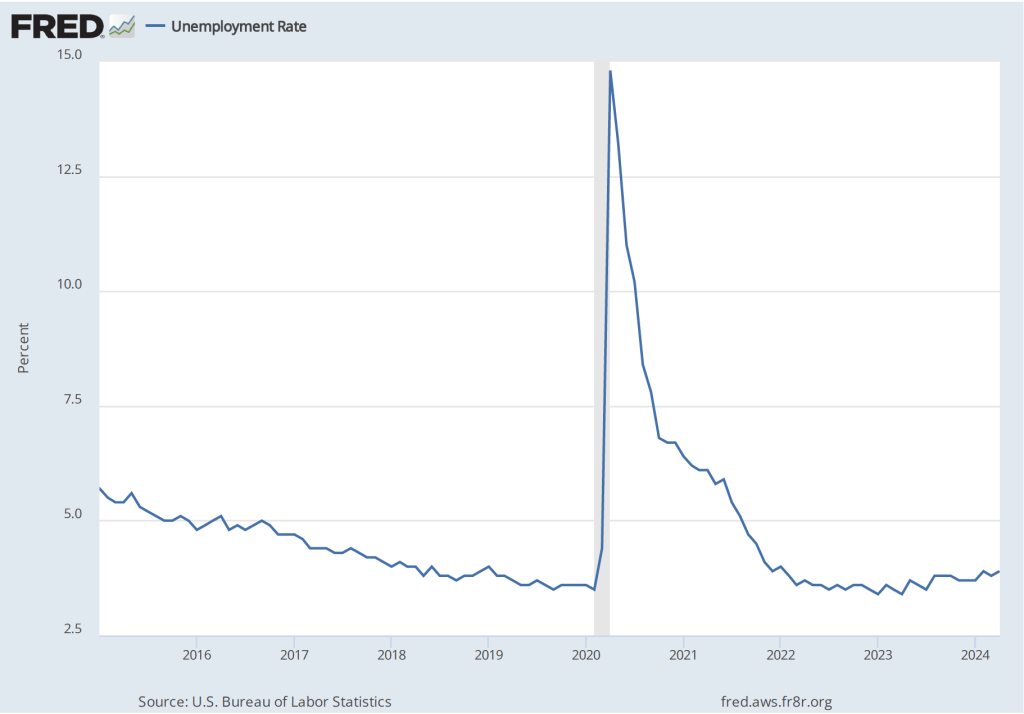
As the following figure shows, the unemployment rate, which is also reported in the household survey, decreased slightly for the second month in a row. It declined from 4.2 percent in August to 4.1 percent in September.
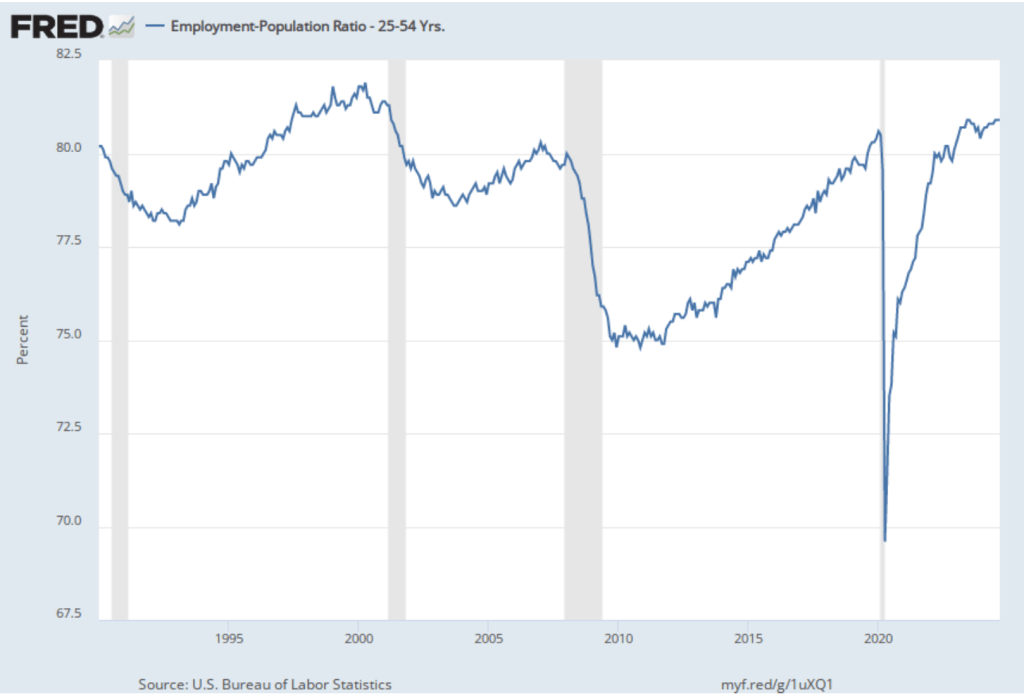
The household survey also provides data on the employment-population ratio. The following figure shows the employment-population ratio for prime age workers—those aged 25 to 54. It’s been unchanged since July at 80.9 percent, the higest level since 2001.
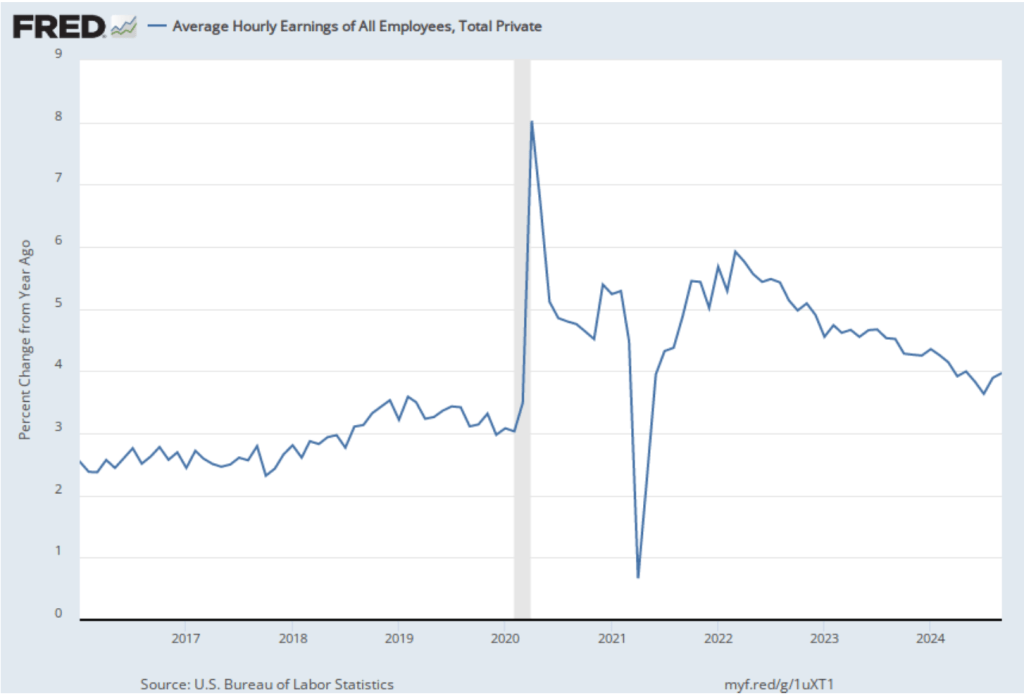
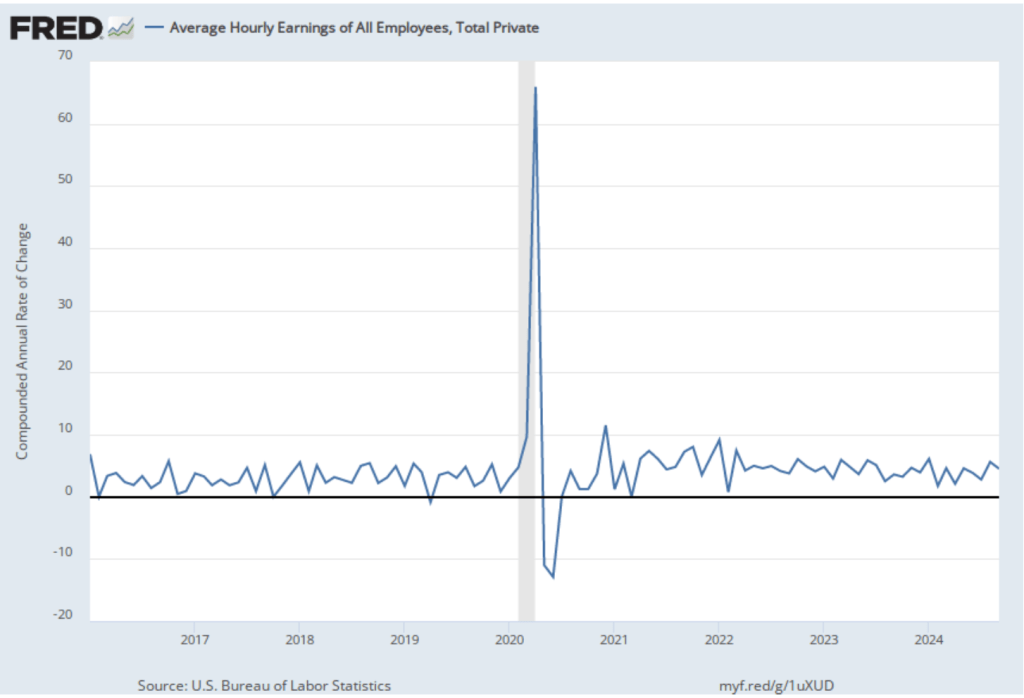
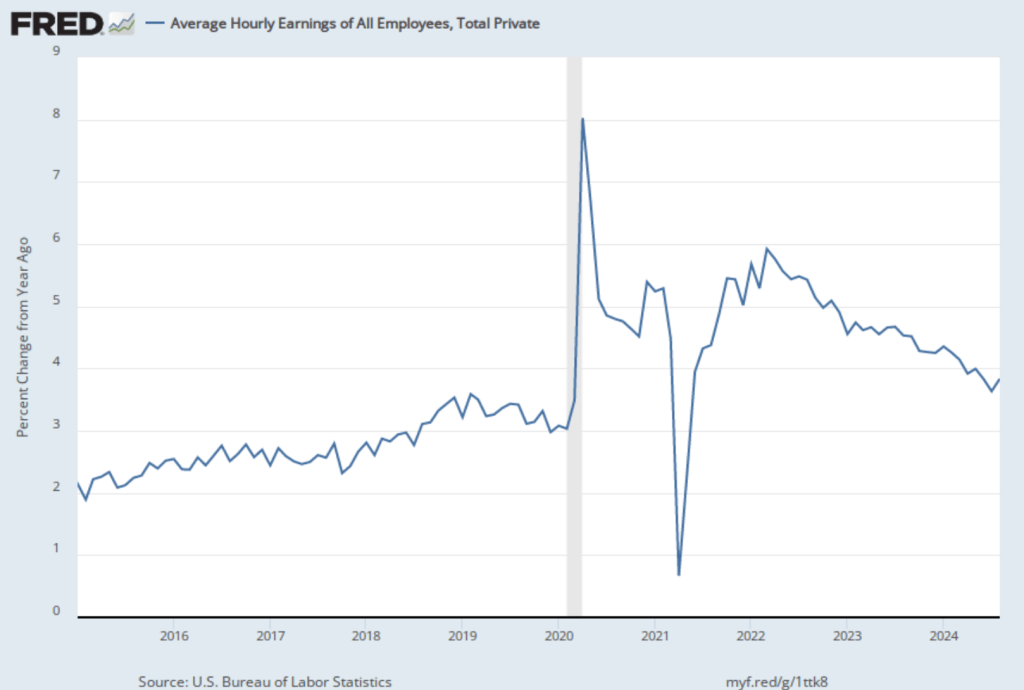
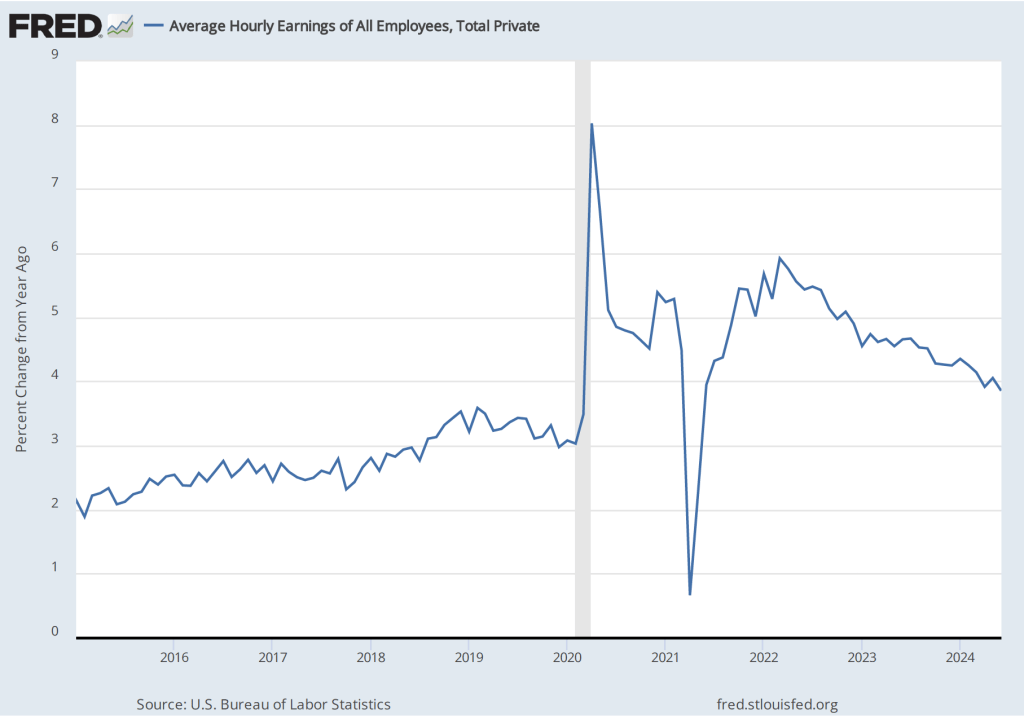
The establishment survey also includes data on average hourly earnings (AHE). As we note in this post, many economists and policymakers believe the employment cost index (ECI) is a better measure of wage pressures in the economy than is the AHE. The AHE does have the important advantage that it is available monthly, whereas the ECI is only available quarterly. The following figure shows the percentage change in the AHE from the same month in the previous year. AHE increased 4.0 percent in September, up from a 3.9 percent increase in August.
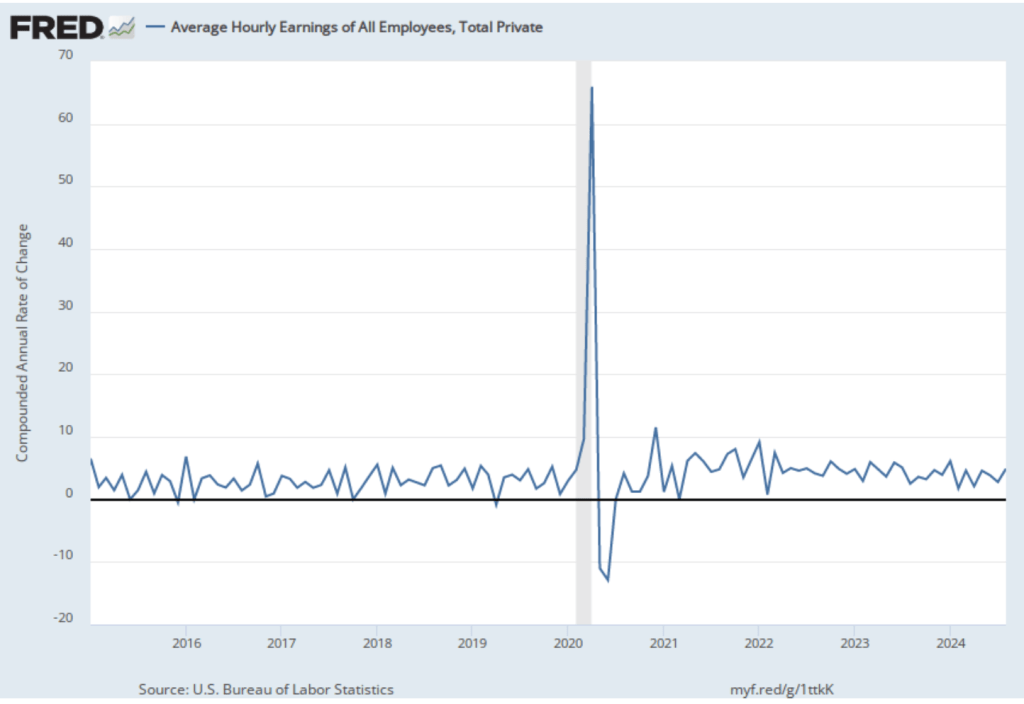
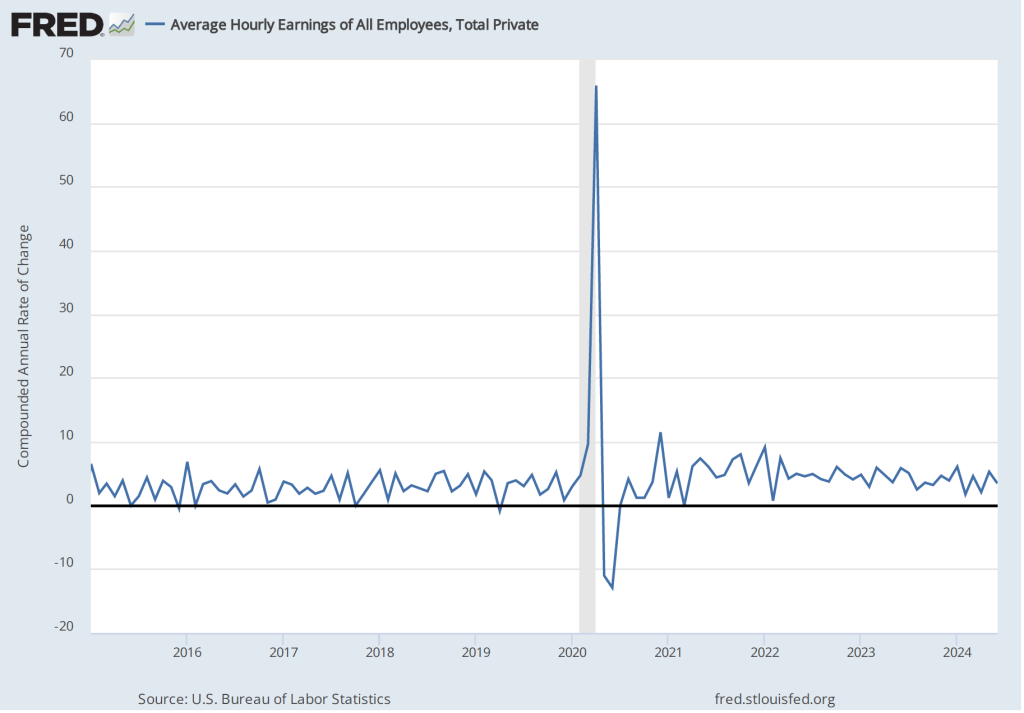
The following figure shows wage inflation calculated by compounding the current month’s rate over an entire year. (The figure above shows what is sometimes called 12-month wage inflation, whereas this figure shows 1-month wage inflation.) One-month wage inflation is much more volatile than 12-month wage inflation—note the very large swings in 1-month wage inflation in April and May 2020 during the business closures caused by the Covid pandemic.
The 1-month rate of wage inflation of 4.5 percent in September is a decrease from the 5.6 percent rate in August. Whether measured as a 12-month increase or as a 1-month increase, AHE is increasing more rapidly than is consistent with the Fed achieving its 2 percent target rate of price inflation.
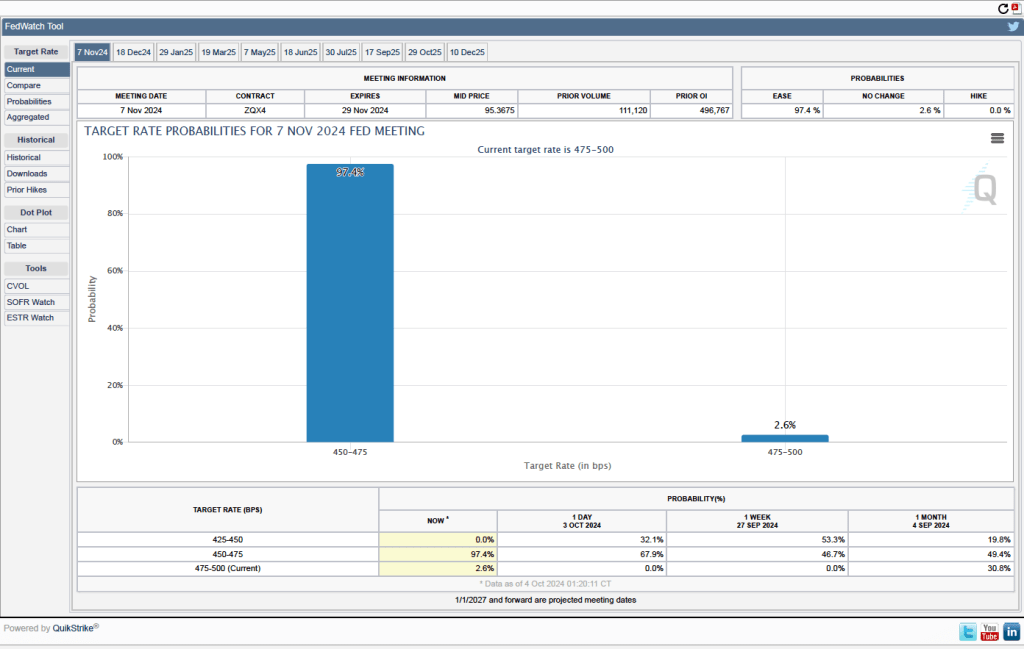
What effect will this jobs report likely have on the FOMC’s actions at its final two meetings of the year on November 6-7 and December 17-18? Some investors were expecting that the FOMC would cut its target for the federal funds rate by 50 basis points at its next meeting, matching the cut at its September meeting. This jobs report makes it seem more likely that the FOMC will cut its target by 25 basis points.
One indication of expectations of future rate cuts comes from investors who buy and sell federal funds futures contracts. (We discuss the futures market for federal funds in this blog post.) As shown in the following figure, today these investors assign a probability of 97.4 percent to the FOMC cutting its target for the federal funds rate by 25 basis points percentage point at its next meeting and a probability of 2.6 percent to the FOMC leaving its target unchanged at a range of 4.75 percent to 5.00 percent. Investors see effectively no chance of a 50 basis point cut at the next meeting.
The “Employment Situation” report (often referred to as the “jobs report”), which is released monthly by the Bureau of Labor Statistics (BLS), is always closely followed by economists and policymakers because it provides important insight in the current state of the U.S. economy. This month’s report is considered particularly important because last month’s report indicated that the labor market might be weaker than most economists had believed. As we discussed in a recent blog post, late last month Fed Chair Jerome Powell signaled that the Fed’s policy-making Federal Open Market Committee (FOMC) was likely to cut its target for the federal funds rate at its next meeting on September 17-18.
Economists and investment analysts had speculated that following August’s unexpectedly weak jobs report, another weak report might lead the FOMC to cut its federal funds target by 0.50 percentage rate rather than by the more typical 0.25 percent point. The jobs report the BLS released this morning (September 6) was mixed, showing a somewhat lower than expected increase in employment as measured by the establishment survey, but higher wage growth.
The jobs report has two estimates of the change in employment during the month: one estimate from the establishment survey, often referred to as the payroll survey, and one from the household survey. As we discuss in Macroeconomics, Chapter 9, Section 9.1 (Economics, Chapter 19, Section 19.1), many economists and policymakers at the Federal Reserve believe that employment data from the establishment survey provides a more accurate indicator of the state of the labor market than do either the employment data or the unemployment data from the household survey. (The groups included in the employment estimates from the two surveys are somewhat different, as we discuss in this post.)
According to the establishment survey, there was a net increase of 142,000 jobs during August. This increase was below the increase of 161,000 that economists had forecast in a survey by the Wall Street Journal. The following figure, taken from the BLS report, shows the monthly net changes in employment for each month during the past two years. The BLS revised lower its estimates of the net increase in jobs during June and July by a total of 86,000. (The BLS notes that: “Monthly revisions result from additional reports received from businesses and government agencies since the last published estimates and from the recalculation of seasonal factors.”)
The BLS’s estimate of average monthly job growth during the last three months is now 116,000, a significant decline from an average of 211,000 per month during the previous three months and 251,000 per month during 2023.
As the following figure shows, the net change in jobs from the household survey moves much more erratically than does the net change in jobs in the establishment survey. The net change in jobs as measured by the household survey increased from 67,000 in July to 168,000 in August. So, in this case the direction of change in the two surveys was the same—an increase in the net number of jobs created in August compared with July.
As the following figure shows, the unemployment rate, which is also reported in the household survey, decreased from 4.3 percent to 4.2 percent—breaking what had been a five month string of unemployment rate increases.
The establishment survey also includes data on average hourly earnings (AHE). As we note in this post, many economists and policymakers believe the employment cost index (ECI) is a better measure of wage pressures in the economy than is the AHE. The AHE does have the important advantage that it is available monthly, whereas the ECI is only available quarterly. The following figure shows the percentage change in the AHE from the same month in the previous year. AHE increased 3.8 percent in August, up from a 3.6 percent increase in July.
The following figure shows wage inflation calculated by compounding the current month’s rate over an entire year. (The figure above shows what is sometimes called 12-month wage inflation, whereas this figure shows 1-month wage inflation.) One-month wage inflation is much more volatile than 12-month inflation—note the very large swings in 1-month wage inflation in April and May 2020 during the business closures caused by the Covid pandemic.
The 1-month rate of wage inflation of 4.9 percent in August is a significant increase from the 2.8 percent rate in July, although it’s unclear whether the increase represented renewed upward wage pressure in the labor market or reflected the greater volatility in wage inflation when calculated this way.
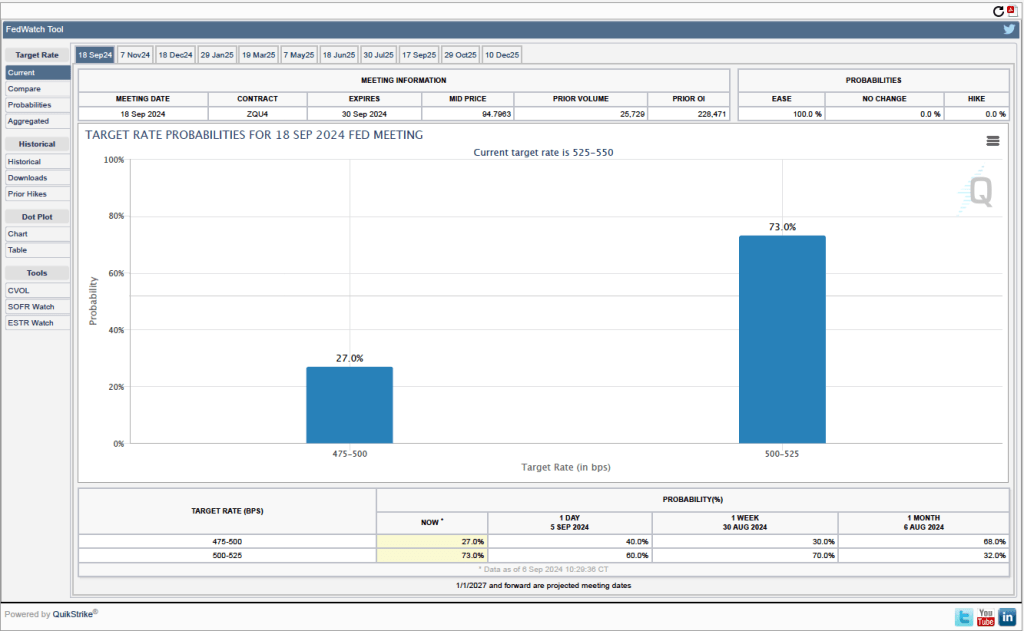
What effect is this jobs report likely to have on the FOMC’s actions at its September meeting? One indication comes from investors who buy and sell federal funds futures contracts. (We discuss the futures market for federal funds in this blog post.) As shown in the following figure, today these investors assign a probability of 73.0 percent to the FOMC cutting its target for the federal funds rate by 0.25 percentage point at its next meeting and a probability of only 27.0 percent that the cut will be 0.50 percentage point. In contrast, after the last jobs report was interpreted to indicate a dramatic slowing of the economy, investors assigned a probability of 79.5 percent to a 0.50 cut in the federal funds rate target.
It seems most likely following today’s mixed job report that the FOMC will cut its target for the federal funds rate by 0.25 percent point from the current target range of 5.25 percent to 5.50 percent to a range of 5.00 percent to 5.25 percent. The report doesn’t indicate the significant weakening in the labor market that was probably needed to push the committee to cutting its target by 0.50 percent point.
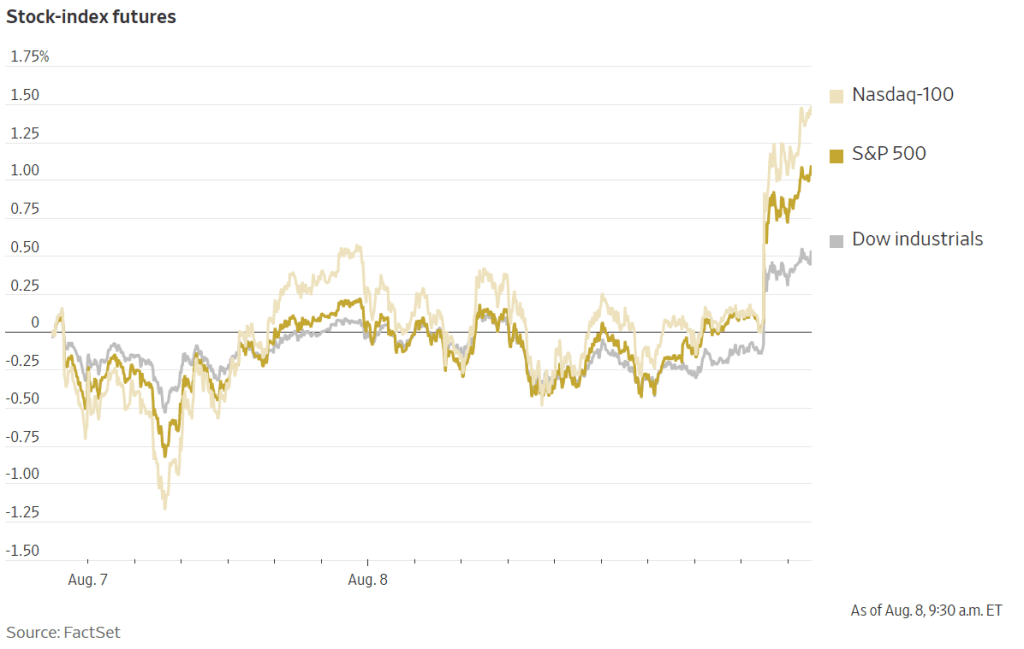
Over the first past few days, the stock and bond markets have gone through substantial swings as investors try to determine whether the U.S. economy is likely to move into a recession soon. (We discussed here the most recent BLS “Employment Situation” report, which was surprisingly weak.)
It’s difficult to determine with certainty why on a particular day stock and bond prices fluctuate. The following two figures from the Wall Street Journal show movements this morning (August 8) in stock prices and bond yields. (Recall that bond yields rise when bond prices fall, a point we discuss in the Appendix to Chapter 6 of Macroeconomics (Chapter 8 of Economics).)
Rising stock prices and falling bond prices (rising bond yields) can be an indication that investors are more optimistic that the U.S. economy will avoid a recession. In a recession, profits decline, which is bad for stock prices. And in a recession, interest rates typically fall both because the Federal Reserve cuts it target range for the federal funds rate and because household and firms borrow less, which reduces the demand for loanable funds. Accordingly, most analysts are attributing the movements in stock and bond prices this morning to investors becoming more optimistic that the U.S. economy will avoid a recession.
Because of the level of uncertainty about the future path of the economy, investors are following very closely the release of new macroeconomic data. The Wall Street Journal and other business publications attributed the increase in investor optimism this morning to the U.S. Employment and Training Administration releasing at 8:30 a.m. its latest report on initial claims for unemployment insurance. The headline in the Wall Street Journal was: “Stocks Rise on Claims Data.” Similalry, the headline on bloomberg.com was: “Stocks Get Relief Rally after Jobless Claims Data.”
What are jobless claims? The first step when you lose a job and wish to receive government unemployment insurance payments is to file a claim, which starts the process by which an agency of the state government determines whether you are eligible to receive unemployment insurance payments.
The data on initial jobless claims are released weekly. As the following figure shows, there is a lot of volatility in this data series. The latest data were favorable—which is thought to have caused the increase in stock prices and decline in bond prices—because new claims declined by 17,000 this week. But the series is so volatile that drawing conclusions from weekly changes seems unwarranted. For instance, the figure shows that weekly claims surged during the summer of 2023, although employment and production continued to expand during that period.
So it appears that people trading in stock and bond markets this morning are overreacting to this macrodata release. But explanations of why stock and bonds prices move as they do over a short period of time often turnout in hindsight to have been incorrect. It may well be the case that investors are acting as they are this morning for reasons that are, in fact, unrelated to the data on jobless claims.
Earlier this week, as we discussed in this blog post, the Federal Reserve’s policy-making Federal Open Market Committee (FOMC) voted to leave its target for the federal funds rate unchanged. In his press conference following the meeting, Fed Chair Jerome Powell stated that: “Overall, a broad set of indicators suggests that conditions in the labor market have returned to about where they stood on the eve of the pandemic—strong but not overheated.”
This morning (August 2), the Bureau of Labor Statistics (BLS) released its “Employment Situation” report (often referred to as the “jobs report”) for July, which indicates that the labor market may be weaker than Powell and the other members of the FOMC believed it to be when they decided to leave their target for the federal funds rate unchanged.
The jobs report has two estimates of the change in employment during the month: one estimate from the establishment survey, often referred to as the payroll survey, and one from the household survey. As we discuss in Macroeconomics, Chapter 9, Section 9.1 (Economics, Chapter 19, Section 19.1), many economists and policymakers at the Federal Reserve believe that employment data from the establishment survey provides a more accurate indicator of the state of the labor market than do either the employment data or the unemployment data from the household survey. (The groups included in the employment estimates from the two surveys are somewhat different, as we discuss in this post.)
According to the establishment survey, there was a net increase of 114,000 jobs during July. This increase was below the increase of 175,000 to 185,000 that economists had forecast in surveys by the Wall Street Journal and bloomberg.com. The following figure, taken from the BLS report, shows the monthly net changes in employment for each month during the past two years.
The previously reported increases in employment for April and May were revised downward by 29,000 jobs. (The BLS notes that: “Monthly revisions result from additional reports received from businesses and government agencies since the last published estimates and from the recalculation of seasonal factors.”) As we’ve discussed in previous posts (most recently here), downward revisions to the payroll employment estimates are particularly likely at the beginning of a recession, although this month’s adjustments were relatively small.
As the following figure shows, the net change in jobs from the household survey moves much more erratically than does the net change in jobs in the establishment survey. The net change in jobs as measured by the household survey declined from 116,000 in June to 67,000 in June. So, in this case the direction of change in the two surveys was the same—a decline in the increase in the number of jobs.
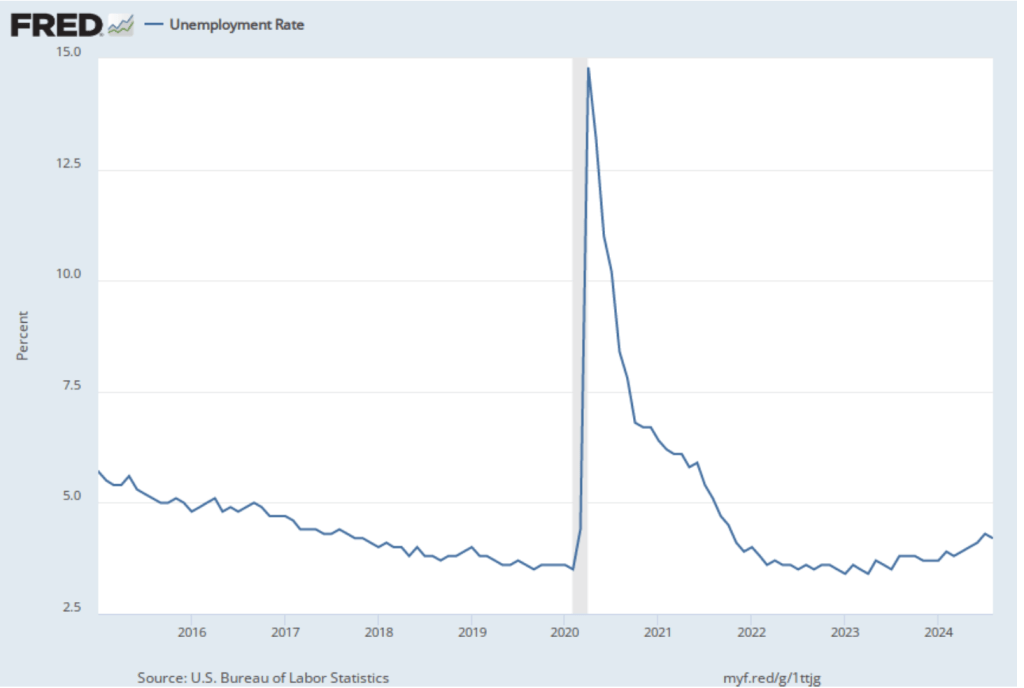
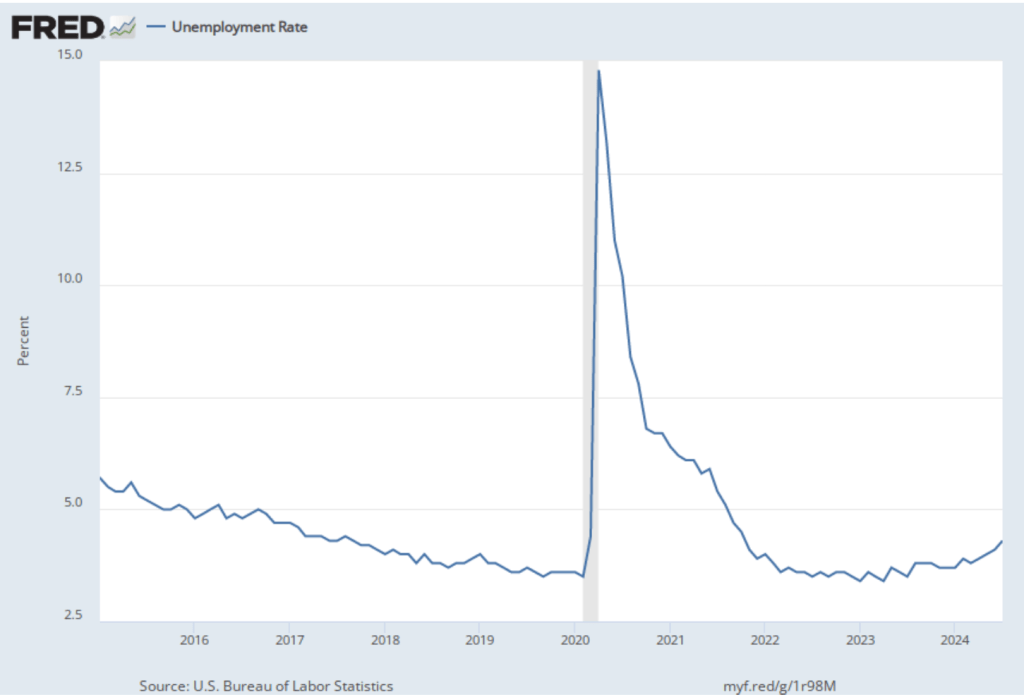
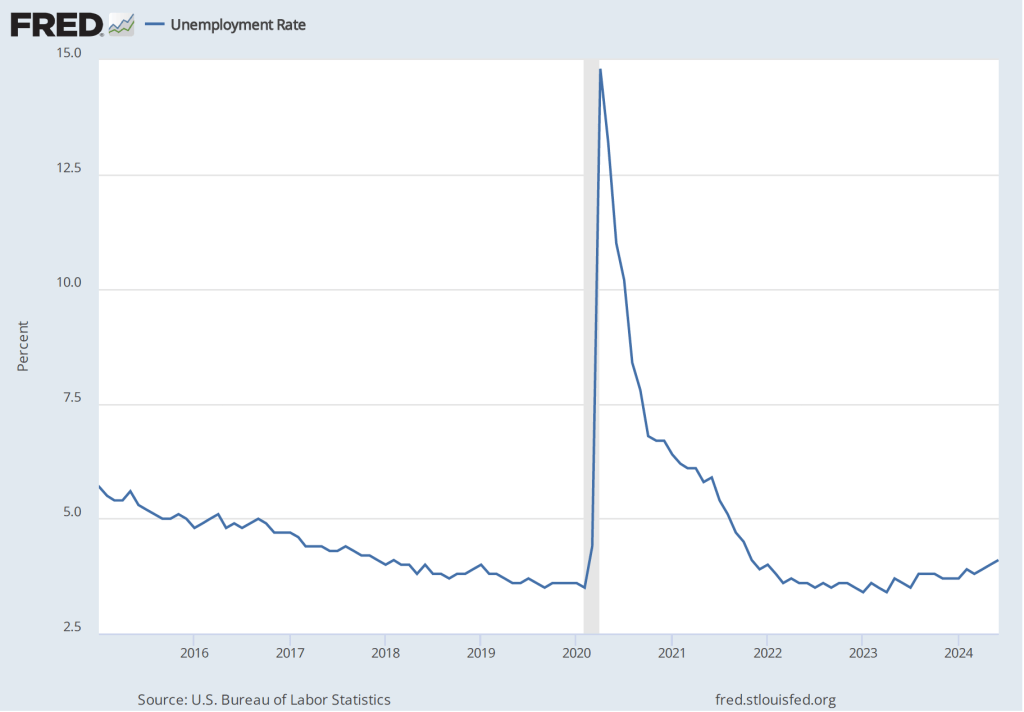
As the following figure shows, the unemployment rate, which is also reported in the household survey, increased from 4.1 percent to 4.3 percent—the highest unemployment rate since October 2021. Although still low by historical standards, July was the fifth consecutive month in which the unemployment rate increased. It is also higher than the unemployment rate just before the pandemic. The unemployment rate was below 4 percent most months from mid-2018 to early 2020.
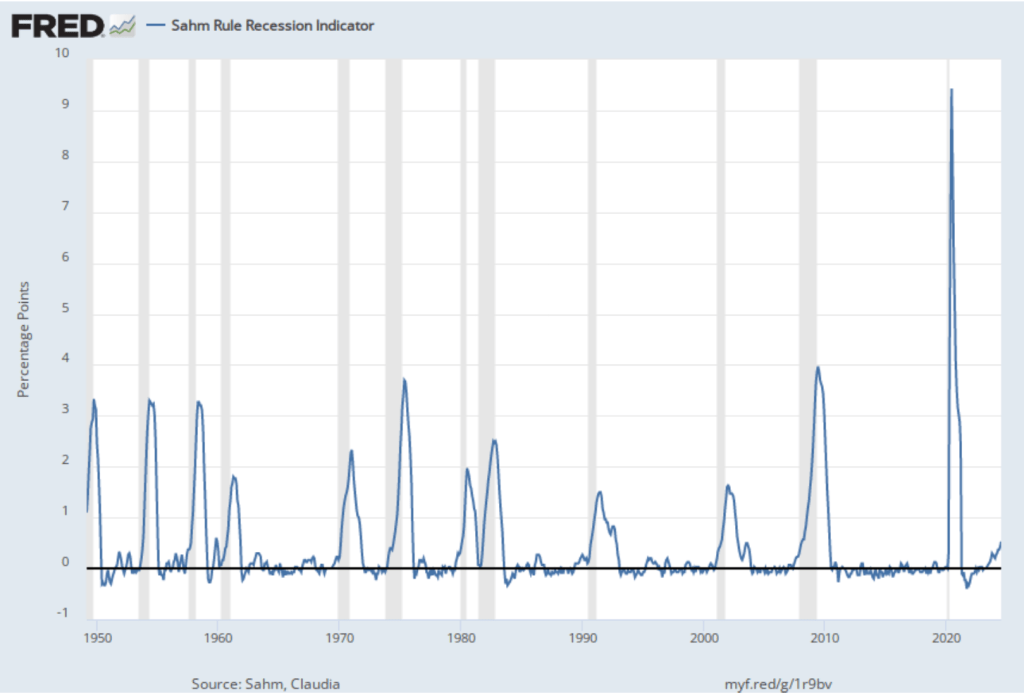
Some economists and policymakers have been following the Sahm rule, named after Claudia Sahm Chief Economist for New Century Advisors and a former Fed economist. The Sahm rule, as stated on the site of the Federal Reserve Bank of St. Louis is: “Sahm Recession Indicator signals the start of a recession when the three-month moving average of the national unemployment rate (U3 [measure]) rises by 0.50 percentage points or more relative to the minimum of the three-month averages from the previous 12 months.” The following figure shows the values of this indicator dating back to March 1949.
So, according to this indicator, the U.S. economy is now at the start of a recession. Does that mean that a recession has actually started? Not necessarily. As Sahm stated in an interview this morning, her indicator is a historical relationship that may not always hold, particularly given how signficantly the labor market has been affected during the last four years by the pandemic.
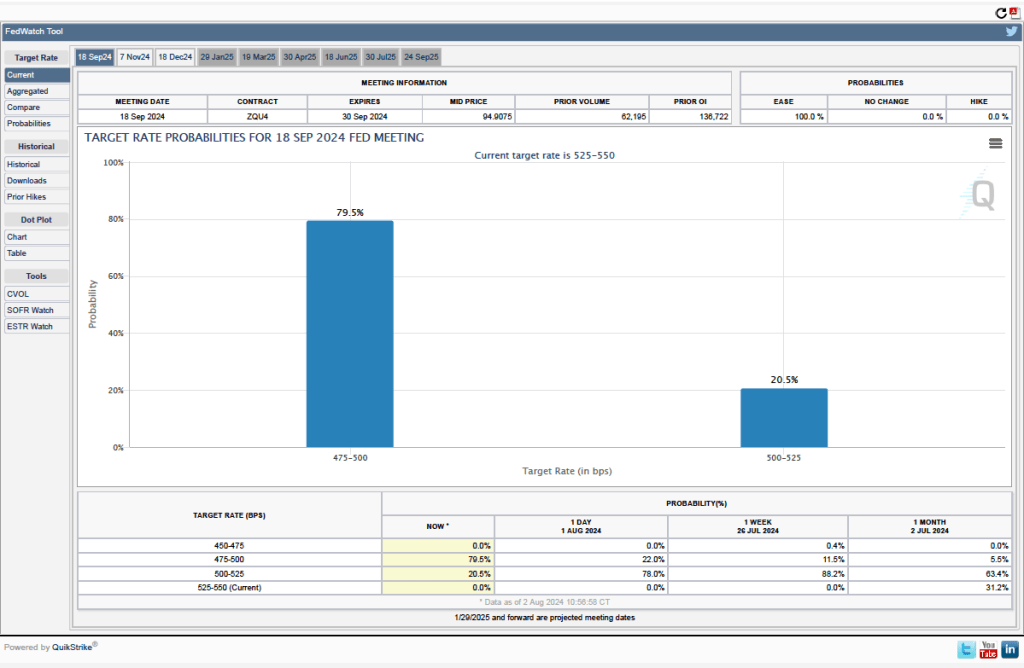
As we noted in a post earlier this week, investors who buy and sell federal funds futures contracts assigned a probability of 11 percent that the FOMC would cut its target for the federal funds rate by 0.50 percentage point at its next meeting. (Investors in this market assigned a probability of 89 percent that the FOMC would cut its target by o.25 percentage point.) Today, investors dramatically increased the probability to 79.5 percent of a 0.50 cut in the federal funds rate target, as shown in this figure from the CME site.
Investors on the stock market appear to believe that the probability of a recession beginning before the end of the year has increased, as indicated by sharp declines today in the stock market indexes.
The next scheduled FOMC meeting isn’t until September 17-18. The FOMC is free to meet in between scheduled meetings but doing so might be interpreted as meanng that economy is in crisis, which is a message the committee is unlikely to want to send. It would likely take additional unfavorable reports on macro data for the FOMC not to wait until September to take action on cutting its target for the federal funds rate.
Recent macroeconomic data have been sending mixed signals about the state of the U.S. economy. The growth in real GDP, industrial production, retail sales, and real consumption spending has been slowing. Growth in employment has been a bright spot—showing steady net increases in job growth above the level necessary to keep up with population growth. Even here, though, as we discuss in a recent blog post, the data may be overstating the actual strength of the labor market.
This morning (July 5), the Bureau of Labor Statistics (BLS) released its “Employment Situation” report (often referred to as the “jobs report”) for June, which, while seemingly indicating continued strong job growth, also provides some indications that the labor market may be weakening. The jobs report has two estimates of the change in employment during the month: one estimate from the establishment survey, often referred to as the payroll survey, and one from the household survey. As we discuss in Macroeconomics, Chapter 9, Section 9.1 (Economics, Chapter 19, Section 19.1), many economists and policymakers at the Federal Reserve believe that employment data from the establishment survey provides a more accurate indicator of the state of the labor market than do either the employment data or the unemployment data from the household survey. (The groups included in the employment estimates from the two surveys are somewhat different, as we discuss in this post.)
According to the establishment survey, there was a net increase of 206,000 jobs during April. This increase was a little above the increase of 1900,000 to 200,000 that economists had forecast in surveys by the Wall Street Journal and bloomberg.com. The following figure, taken from the BLS report, shows the monthly net changes in employment for each month during the past to years.
It’s notable that the previously reported increases in employment for April and May were revised downward by 110,000 jobs, or by about 25 percent. (The BLS notes that: “Monthly revisions result from additional reports received from businesses and government agencies since the last published estimates and from the recalculation of seasonal factors.”) As we’ve discussed in previous posts (most recently here), revisions to the payroll employment estimates can be particularly large at the beginning of a recession.
As the following figure shows, the net change in jobs from the household survey moves much more erratically than does the net change in jobs in the establishment survey. The net increase in jobs as measured by the household survey increased from –408,000 in May (that is, employment by this measure fell during May) to 116,000 in June.
Note that the BLS also reports a survey for household employment adjusted to conform to the concepts and definitions used to construct the payroll employment series. After this adjustment, over the past 12 months household employment has increased by 32.5 million less than has payroll employment. Clearly, this is a very large discrepancy and may be indicating that the payroll survey is substantially overstating growth in employment.
The unemployment rate, which is also reported in the household survey, ticked up slightly from 4.0 percent to 4.1 percent. Although still low by historical standards, June was the fourth consecutive month in which the unemployment rate increased.
The establishment survey also includes data on average hourly earnings (AHE). As we note in this post, many economists and policymakers believe the employment cost index (ECI) is a better measure of wage pressures in the economy than is the AHE. The AHE does have the important advantage that it is available monthly, whereas the ECI is only available quarterly. The following figure show the percentage change in the AHE from the same month in the previous year. The 3.9 percent increase for June continues a downward trend that began in January and is the smallest increase since June 2021.
The following figure shows wage inflation calculated by compounding the current month’s rate over an entire year. (The figure above shows what is sometimes called 12-month wage inflation, whereas this figure shows 1-month wage inflation.) One-month wage inflation is much more volatile than 12-month inflation—note the very large swings in 1-month wage inflation in April and May 2020 during the business closures caused by the Covid pandemic.
The 1-month rate of wage inflation of 3.5 percent in June is a significant decrease from the 5.3 percent rate in May, although it’s unclear whether the decline was an additional sign that the labor market is weakening or reflected the greater volatility in wage inflation when calculated this way.
What effect is today’s job reports likely to have on the Fed’s policy-making Federal Open Market Committee as it considers changes in its target for the federal funds rate? As always, it’s a good idea not to rely too heavily on a single data point—particularly because, as we noted earlier, the establishment survey employment data is subject to substantial revisions. But the Wall Street Journal’sheadline that the “Case for September Rate Cut Builds After Slower Jobs Data,” seems likely to be accurate.
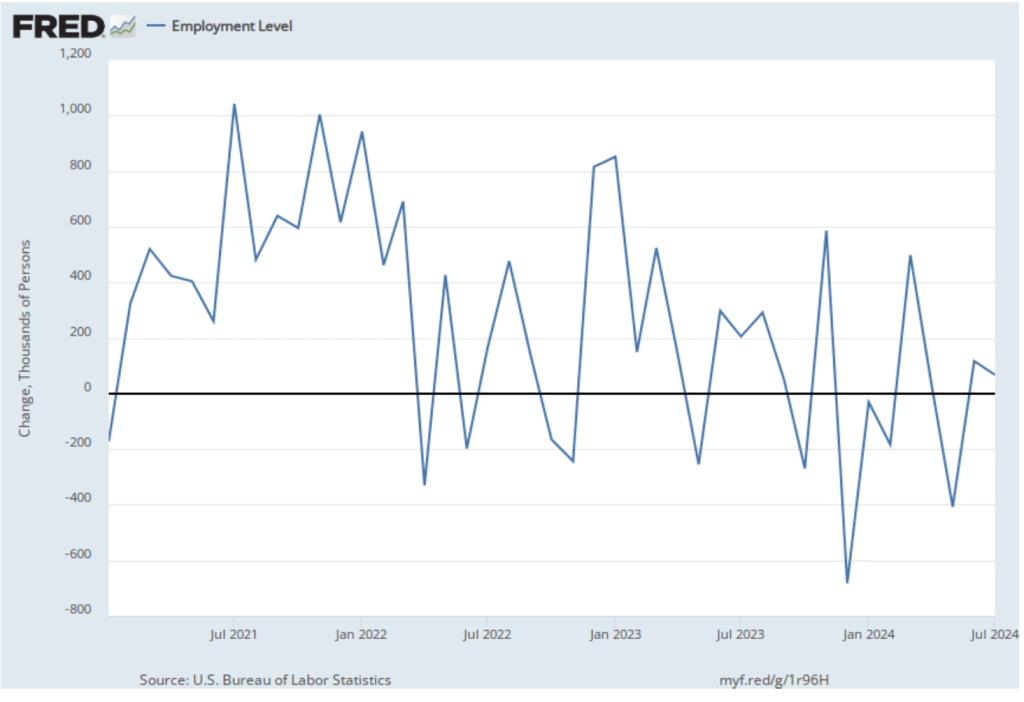
The monthly “Employment Situation” report from the Bureau of Labor Statistics (BLS) is closely watched by economists, investment analysts, and Federal Reserve policymakers. Many economists believe that the payroll employment data from the report is the best single indicator of the current state of the economy.
Most economists, inside and outside of the government, accept the dates determined by the Business Cycle Dating Committee of the National Bureau of Economic Research (NBER) for when a recession begins and ends. Although that committee takes into account a variety of macroeconomic data series, the peak of a business cycle as determined by the committee almost always corresponds to the peak in payroll employment and the trough of a business cycle almost always corresponds to the trough in payroll employment.
One drawback to relying too heavily on payroll employment data in gauging the state of the economy is that the data are subject to—sometimes substantial—revisions. As the BLS explains: “Monthly revisions result from additional reports received from businesses and government agencies since the last published estimates and from the recalculation of seasonal factors.” The revisions can be particularly large at the beginning of a recession.
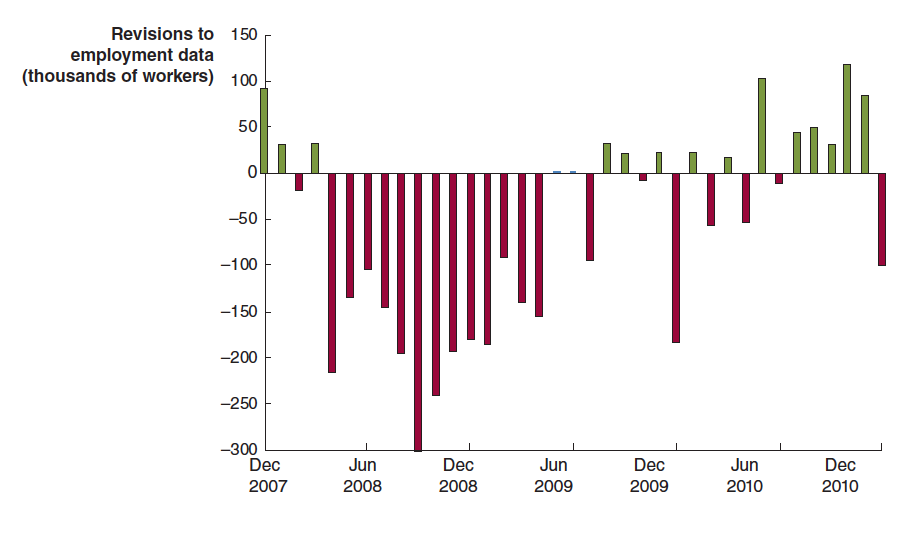
For example, the following figure shows revisions the BLS made to its initial estimates of the change in payroll employment during the months around the 2007–2009 recession. The green bars show months for which the BLS revised its preliminary estimates to show that fewer jobs were lost (or that more jobs were created), and the red bars show months for which the BLS revised its preliminary estimates to show that more jobs were lost (or that fewer jobs were created).
For example, the BLS initially reported that employment declined by 159,000 jobs during September 2008. In fact, after additional data became available, the BLS revised its estimate to show that employment had declined by 460,000 jobs during the month—a difference of 300,000 more jobs lost. As the recession deepened between April 2008 and April 2009, the BLS’s initial reports underestimated the number of jobs lost by 2.3 million. In other words, the recession of 2007–2009 turned out to be much more severe than economists and policymakers realized at the time.
The BLS also made substantial revisions to its initial estimates of payroll employment for 2020 and 2021 during the Covid pandemic, as the following figure shows. (Note that this figure appears in our new 9th edition of Macroeconomics, Chapter 9, Section 9.1 (Economics, Chapter 19, Section 19.1 and Essentials of Economics, Chapter 13, Section 13.1).)
The BLS initially estimated that employment in March 2020 declined by about 700,000. After gathering more data, the BLS revised its estimate to indicate that employment declined by twice as much. Similarly, the BLS’s initial estimates substantially understated the actual growth in employment from August to December 2021. After gathering more data, the BLS revised its estimate to indicate that nearly 2 million more jobs had been created during those months than it had originally estimated.
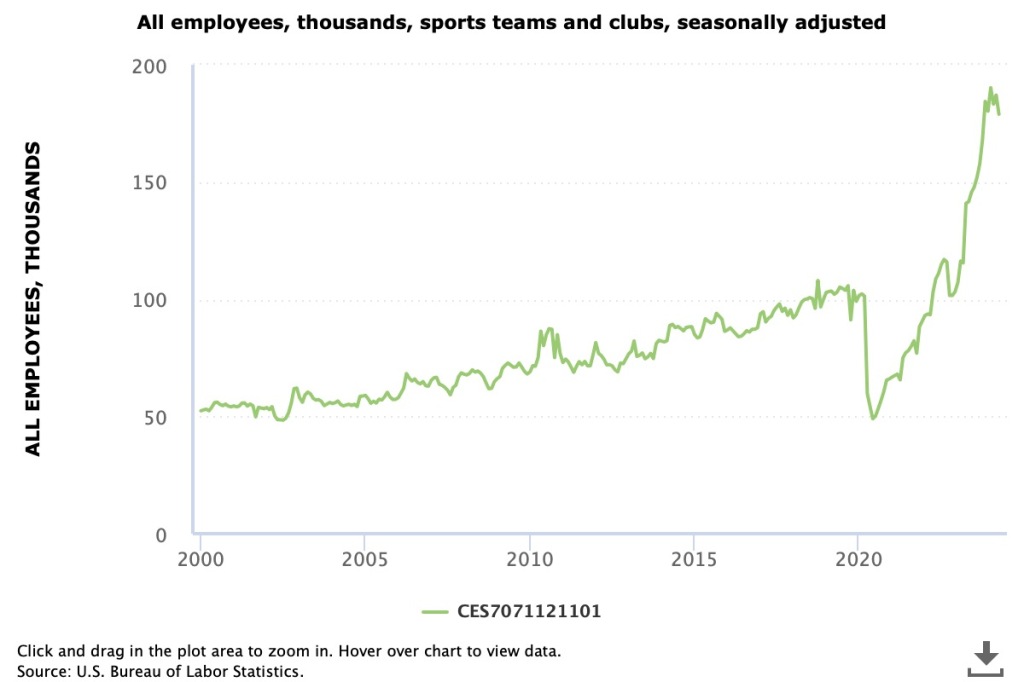
Just as the initial estimates for total payroll employment are often revised by sutbstantial amounts up or down, the same is true of the initial estimates of payroll employment in individual industries. Because the number of establishments surveyed in any particular industry can be small, the initial estimates can be highly inaccurate. For instance, Justin Fox, a columnist for bloomberg.com recently noted what appears to be a surge in employment in the “sports teams and clubs” industry. As the following figure shows, employment in this industry seems to have increased by an improbably large 75 percent. Was there a sudden increase in the United States in the number of new sports teams? Certainly not over just a few months. It’s more likely that most of the increase in employment in this industry will disappear when the initial employment estimates are revised.
One source of data for the BLS revisions to the monthly payroll employment data is the BLS’s “Quarterly Census of Employment and Wages.” The QCEW is based on the reports required of all firms that participate in the state and federal unemployment insurance program. The BLS estimates that 95 percent of all jobs in the United States are included in the QCEW data. As a result, the QCEW surveys about 11.9 million establishments as opposed to the 666,000 establishments included in the establishment survey.
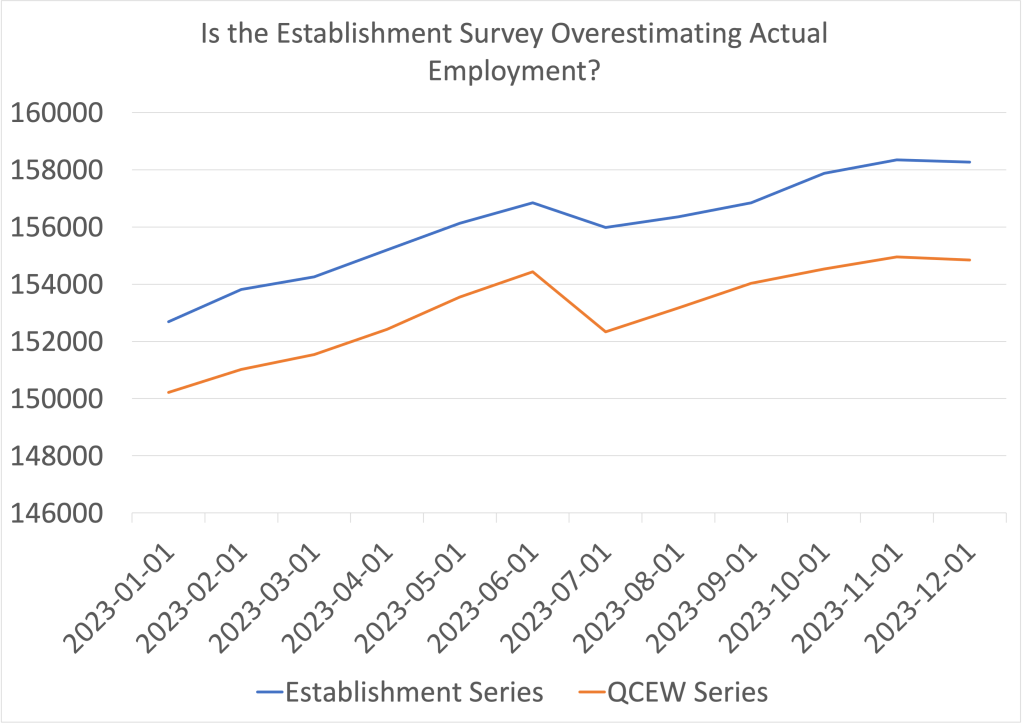
The BLS uses the QCEW to benchmark the payroll employment data, which reconciles the two series. The BLS makes the revisions with a lag. For instance, the payroll employment data for 2023 won’t be revised using the QCEW data until August 2024. Looking at the 2023 employment data from the two series shows a large discrepancy, as seen in the following figure.
The blue line shows the employment data from the establishment survey and the orange line shows the data from the QCEW survey. (Both series are of nonseasonally adjusted data.) The values on the vertical axis are thousands of workers. In December 2023, the establishment survey indicated that a total of 158,347,000 people were employed in the nonfarm sector in the United States. The QCEW series shows a total of 154,956,133 people were employed in the nonfarm sector—about 3.4 million fewer.
How can we interpret the discrepancy between the employment totals from the two series? The most straightforward interpretation is that the QCEW data, which uses a larger sample, is more accurate and payroll employment has been significantly overstating the level of employment in the U.S. economy. In other words, the labor market was weaker in 2023 than it seemed, which may help to explain why inflation slowed as much as it did, particularly in the second half of the year.
However, this interpretation is not clear cut because the QCEW data are also subject to revision. As Ernie Tedeschi, director of economics at the Budget Lab at Yale and former chief economist for the Council of Economic Advisers, has pointed out, the QCEW data are typically revised upwards, which would close some of the gap between the two series. So, although it seems likely that the closely watched payroll employment data have overstated the strength of the labor market, we won’t get a clearer indication of how large the overstatement is until August when the BLS will use the QCEW data to benchmark the payroll employment data.
Image of “a small business with a help wanted sign in the window” generated by ChatGTP 4o.
This morning (June 4), the Bureau of Labor Statistics (BLS) released its “Job Openings and Labor Turnover” (JOLTS) report for April 2024. The report proivided more data indicating that the U.S. labor market is continuing its return to pre-pandemic conditions. The following figure shows that, at 4.8 percent, the rate of job openings has continued its slow decline from the rate of 7.4 percent in March 2022. The rate in April was the same as the rate in January 2019, although it was till above the rates during most of 2019 and early 2020, as well as the rates during most of the period following the Great Recession of 2007–2009.
The BLS defines a job opening as a full-time or part-time job that a firm is advertising and that will start within 30 days. The rate of job openings is the number of job openings divided by the number of job openings plus the number of employed workers, multiplied by 100.
In the following figure, we compare the total number of job openings to the total number of people unemployed. The figure shows a slow decline from a peak of more than 2 job openings per unemployed person in the spring of 2022 to 1.2 job openings per employed person in April 2024—about the same as in 2019 and early 2020, before the pandemic. Note that the number is still above 1.0, indicating that the demand for labor is still high, although no higher than during the strong labor market of 2019.
The rate at which workers are willing to quit their jobs is an indication of how they perceive the ease of finding a new job. As the following figure shows, the quit rate declined slowly from a peak of 3 percent in late 2021 and early 2022 to 2.2 percent in November 2023, where it has remained through April of 2024. That rate is slightly below the rate during 2019 and early 2020. By this measure, workers perceptions of the state of the labor market seem largely unchanged in recent months.
The JOLTS data indicate that the labor market is about as strong as it was in the months priod to the start of the pandemic, but it’s not as historically tight as it was through most of 2022 and 2023.
On Friday morning, the BLS will release its “Employment Situation” report for May, which will provide additional data on the state of the labor market. (Note that the data in the JOLTS report lag the data in the “Employment Situation” report by one month.)
This morning (May 3), the Bureau of Labor Statistics (BLS) released its “Employment Situation” report for April. The report has two estimates of the change in employment during the month: one estimate from the establishment survey, often referred to as the payroll survey, and one from the household survey. As we discuss in Macroeconomics, Chapter 9, Section 9.1 (Economics, Chapter 19, Section 19.1), many economists and policymakers at the Federal Reserve believe that employment data from the establishment survey provides a more accurate indicator of the state of the labor market than do either the employment data or the unemployment data from the household survey. (The groups included in the employment estimates from the two surveys are somewhat different, as we discuss in this post.)
According to the establishment survey, there was a net increase of 175,000 jobs during April. This increase was well below the increase of 240,000 that economists had forecast in a survey by the Wall Street Journal and well below the net increase of 315,000 during March. The following figure, taken from the BLS report, shows the monthly net changes in employment for each month during the past to years.
As the following figure shows, the net change in jobs from the household survey moves much more erratically than does the net change in jobs in the establishment survey. The net increase in jobs as measured by the household survey fell from 498,000 in March to 25,000 in April.
The unemployment rate, which is also reported in the household survey, ticked up slightly from 3.8 percent to 3.9 percent. It has been below 4 percent every month since February 2022.
The establishment survey also includes data on average hourly earnings (AHE). As we note in this recent post, many economists and policymakers believe the employment cost index (ECI) is a better measure of wage pressures in the economy than is the AHE. The AHE does have the important advantage that it is available monthly, whereas the ECI is only available quarterly. The following figure show the percentage change in the AHE from the same month in the previous year. The 3.9 percent value for April continues a downward trend that began in February.
The following figure shows wage inflation calculated by compounding the current month’s rate over an entire year. (The figure above shows what is sometimes called 12-month wage inflation, whereas this figure shows 1-month wage inflation.) One-month wage inflation is much more volatile than 12-month inflation—note the very large swings in 1-month wage inflation in April and May 2020 during the business closures caused by the Covid pandemic.
The 1-month rate of wage inflation of 2.4 percent in April is a significant decrease from the 4.2 percent rate in March, although it’s unclear whether the decline was a sign that the labor market is weakening or reflected the greater volatility in wage inflation when calculated this way.
The macrodata released during the first three months of the year had, by and large, indicated strong economic growth, with the pace of employment increases being particularly rapid. Wages were also increasing at a pace above that during the pre-Covid period. Inflation appeared to be stuck in the range of 3 percent to 3.5 percent, above the Fed’s target inflation rate of 2 percent.
Today’s “Employment Situation” report may be a first indication that growth is slowing sufficiently to allow the inflation rate to fall back to 2 percent. This is the outcome that Fed Chair Jerome Powell indicated in his press conference on Wednesday that he expected to occur at some point during 2024. Financial markets reacted favorably to the release of the report with stock prices jumping and the interest rate on the 10-year Treasury note falling. Many economists and Wall Street analysts had concluded that the Fed’s policy-making Federal Open Market Committee (FOMC) was likely to keep its target for the federal funds rate unchanged until late in the year and might not institute a cut in the target at all this year. Today’s report caused some Wall Street analysts to conclude, as the headline of an article in the Wall Street Journal put it, “Jobs Data Boost Hopes of a Late-Summer Rate Cut.”
This reaction may be premature. Data on employment from the establishment survey can be subject to very large revisions, which reinforces the general caution against putting too great a weight one month’s data. Its most likely that the FOMC would need to see several months of data indicating a slowing in economic growth and in the inflation rate before reconsidering whether to cut the target for the federal funds rate earlier than had been expected.
On Friday, April 5—the first Friday of the month—the Bureau of labor Statistics (BLS) released its “Employment Situation” report with data on the state of the labor market in March. The BLS reported a net increase in employment during March of 303,000, which was well above the increase that economists had been expecting. The previous estimates of employment in January and February were revised upward by 22,000 jobs. (We also discuss the employment report in this podcast.)
Employment increases during the second half of 2023 had slowed compared with the first half of the year. But, as the following figure from the BLS report shows, since December 2023, employment has increased by more than 250,000 in each month. These increases are far above the estimated increases of 70,000 to 100,000 new jobs needed to keep up with population growth. (But note our later discussion of this point.)
The unemployment rate had been expected to stay steady at 3.9 percent, but declined slightly to 3.8 percent. As the following figure shows, the unemployment rate has been remarkably stable for more than two years and has been below 4.0 percent each month since December 2021. The members of the Federal Open Market Committee (FOMC) expect that the unemployment rate for 2024 will be 4.0 percent, a forcast that is beginning to seem too high.
The monthly employment number most commonly reported in media accounts is from the establishment survey (sometimes referred to as the payroll survey), whereas the unemployment rate is taken from the household survey. The results of both surveys are included in the BLS’s monthly “Employment Situation” report. As we discuss in Macroeconomics, Chapter 9, Section 9.1 (Economics, Chapter 19, Section 19.1), many economists and policymakers at the Federal Reserve believe that employment data from the establishment survey provides a more accurate indicator of the state of the labor market than do either the employment data or the unemployment data from the household survey.
As we noted in a previous post, whereas employment as measured by the establishment survey has been increasing each month, employment as measured by the household surve declined each month from December 2023 through February 2024. But, as the following figure shows, this trend was reversed in March, with employment as measured by the household survey increasing 498,000—far more than the 303,000 increase in employment in establishment survey. This reversal may be another indication of the underlying strength of the labor market.
As the following figure shows, despite the substantial increases in employment, wages, as measured by the percentage change in average hourly earnings from the same month in the previous year, have been trending down. The increase in average hourly earnings declined from 4.3 percent February in to 4.1 percent in March.
The following figure shows wage inflation calculated by compounding the current month’s rate over an entire year. (The figure above shows what is sometimes called 12-month wage inflation, whereas this figure shows 1-month wage inflation.) One-month wage inflation is much more volatile than 12-month inflation—note the very large swings in 1-month wage inflation in April and May 2020 during the business closures caused by the Covid pandemic.
Wages increased by 6.1 percent in January 2024, 2.1 percent in February, and 4.2 percent in March. So, the 1-month rate of wage inflation did show an increase in March, although it’s unclear whether the increase was a result of the strength of the labor market or reflected the greater volatility in wage inflation when calculated this way.
Some economists and policymakers are surprised that low levels of unemployment and large monthly increases in employment have not resulted in greater upward pressure on wages. One possibility is that the supply of labor has been increasing more rapidly than is indicated by census data. In a January report, the Congressional Budget Office (CBO) argued that the Census Bureau’s estimate of the population of the United States is too low by about 6 million people. This undercount is attributable, according to the CBO, largely the Census Bureau having underestimated the amount of immigration that has occurred. If the CBO is correct, then the economy may need to generate about 200,000 net new jobs each month to accommodate the growth of the labor force, rather than the 80,000 to 100,000 we mentioned earlier in this post.
Federal Reserve Chair Jerome Powell noted in a press conference following the most recent meeing of the FOMC that: “Strong job creation has been accompanied by an increase in the supply of workers, reflecting increases in participation among individuals aged 25 to 54 years and a continued strong pace of immigration.” As a result:
“what you would have is potentially kind of what you had last year, which is a bigger economy where inflationary pressures are not increasing. In fact, they were decreasing. So you can have that if you have a continued supply-side activity that we had last year with—both with supply chains and also with, with growth in the size of the labor force.”
If Powell is correct, in the coming months the U.S. economy may be able to sustain rapid increases in employment without those increases leading to an increase in the rate of inflation.