Photo courtesy of Lena Buonanno.
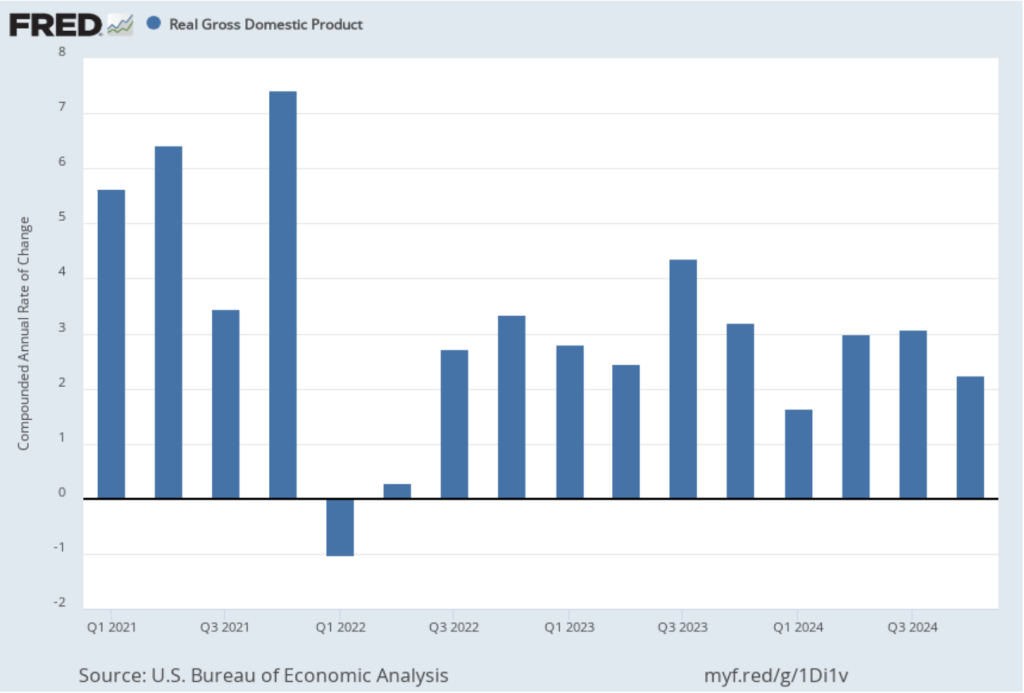
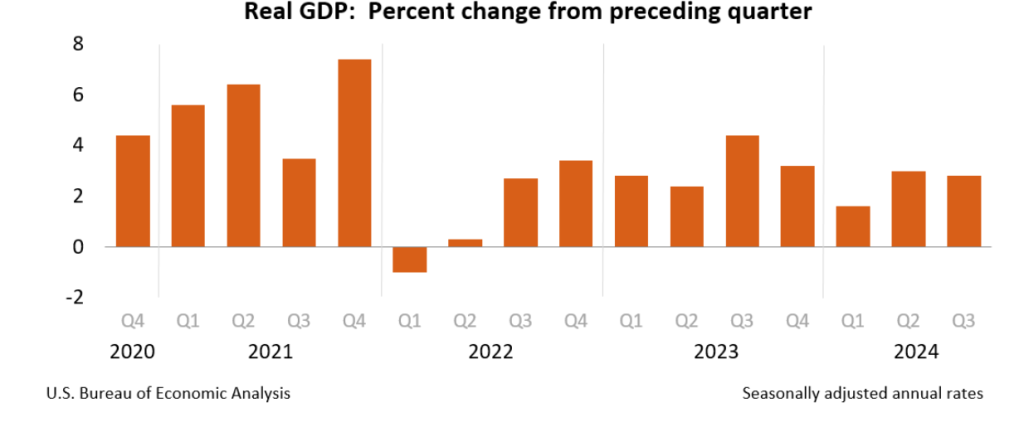
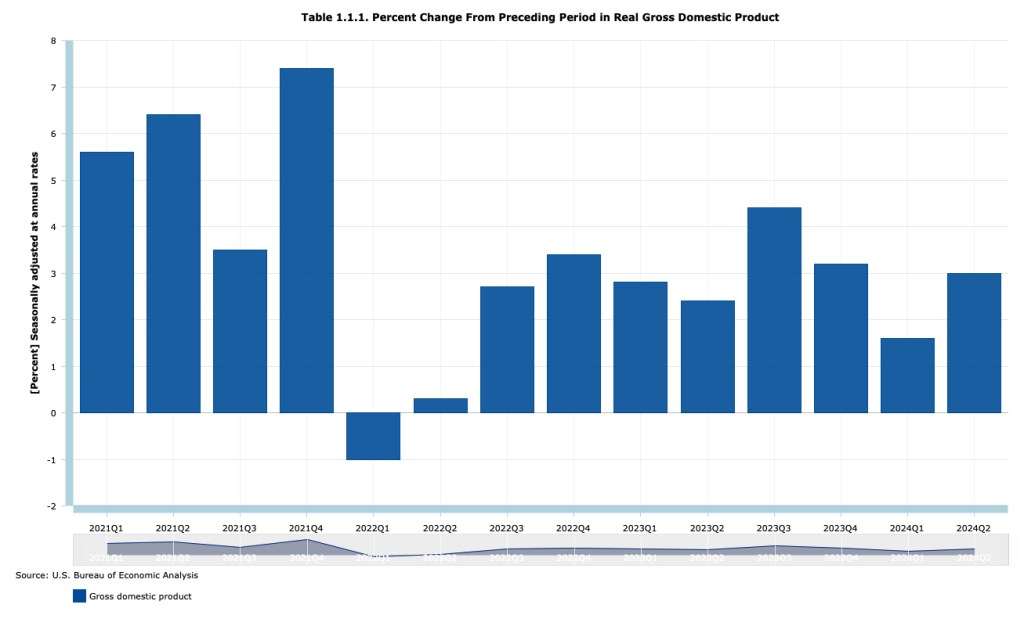
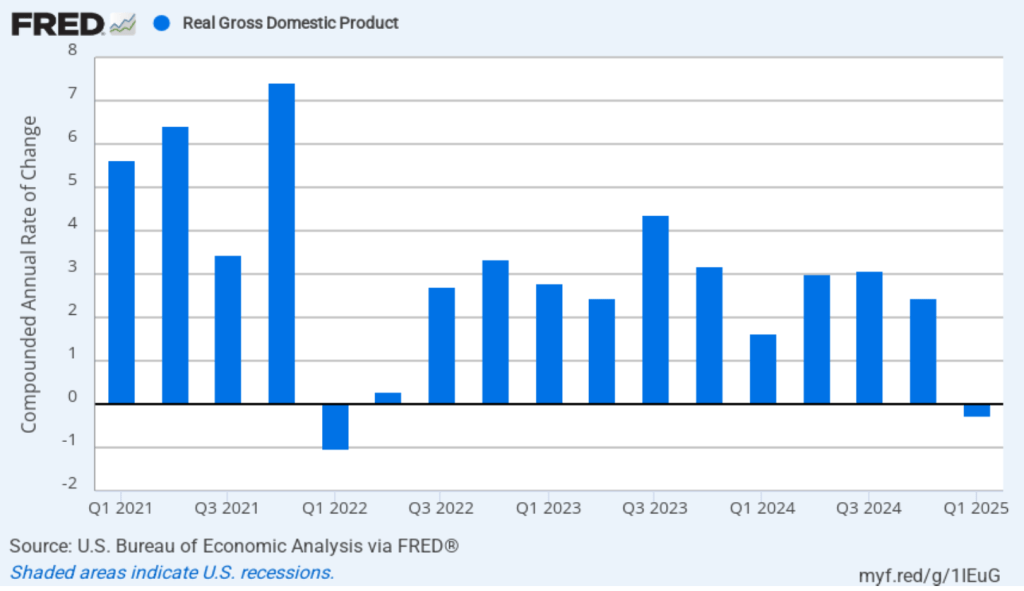
This morning (April 30), the Bureau of Economic Analysis (BEA) released its advance estimate of GDP for the first quarter of 2025. (The report can be found here.) The BEA estimates that real GDP fell by 0.3 percent, measured at an annual rate, in the first quarter—January through March. Economists surveyed had expected an 0.8 percent increase. Real GDP grew by an estimated 2.5 percent in the fourth quarter of 2024. The following figure shows the estimated rates of GDP growth in each quarter beginning in 2021.
As the following figure—taken from the BEA report—shows, the increase in imports was the most important factor contributing to the decline in real GDP. The quarter ended before the Trump Administration announced large tariff increases on April 2, but the increase in imports is likely attributable to firms attempting to beat the tariff increases they expected were coming.
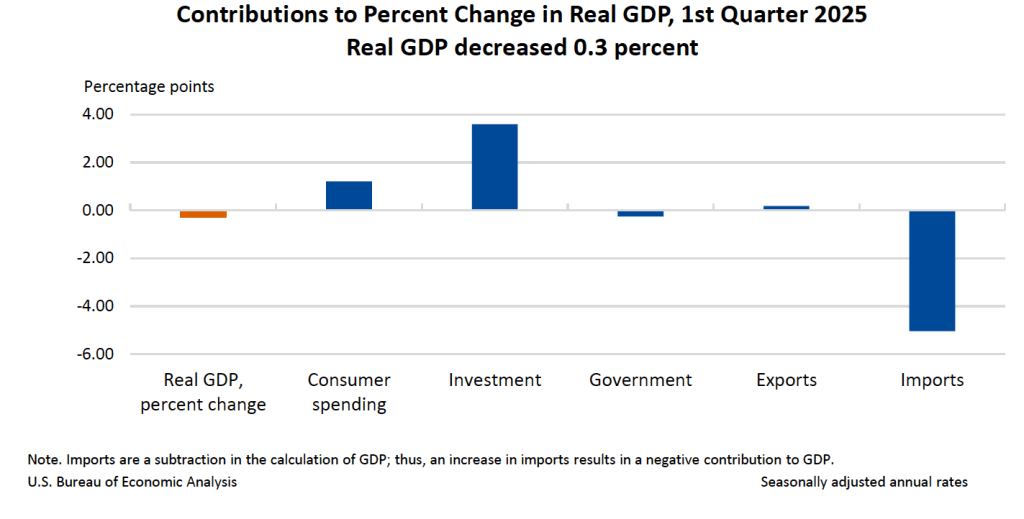
It’s notable that the change in real private inventories was a large $140 billion, which contributed 2.3 percentage points to the change in real GDP. Again, it’s likely that the large increase in inventories represented firms stockpiling goods in anticipation of the tariff increases.
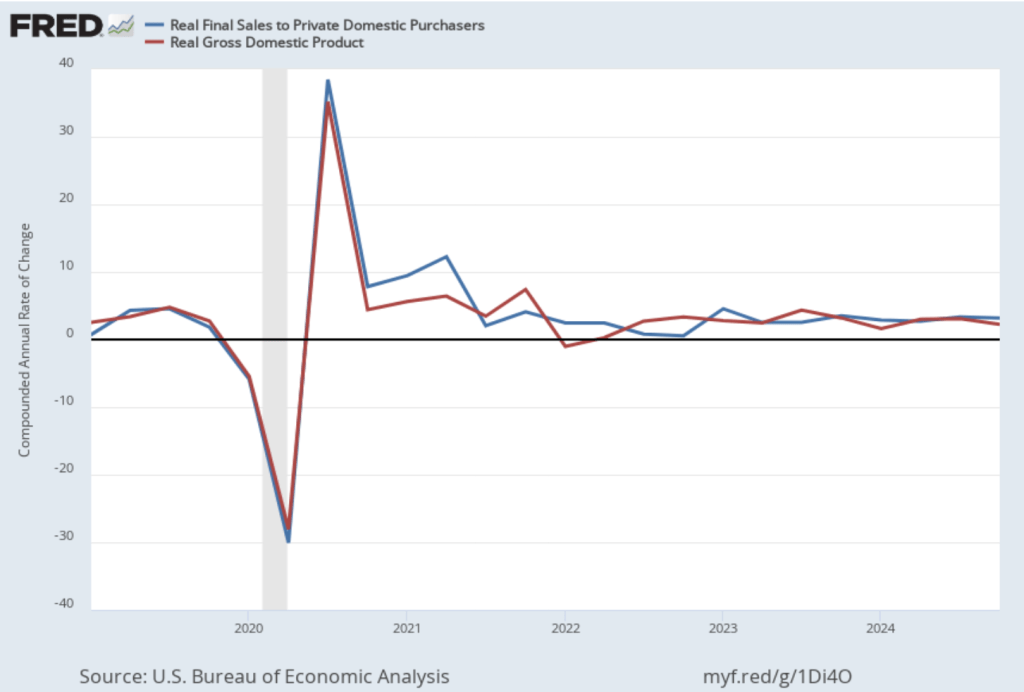
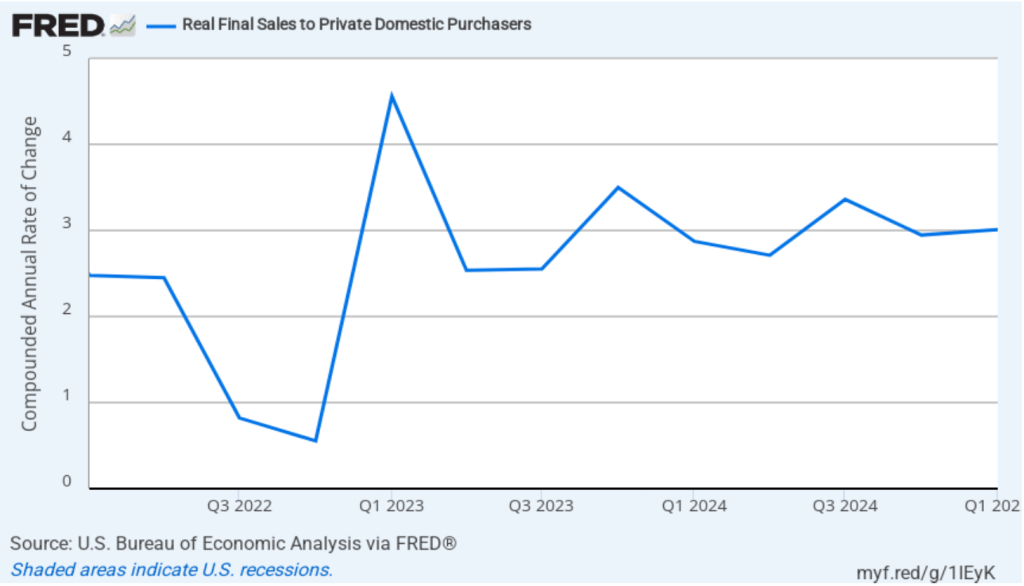
One way to strip out the effects of imports, inventory investment, and government purchases—which can also be volatile—is to look at real final sales to domestic purchasers, which includes only spending by U.S. households and firms on domestic production. As the following figure shows, real final sales to domestic purchasers increase by 3.0 percent in the first quarter of 2024, which was a slight increase from the 2.9 percent increase in the fourth quarter of 2024. The large difference between the change in real GDP and the change in real final sales to domestic purchasers is an indication of how strongly this quarter’s national income data were affected by businesses anticipating the tariff increases.
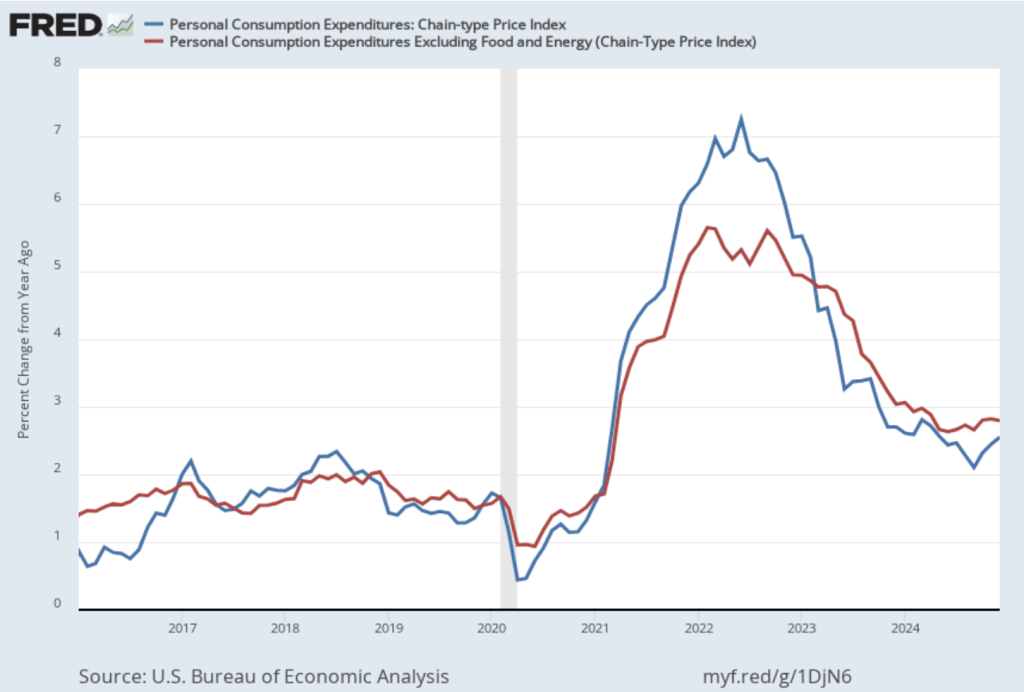
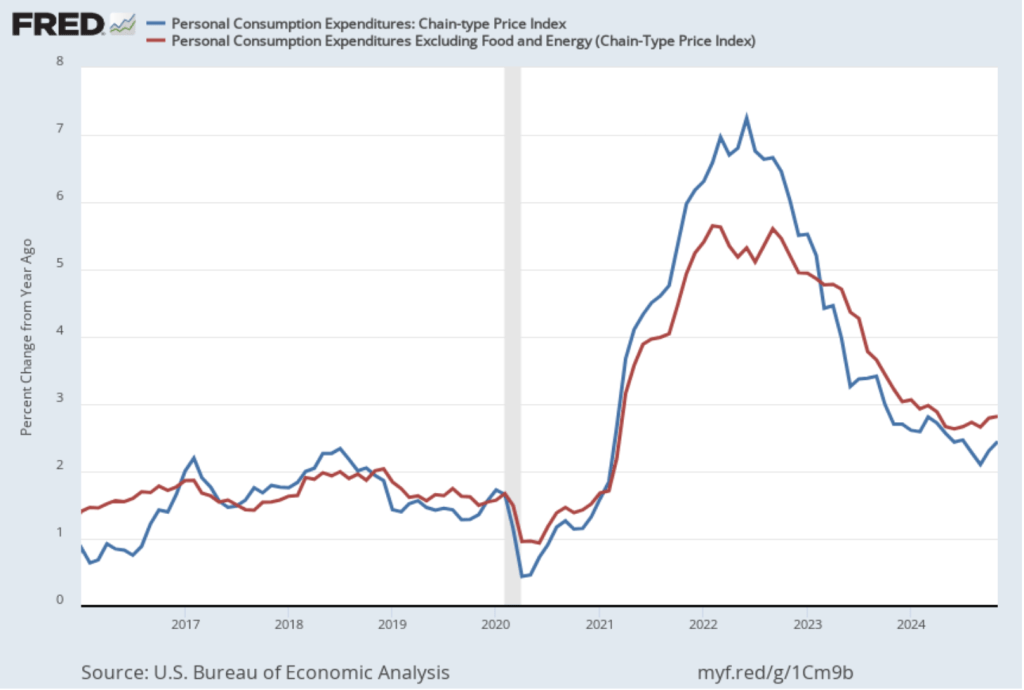
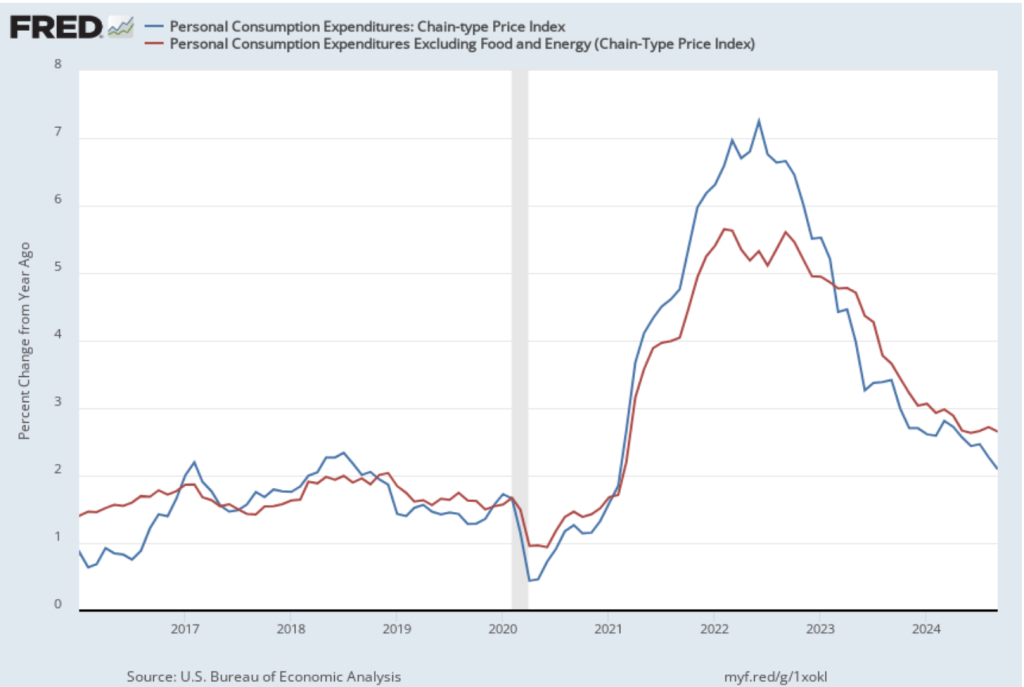
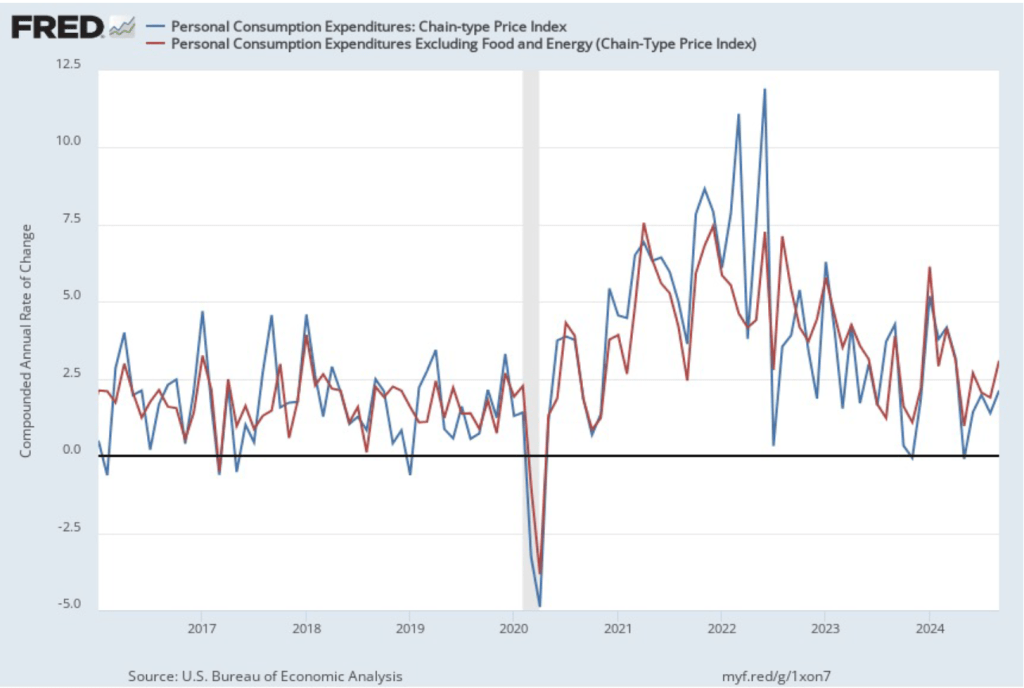
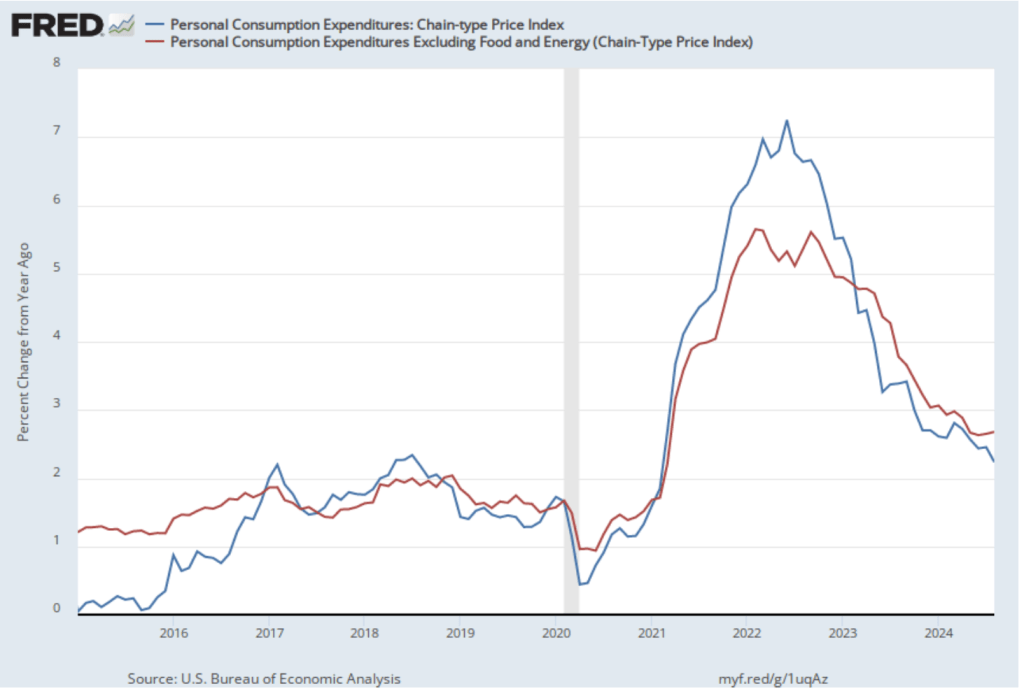
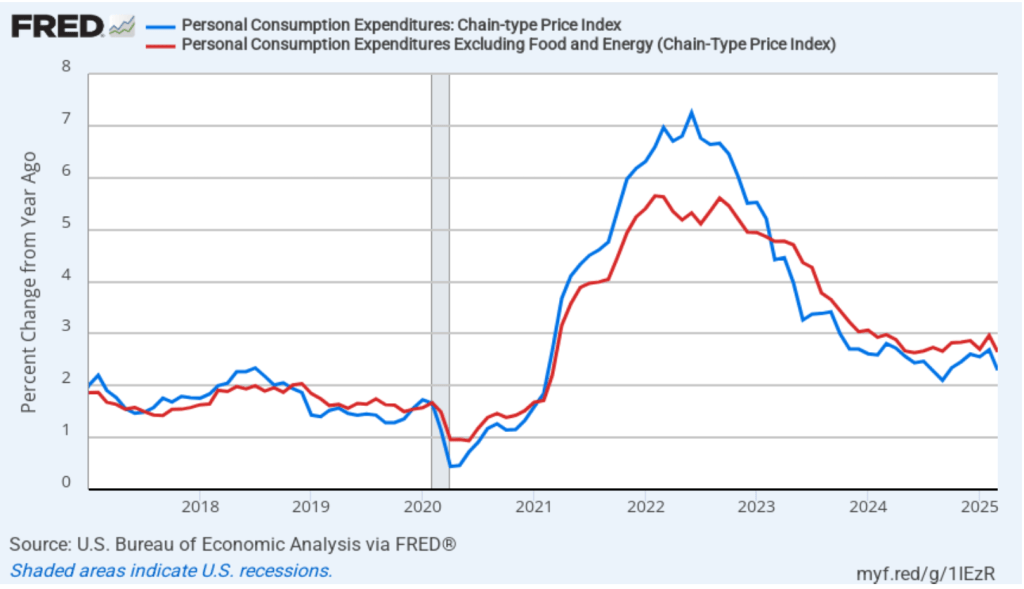
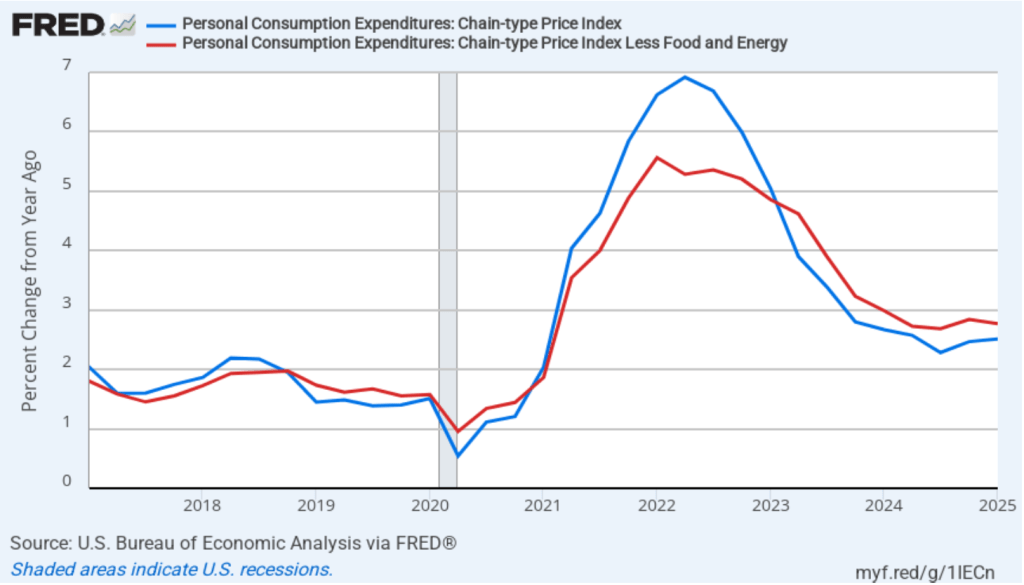
In the separate “Personal Income and Outlays” report that the BEA also released this morning, the bureau reported monthly data on the personal consumption expenditures (PCE) price index. The Fed relies on annual changes in the PCE price index to evaluate whether it’s meeting its 2 percent annual inflation target. The following figure shows PCE inflation (the blue line) and core PCE inflation (the red line)—which excludes energy and food prices—for the period since January 2017 with inflation measured as the percentage change in the PCE from the same month in the previous year. In March, PCE inflation was 2.3 percent, down from 2.7 percent in February. Core PCE inflation in March was 2.6 percent, down from 3.0 percent in February. Both headline and core PCE inflation were higher than the forecasts of economists surveyed.
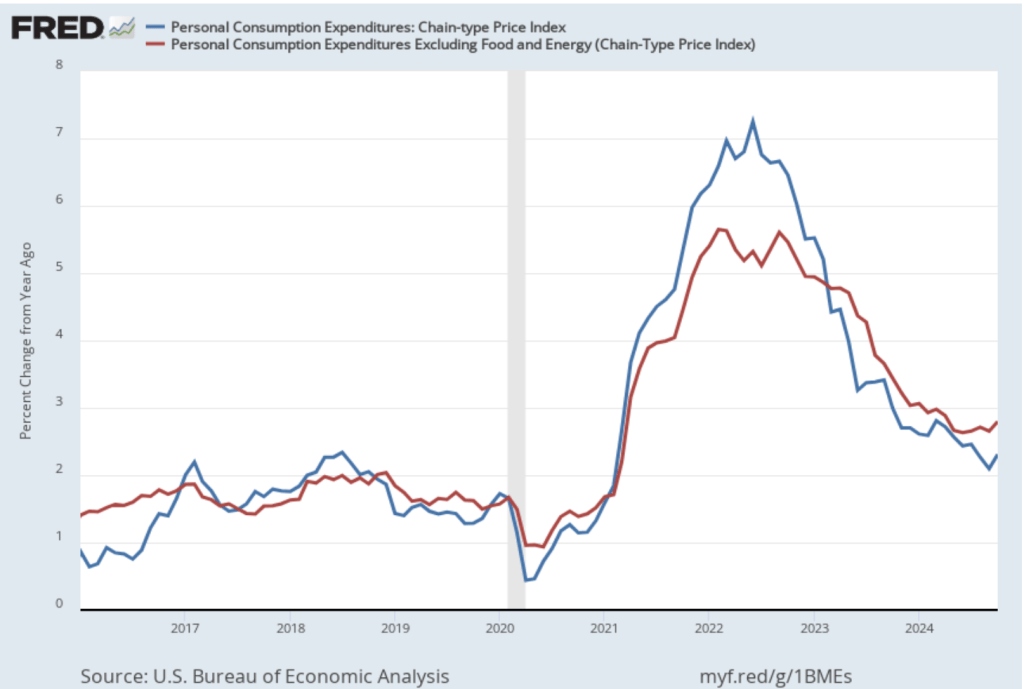
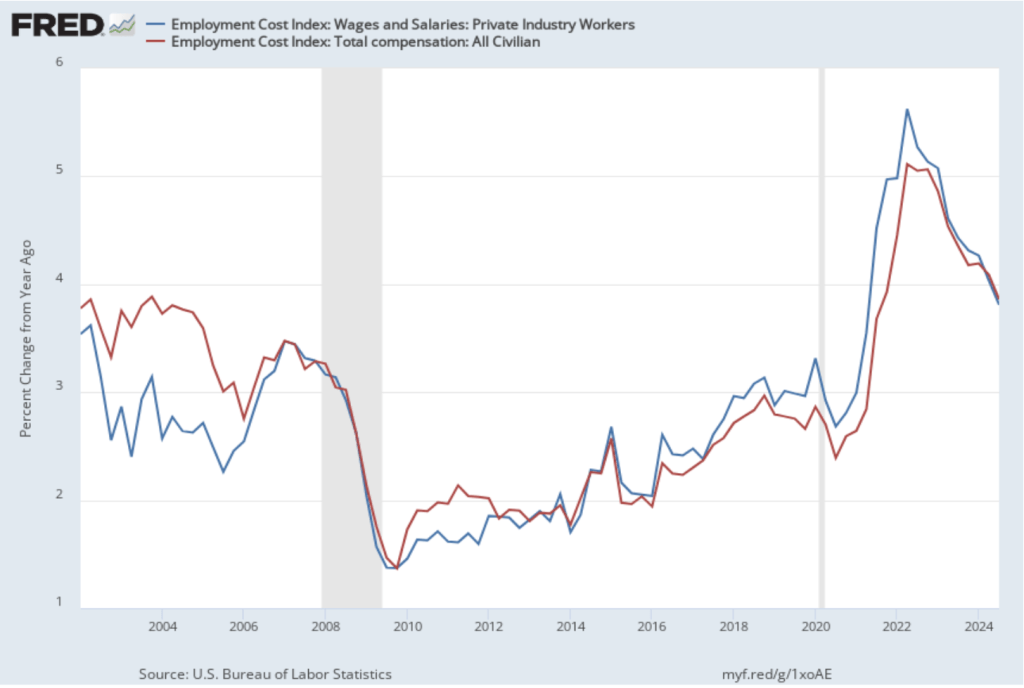
The BEA also released quarterly PCE data as part of its GDP report. The following figure shows quarterly headline PCE inflation (the blue line) and core PCE inflation (the red line). Inflation is calculated as the percentage change from the same quarter in the previous year. Headline PCE inflation in the first quarter was 2.5 percent, unchanged from the fourth quarter of 2025. Core PCE inflation was 2.8 percent, also unchanged from the fourth quarter of 2025. Both measures were still above the Fed’s 2 percent inflation target.
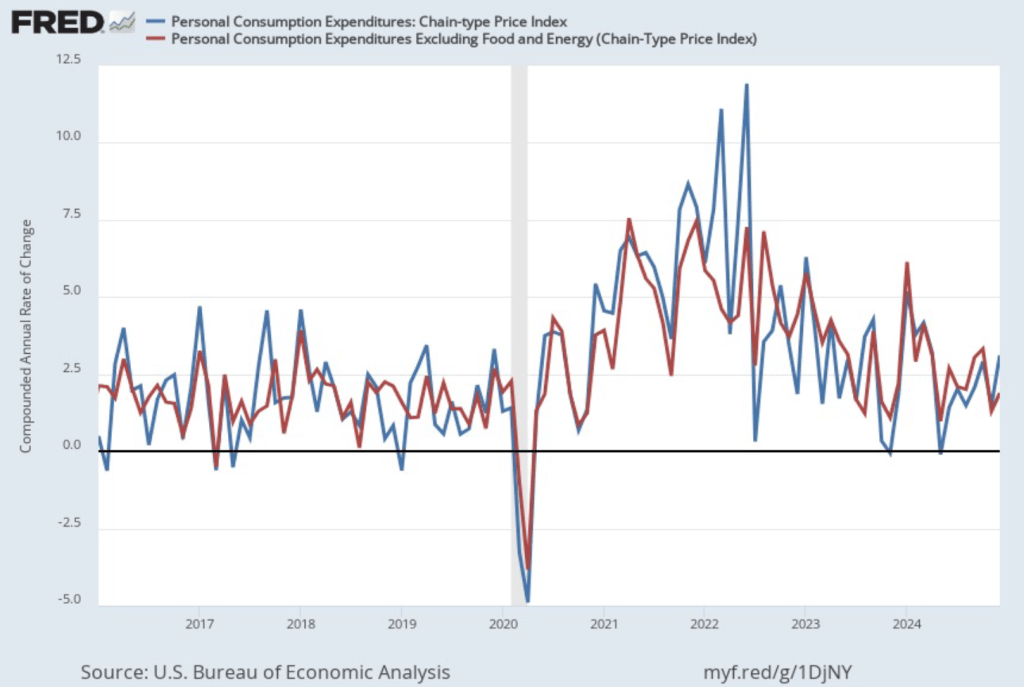
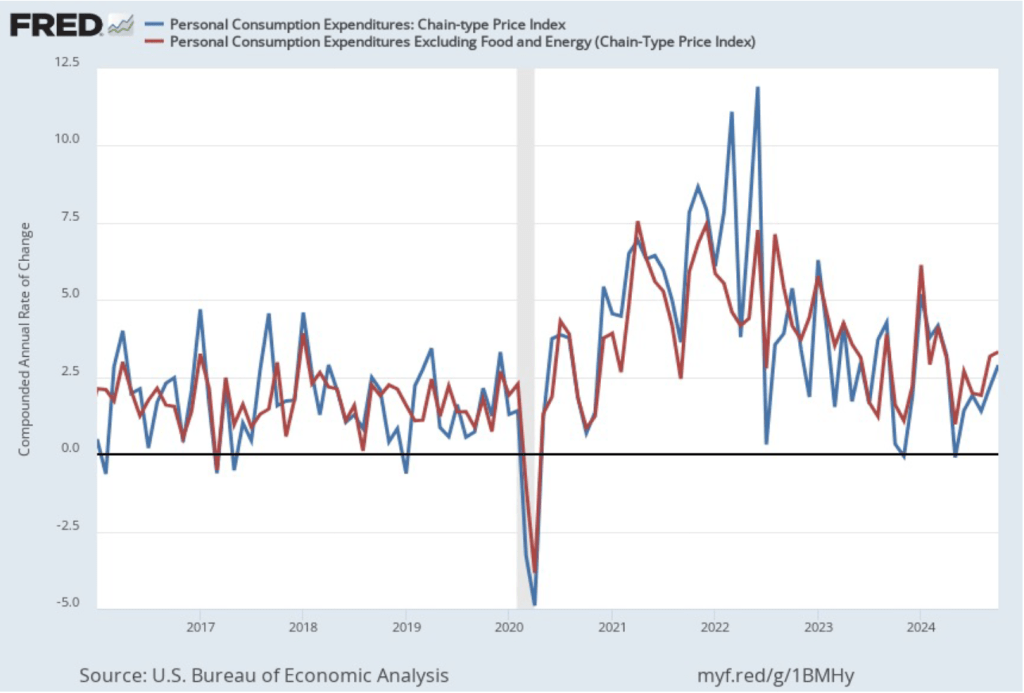
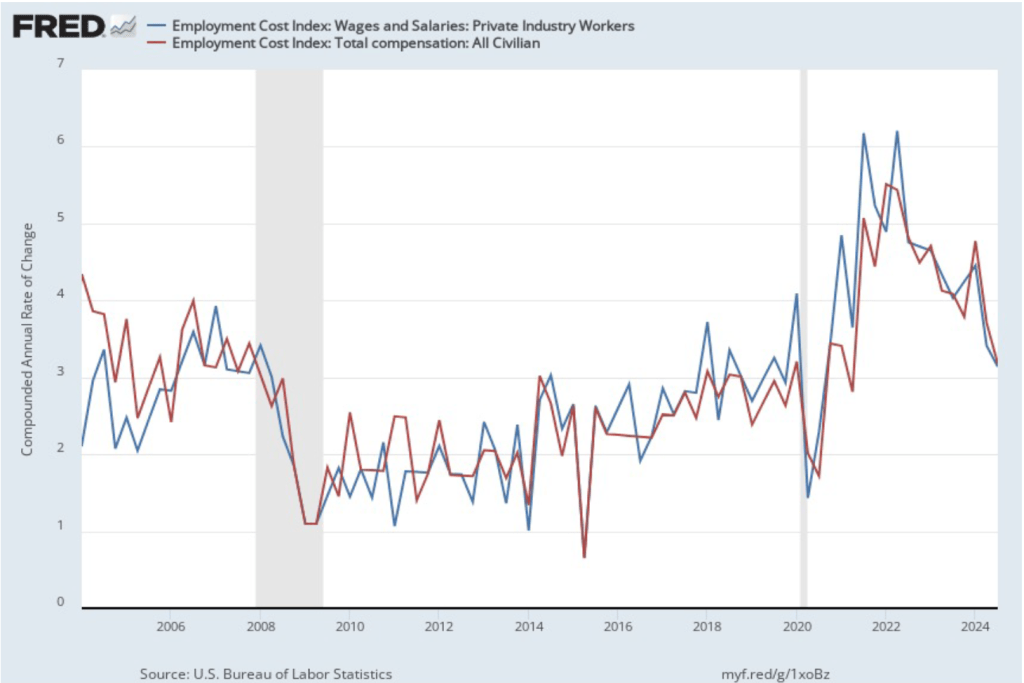
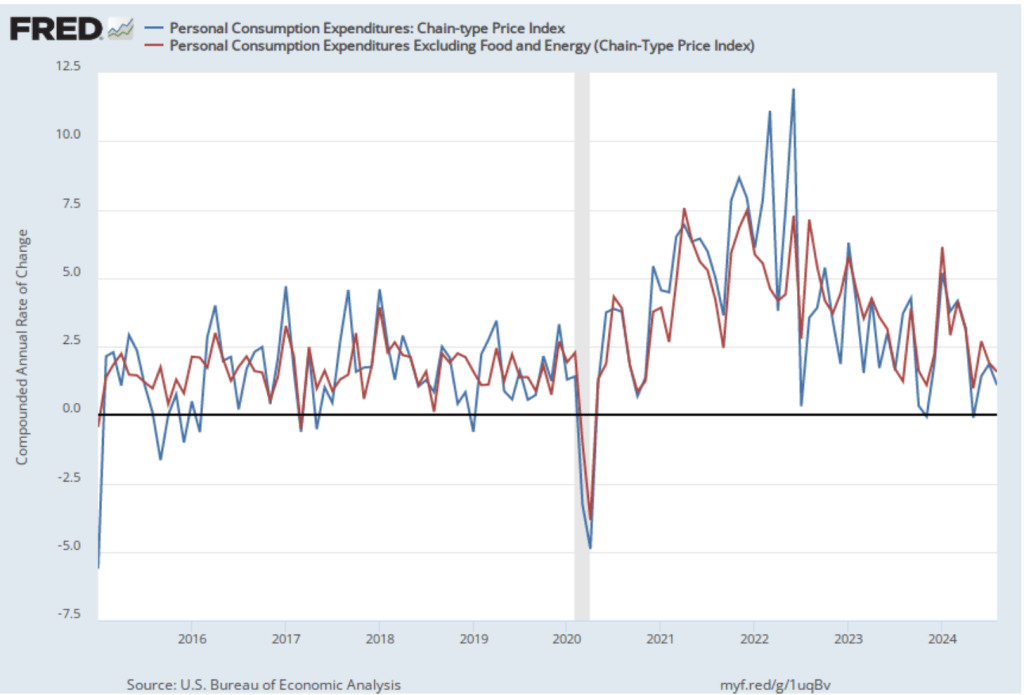
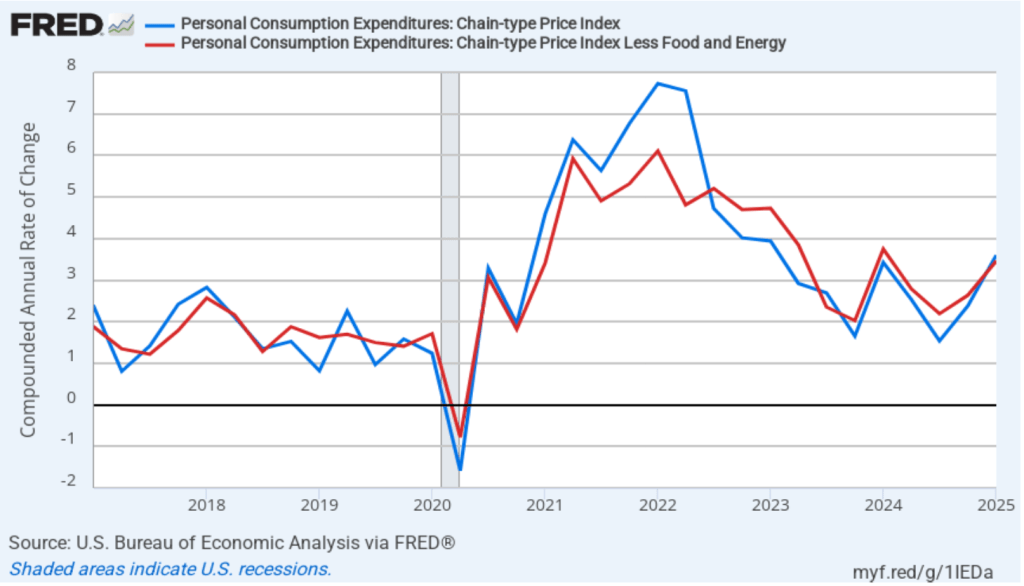
The following figure shows quarterly PCE inflation and quarterly core PCE inflation calculated by compounding the current quarter’s rate over an entire year. Measured this way, headline PCE inflation increased from 2.4 percent in the fourth quarter of 2024 to 3.6 percent in the first quarter of 2025. Core PCE inflation increased from 2.6 percent in the fourth quarter of 2024 to 3.5 percent in the first quarter of 2025. Clearly, the quarterly data show significantly higher inflation than do the monthly data. As we discuss in this blog post, tariff increases result in an aggregate supply shock to the economy. As a result, unless the current and scheduled tariff increases are reversed, we will likely see a significant increase in inflation in the coming months. So, neither the monthly nor the quarterly PCE data may be giving a good indication of the course of future inflation.
What should we make of today’s macro data releases? First, it’s important to remember that these data will be subject to revisions in coming months. If we are heading into a recession, the revisions may well be very large. Second, we are sailing into unknown waters because the U.S. economy hasn’t experienced tariff increases as large as these since passage of the Smoot-Hawley Tariff in 1930. Third, at this point we don’t know whether some, most, all, or none of the tariff increases will be reversed as a result of negotiations during the coming weeks. Finally, on Friday, the Bureau of Labor Statistics will release its “Employment Situation Report” for March. That report will provide some additional insight into the state of the economy—as least as it was in March before the full effects of the tariffs have been felt.