Senator Elizabeth Warren vs. Economist Lawrence Summers on Monetary Policy

Senator Elizabeth Warren (Photo from the Associated Press)

Lawrence Summers (Photo from harvardmagazine.com)

As we’ve discussed in several previous blog posts, in early 2021 Lawrence Summers, professor of economics at Harvard and secretary of the treasury in the Clinton administration, argued that the Biden administration’s $1.9 trillion American Rescue Plan, enacted in March, was likely to cause a sharp acceleration in inflation. When inflation began to rapidly increase, Summers urged the Federal Reserve to raise its target for the federal funds rate in order to slow the increase in aggregate demand, but the Fed was slow to do so. Some members of the Federal Open Market Committee (FOMC) argued that much of the inflation during 2021 was transitory in that it had been caused by lingering supply chain problems initially caused by the Covid–19 pandemic. 

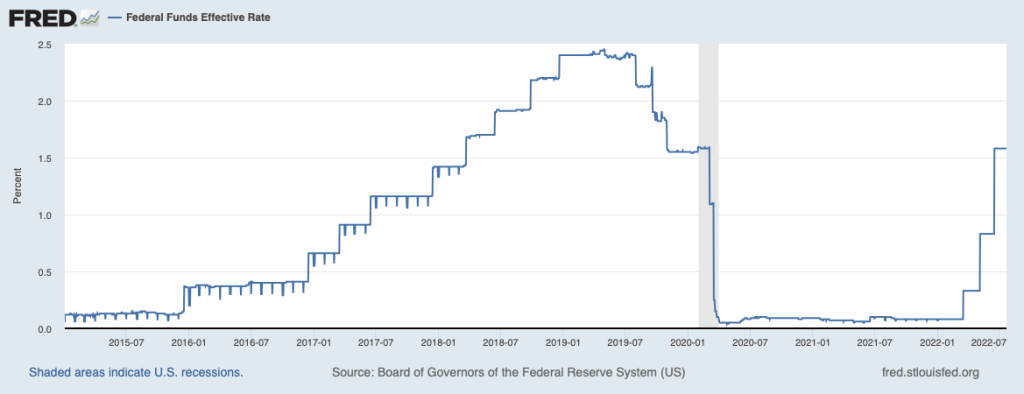
At the beginning of 2022, most members of the FOMC became convinced that in fact increases in aggregate demand were playing an important role in causing high inflation rates.  Accordingly, the FOMC began increasing its target for the federal funds rate in March 2022. After two more rate increases, on the eve of the FOMC’s meeting on July 26–27, the federal funds rate target was a range of 1.50 percent to 1.75 percent. The FOMC was expected to raise its target by at least 0.75 percent at the meeting. The following figure shows movements in the effective federal funds rate—which can differ somewhat from the target rate—from January 1, 2015 to July 21, 2022.

In an opinion column in the Wall Street Journal, Massachusetts Senator Elizabeth Warren argued that the FOMC was making a mistake by increasing its target for the federal funds rate. She also criticized Summers for supporting the increases. Warren worried that the rate increases were likely to cause a recession and argued that Congress and President Biden should adopt alternative measures to contain inflation. Warren argued that a better approach to dealing with inflation would be to, among other steps, increase the federal government’s support for child care to enable more parents to work, provide support for strengthening supply chains, and lower prescription drug prices by allowing Medicare to negotiate the prices with pharmaceutical firms. She also urged a “crack down on price gouging by large corporations.” (We discussed the argument that monopoly power is responsible for inflation in this blog post.)

 Summers responded to Warren in a Twitter thread. He noted that: “In the 18 months since the massive stimulus policies & easy money that [Senator Warren] has favored & I have opposed, the inflation rate has risen from below 2 to above 9 percent & workers purchasing power has, as a consequence, declined more rapidly than in any year in the last 50.” And “[Senator Warren] opposes restrictive monetary policy or any other measure to cool off total demand.  Why does she think at a time when there are twice as many vacancies as jobs that inflation will come down without some drop in total demand?”

Clearly, economists and policymakers continue to hotly debate monetary policy.

Source: Elizabeth Warren, “Jerome Powell’s Fed Pursues a Painful and Ineffective Inflation Cure,” Wall Street Journal, July 24, 2022.

The Effect of the Covid-19 Pandemic on Income Inequality

During 2020, Congress and President Donald Trump responded to the Covid-19 pandemic with very aggressive fiscal policy initiatives. First, in March 2020, Congress enacted the Coronavirus Aid, Relief, and Economic Security (CARES) Act. The CARES Act increased the federal government’s expenditures by $1.9 trillion. Then, in December 2020, in response to the continuing effects of the pandemic, Congress and President Trump included an additional $915 billion in expenditures related to Covid-19 in the Consolidated Appropriations Act.  These two fiscal policy actions included payments directly to households and supplemental unemployment insurance payments. Higher income households were not eligible for the direct payments (often referred to as “stimulus payments”). Higher income households were also less likely to be unemployed and so were less likely to receive the supplemental unemployment insurance payments.

In Chapter 17, Section 17.4, we discuss the unequal distribution of income in the United States. Because the federal payments were targeted toward lower and middle income households, did the payments result in a decline in income inequality? Table 17.6 in Chapter 17, shows a common measure of the distribution of income: Households in the United States are divided into five income quintiles, from the 20 percent with the lowest incomes to the 20 percent with the highest incomes, along with the fraction of total income received by each of the five groups. The following table displays the distribution of income using this measure for 2019 and 2020. (We also include the data for the share of income received by the 5 percent of households with the highest incomes.) Note that the definition of income used in the table includes tax payments households make in that year in addition to payments—including the stimulus payments—received from the government. The income is also “equivalence adjusted,” which means that income is adjusted to account for how many adults and children are in a household.

YearLowest 20%Second 20%Middle 20%Fourth 20% Highest 20%Highest 5%
20194.7%10.4%15.7%22.6%46.6%19.9%
20205.1%10.9%16.0%22.8%45.2%18.9%
Percentage change in income share8.7%4.8%2.1%0.8%−3.0%−5.1%

The table shows that the distribution of income in the United States became somewhat more equal during 2020, with the share of income going to each of the first four quintiles increasing, while the income of the highest quintile declined.  The income share of the lowest quintile increased the most—by 8.7 percent—while the income share of the top 5 percent of households decreased by 5.1%. In that section of Chapter 17, we discuss the Gini coefficient, which is a measure of how unequal the distribution of income is. The Gini coefficient ranges between 0 and 1 with higher values indicating a more unequal distribution. Between 2019 and 2020, the Gini coefficient decline from 0.416 to 0.399, or by 4.1 percent, which measure the extent to which the income distribution became more equal. 

Will the reduction in income inequality the United States experienced during 2020 persist? It seems likely to, at least through 2021, given that in March 2021, Congress and President Joe Biden enacted the American Rescue Plan, which included payments to households of up to $1,400 per eligible household member. As with the payments to households made during 2020, high-income households were not eligible. Congress also extended supplemental unemployment insurance payments through early September 2021 in states that were willing to accept the payments. 

What about after federal stimulus payments to households end? (As of late 2021, it appeared unlikely that Congress and President Biden planned on enacting any further payments.) One indication that some of the reduction in inequality might be sustained comes from the sharp increases in the wages of many low-skilled workers. For instance, in October 2021, the wages (as measured by their average hourly earnings) of workers in the leisure and hospitality industry, which includes workers in restaurants and hotels, increased by nearly 12 percent over the previous year. For all workers in the private sector, wages increased by about 5 percent over the same period. Many of the workers in this industry have low incomes. So, the fact that their wages were increasing more than twice as fast as wages in the overall economy indicates that at least some low-income workers were closing the earnings gap with other workers.

Sources: Emily A. Shrider, Melissa Kollar, Frances Chen, and Jessica Semega, U.S. Census Bureau, Current Population Reports, P60-270, Income and Poverty in the United States: 2020, Washington, DC, U.S. Government Printing Office, September 2021, Table C-3; and U.S. Bureau of Labor Statistics.