Image generated by GTP-4o of people shopping.
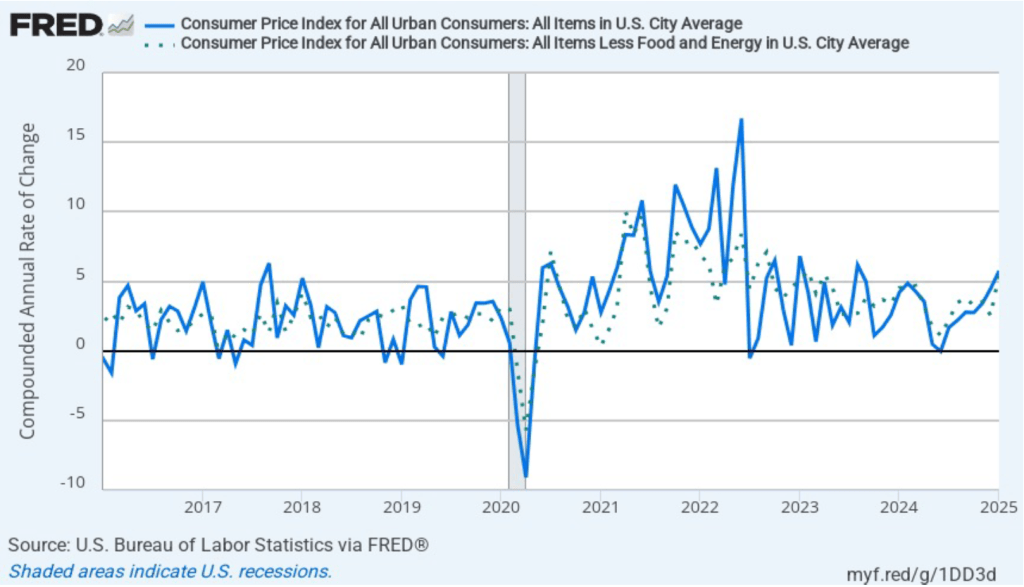
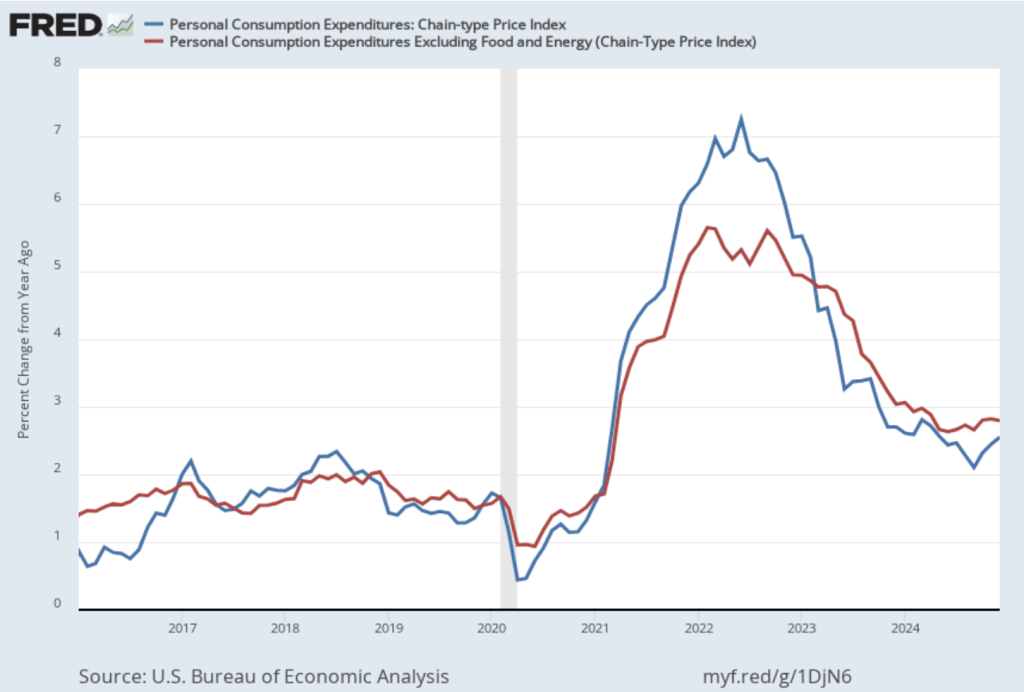
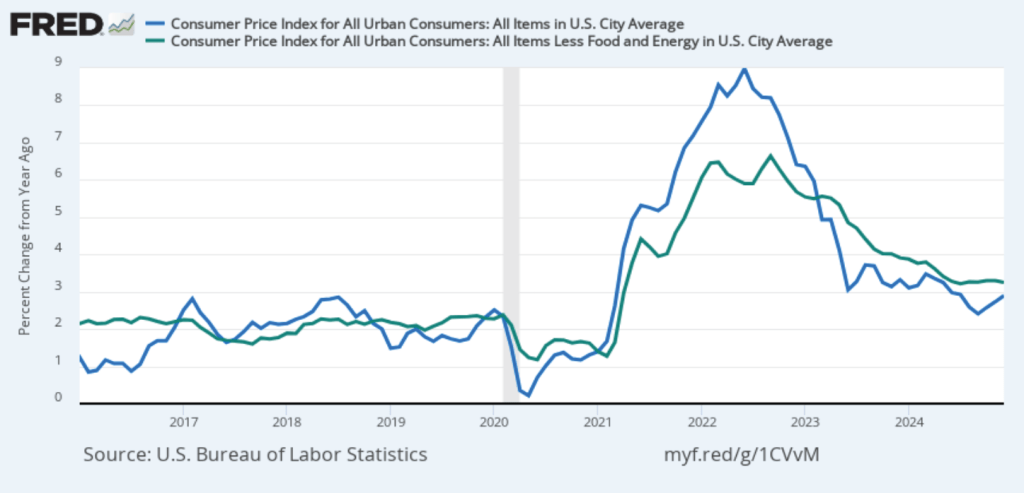
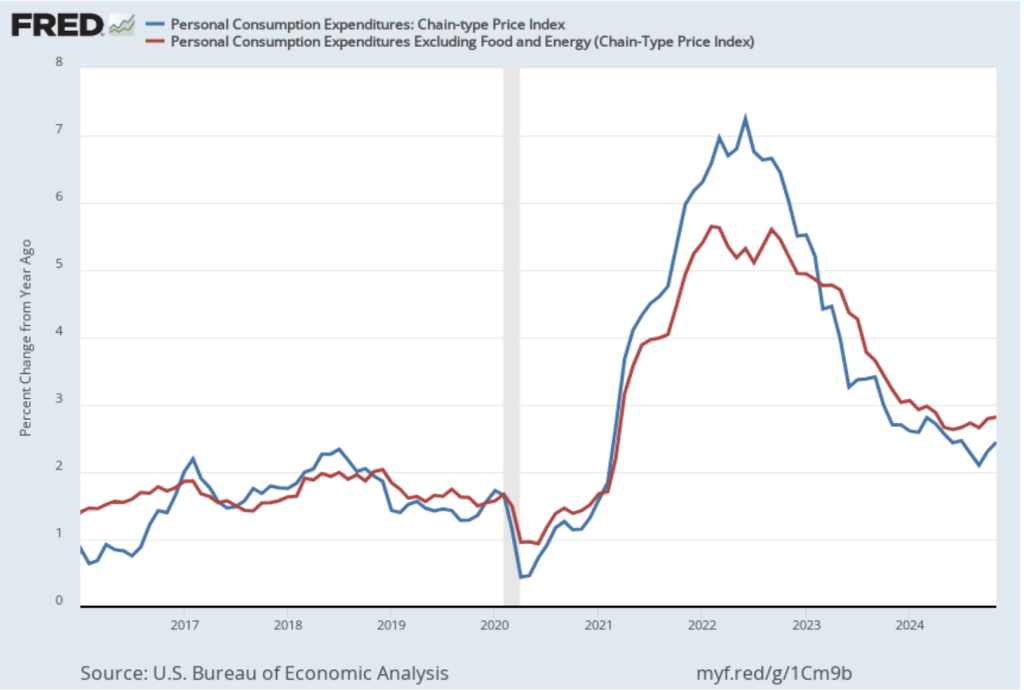
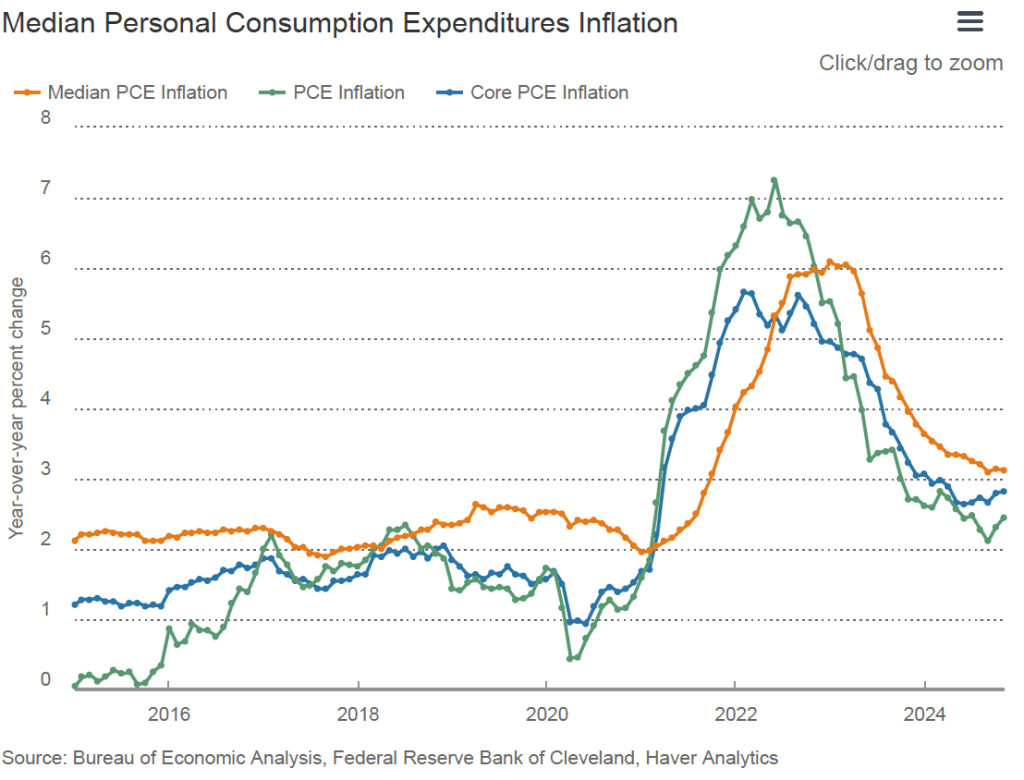
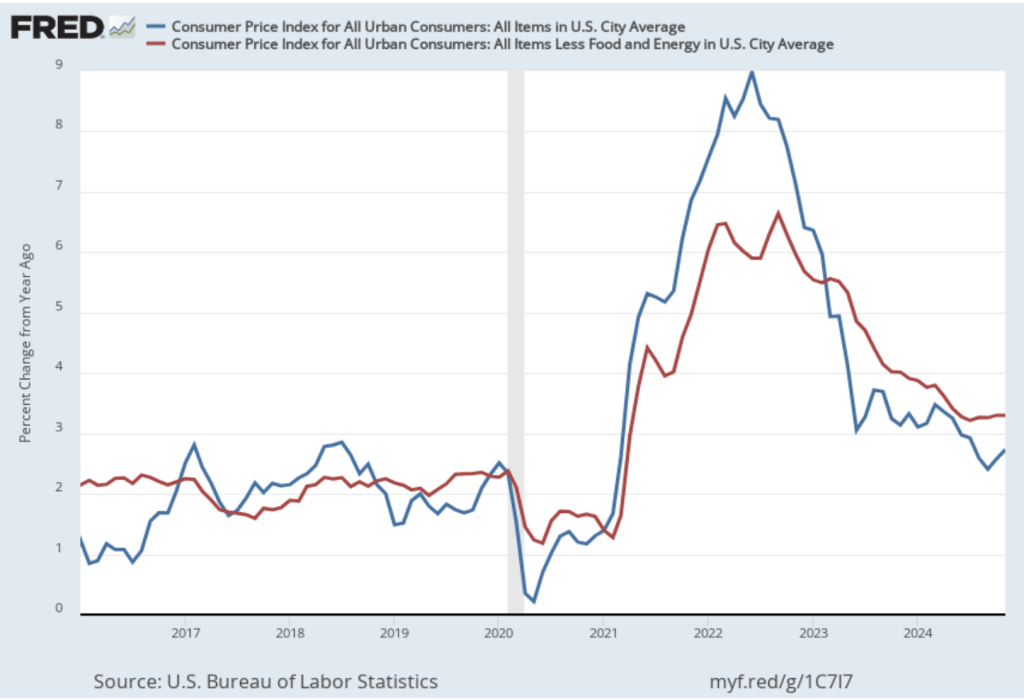
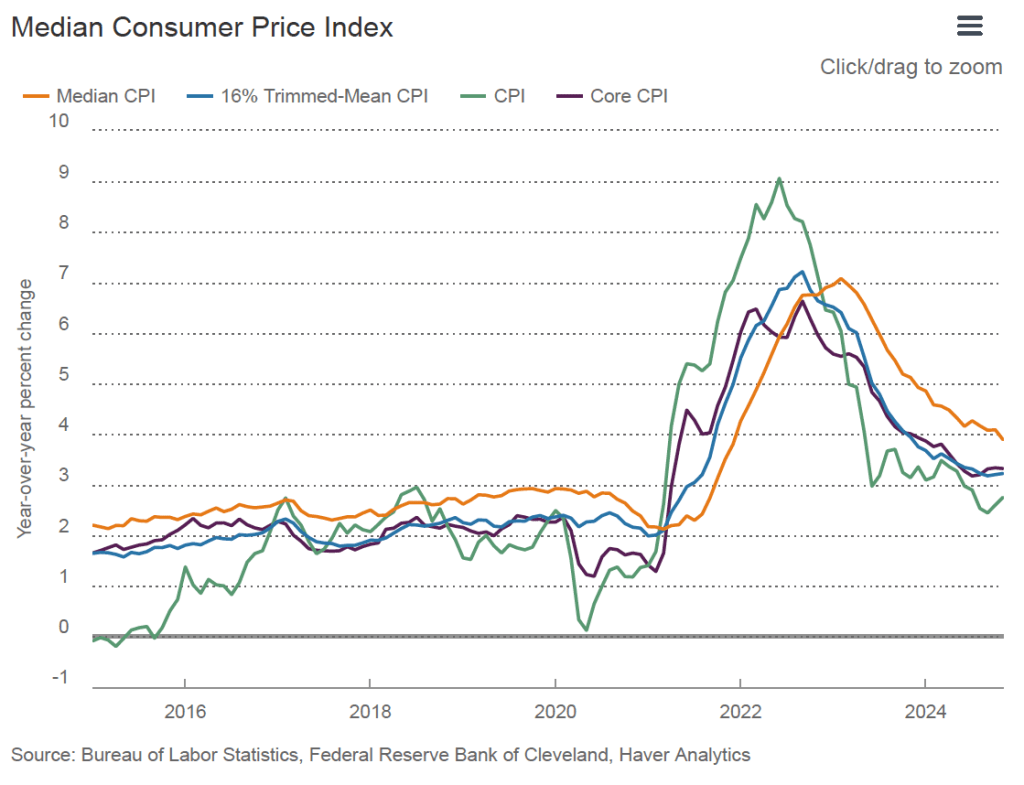
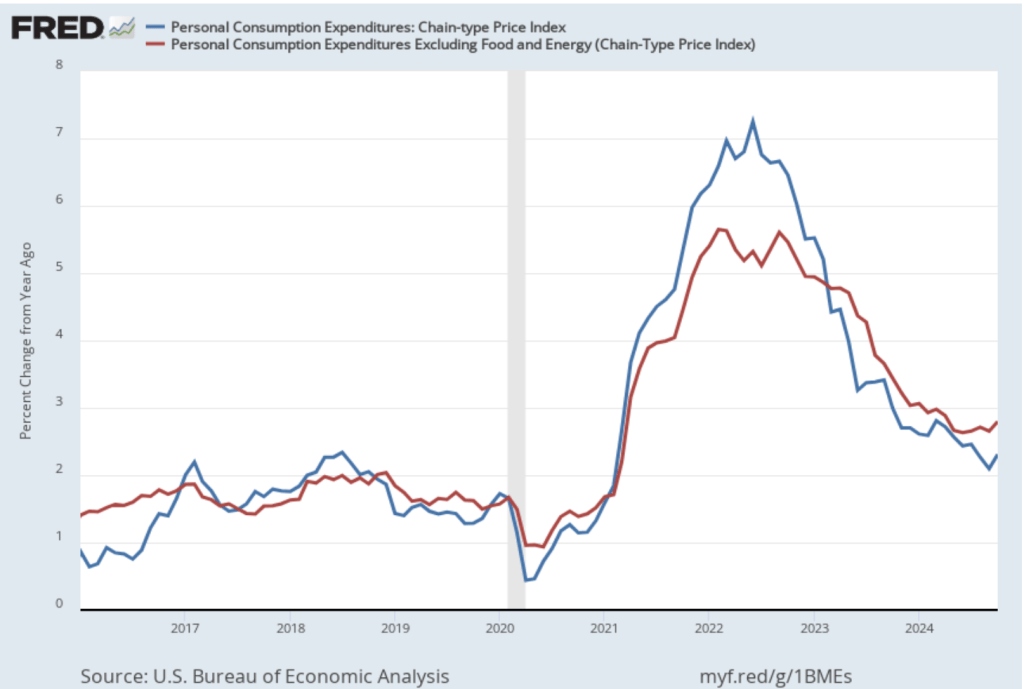
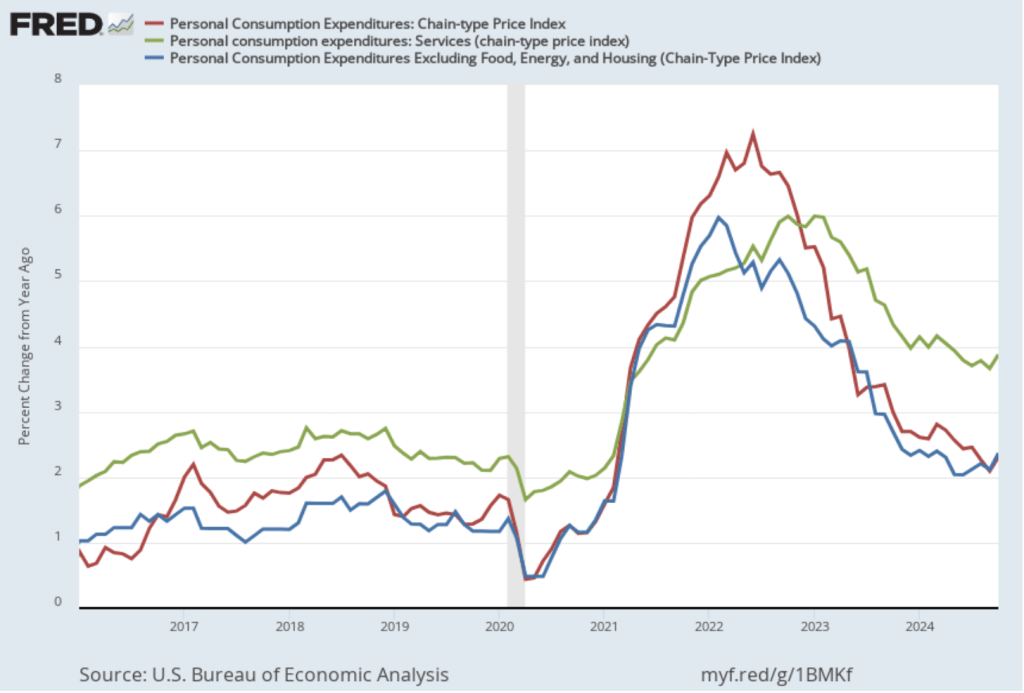
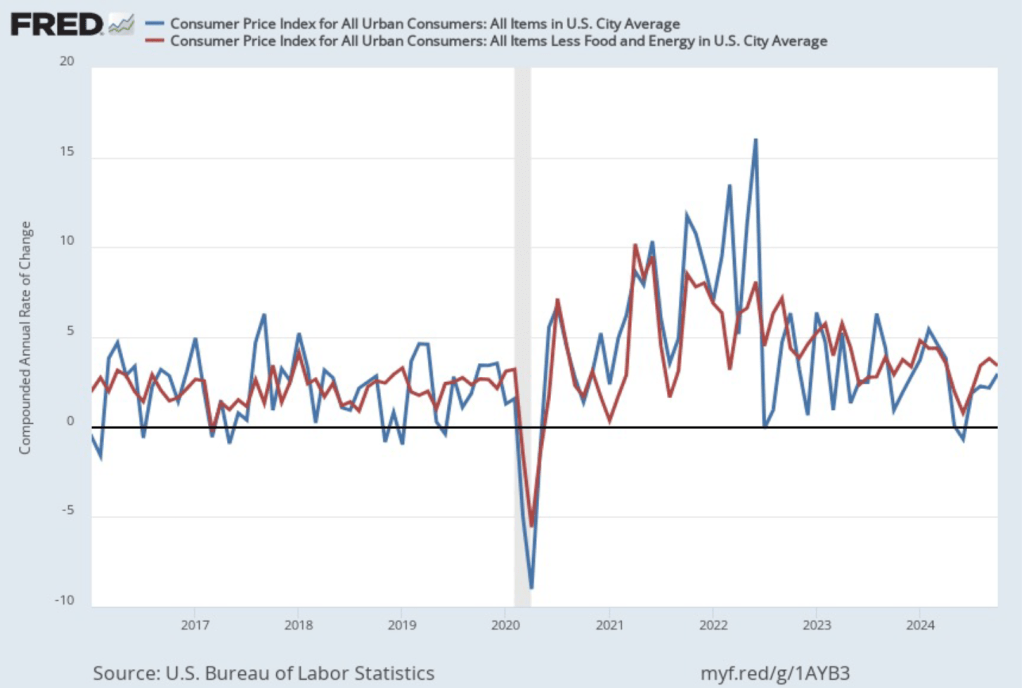
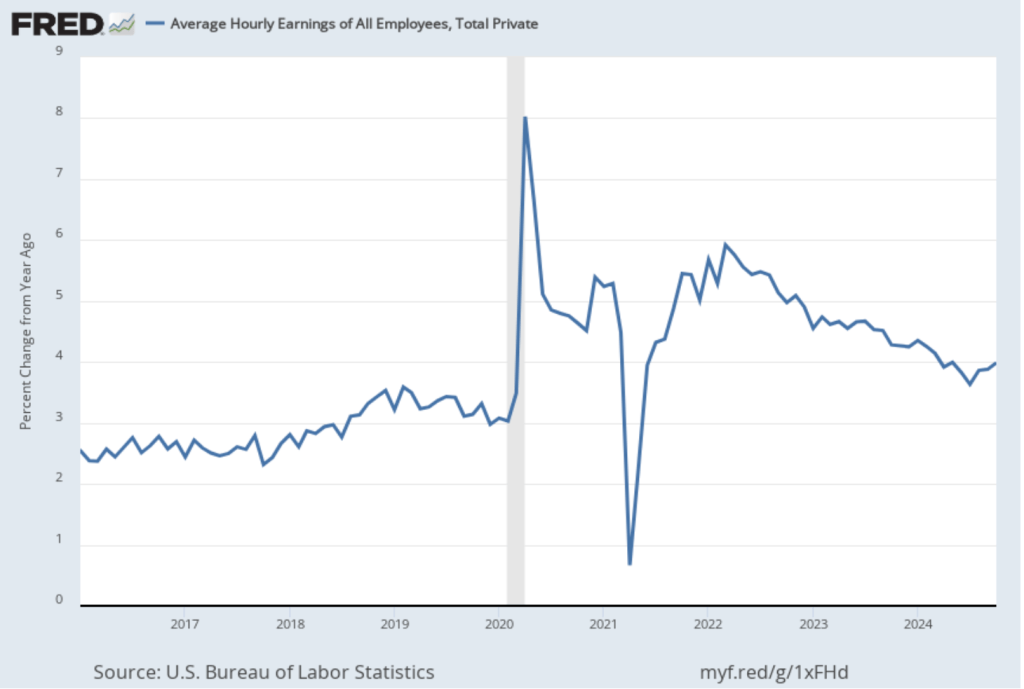
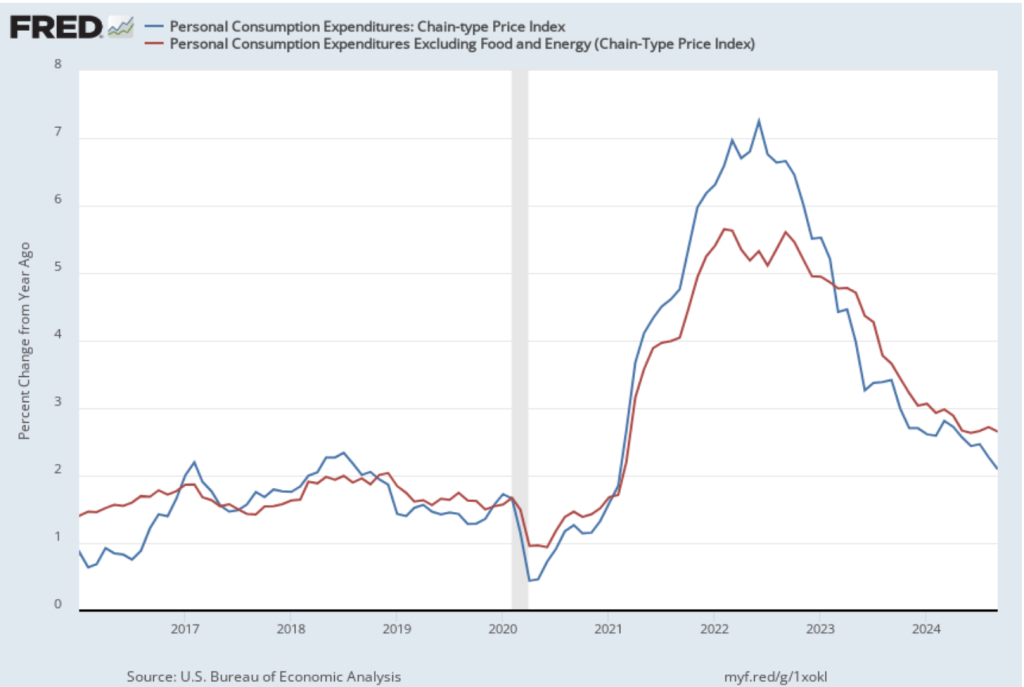
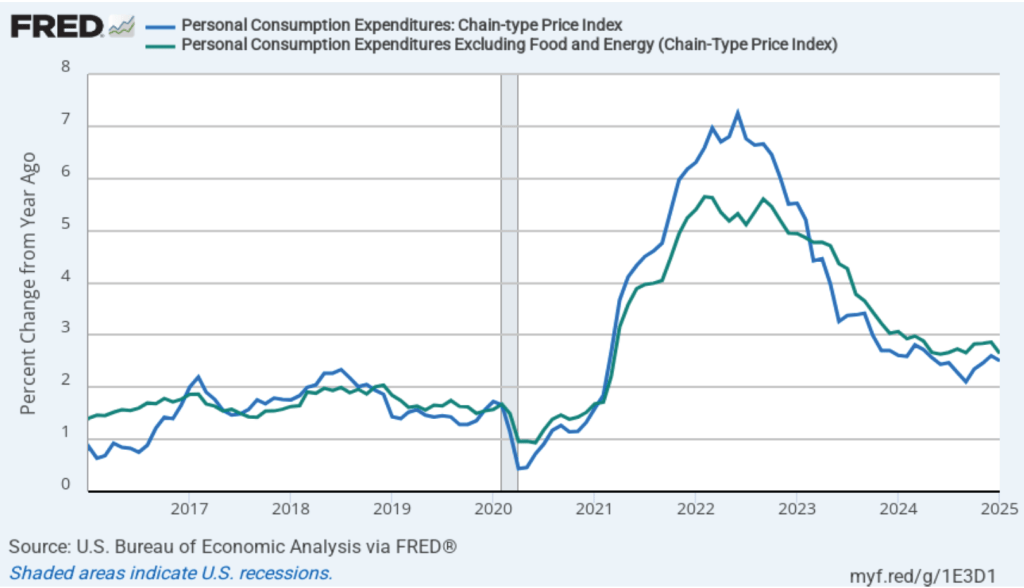
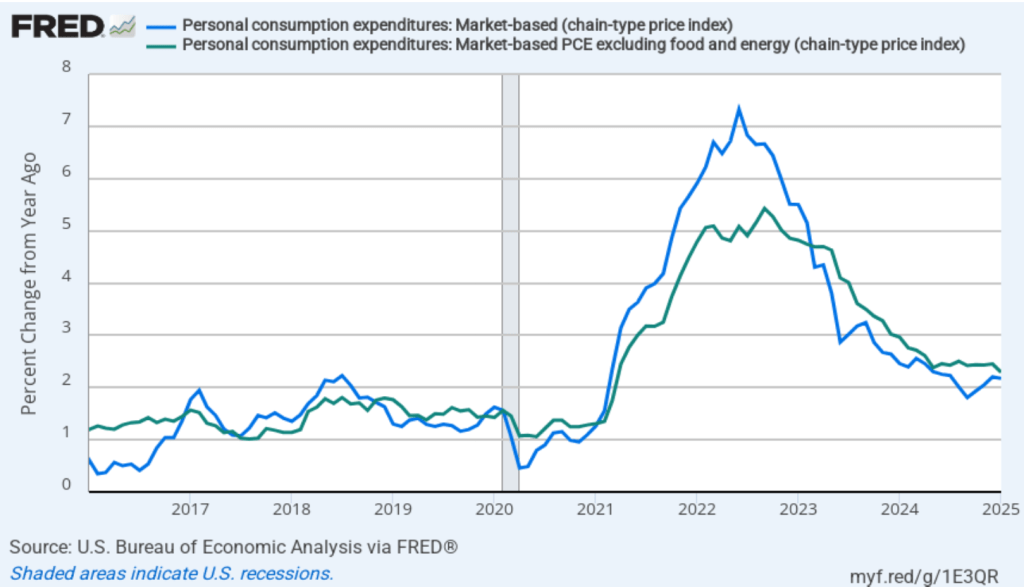
Today (February 28), the BEA released monthly data on the personal consumption expenditures (PCE) price index as part of its “Personal Income and Outlays” report. The Fed relies on annual changes in the PCE price index to evaluate whether it’s meeting its 2 percent annual inflation target. The following figure shows PCE inflation (blue line) and core PCE inflation (green line)—which excludes energy and food prices—for the period since January 2016 with inflation measured as the percentage change in the PCE from the same month in the previous year. Measured this way, in January PCE inflation was 2.5 percent, down slightly from 2.6 in December. Core PCE inflation in January was 2.6 percent, down from 2.9 percent in December. Headline and core PCE inflation were both consistent with the forecasts of economists.
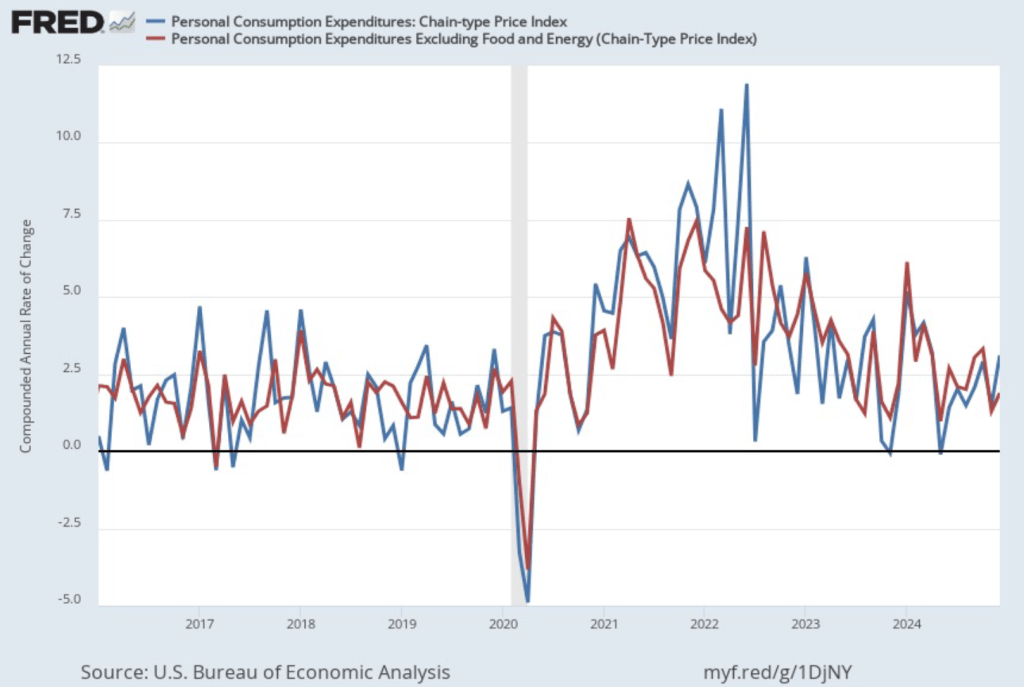
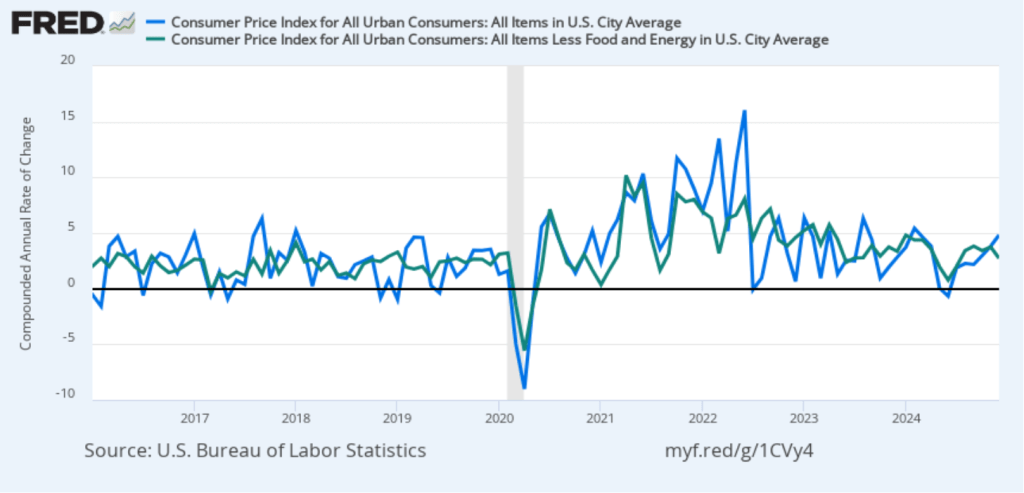
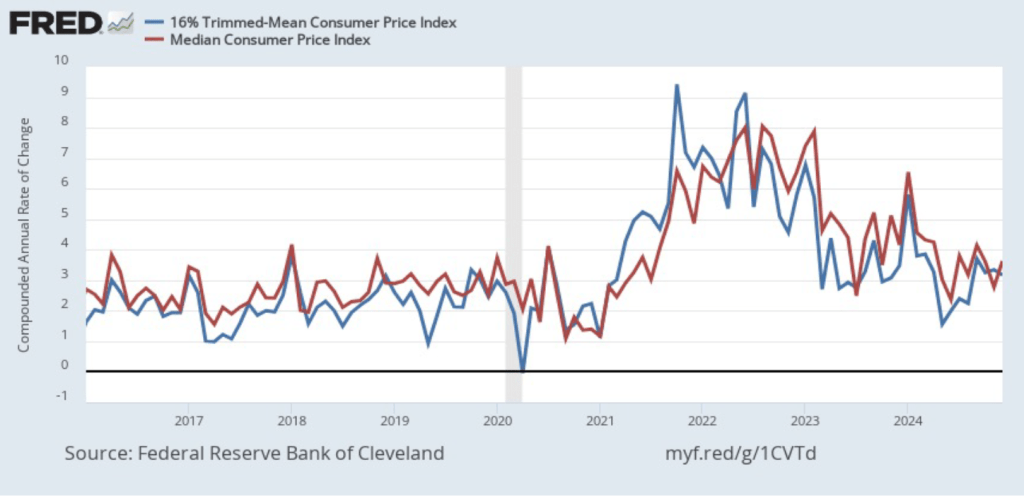
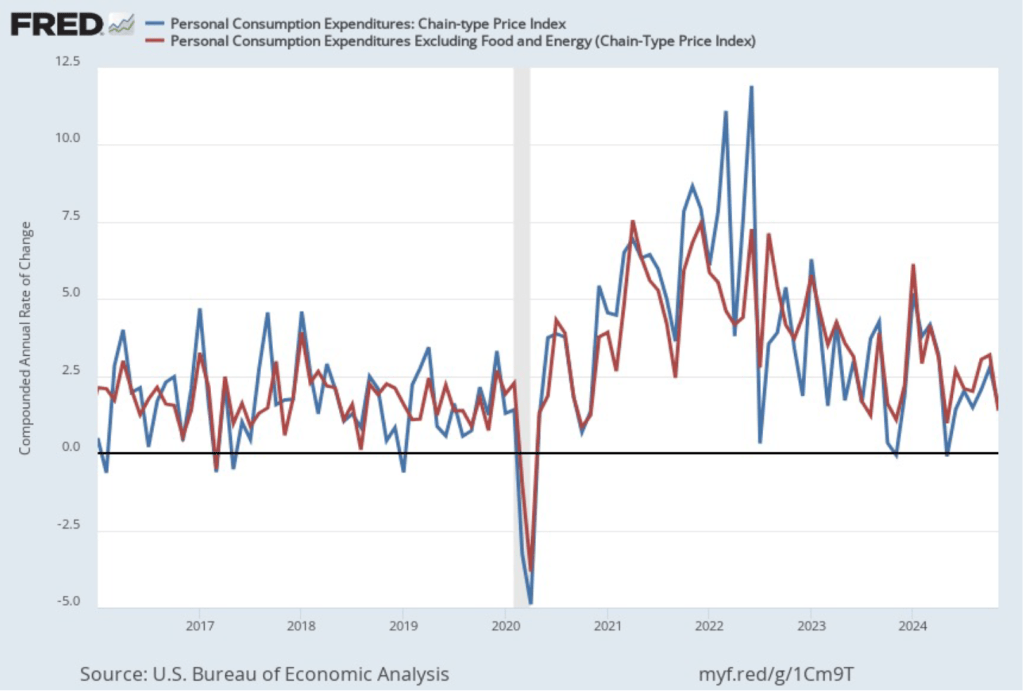
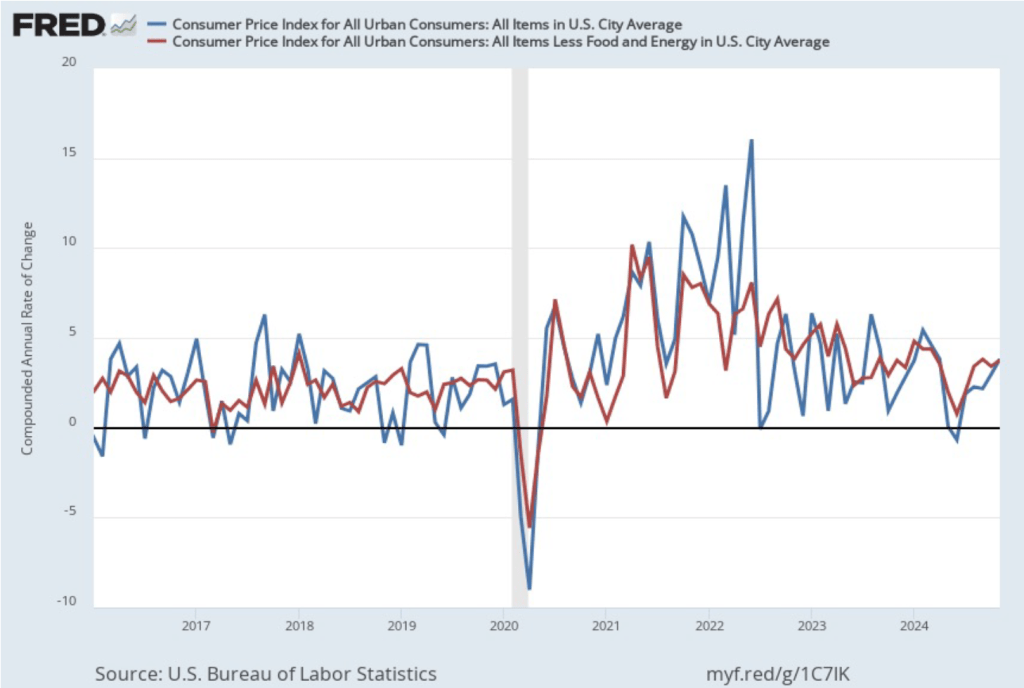
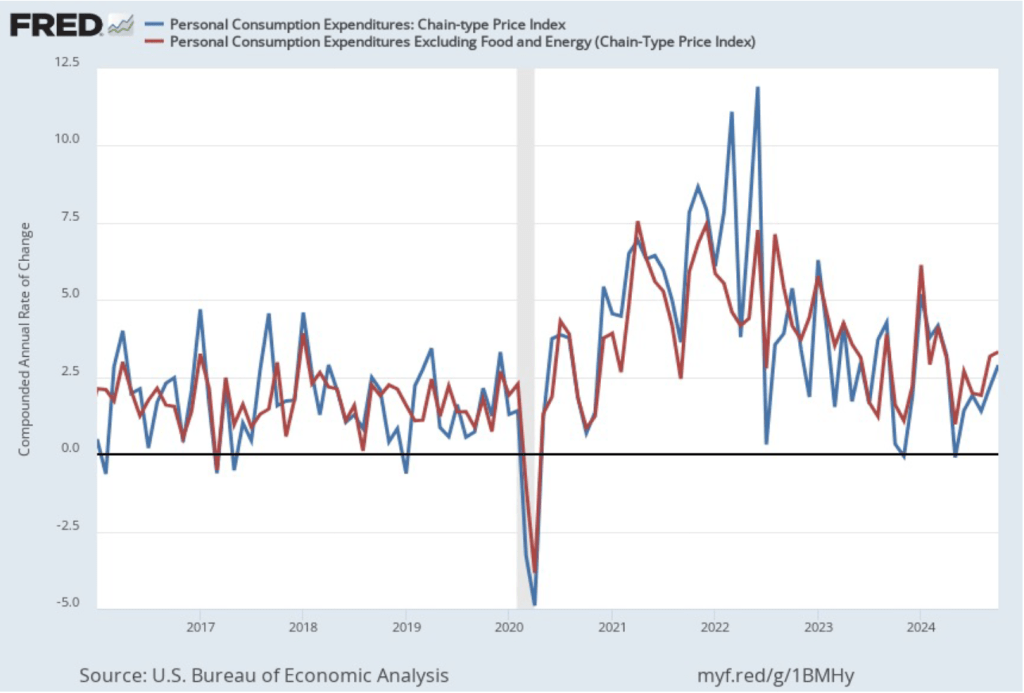
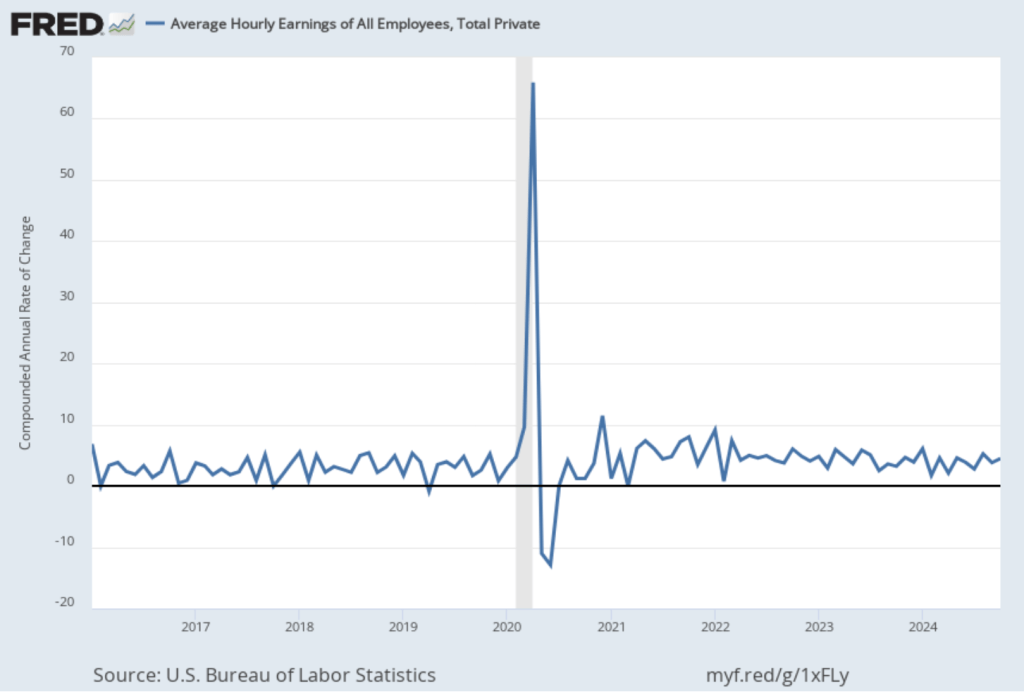
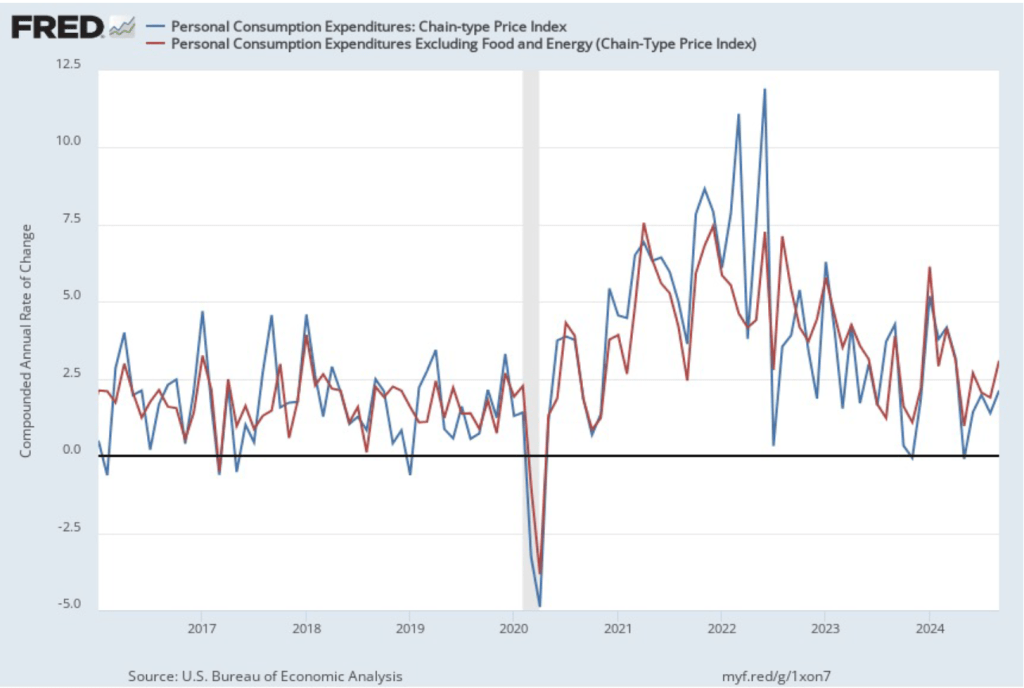
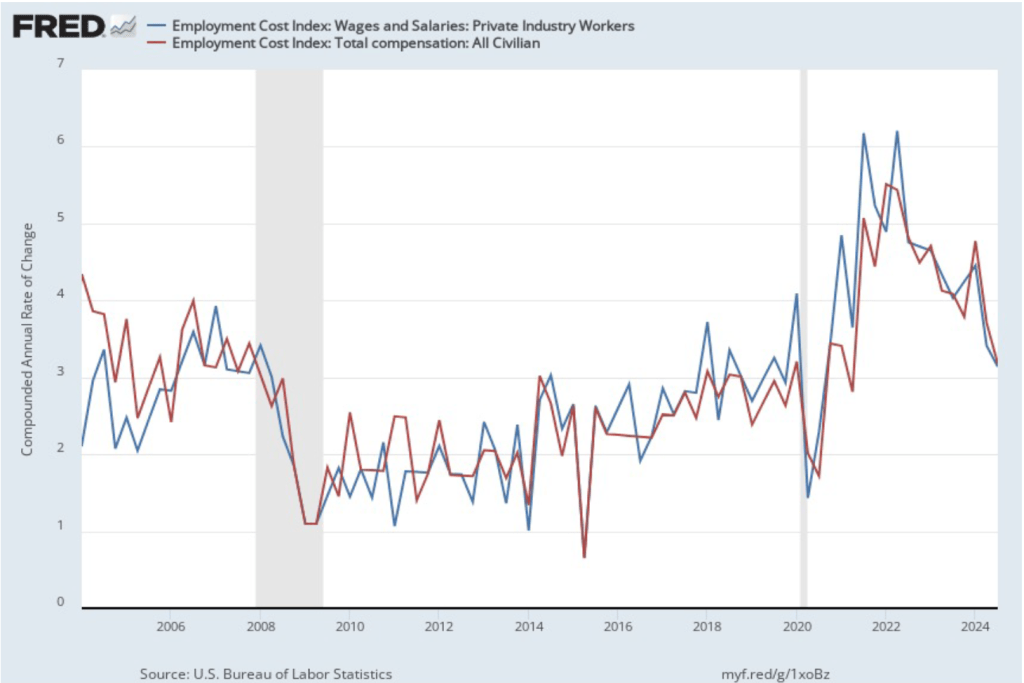
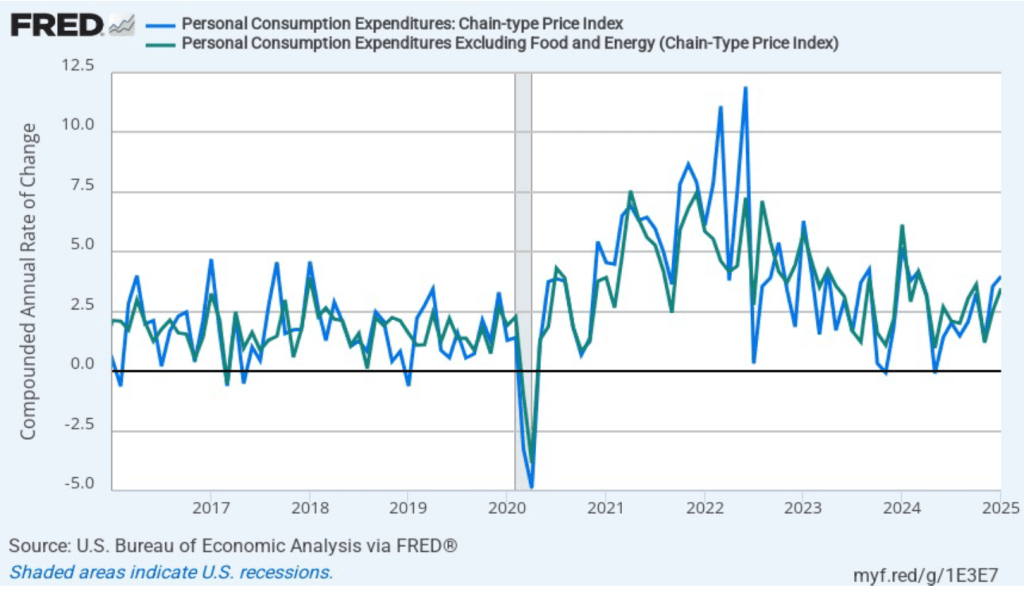
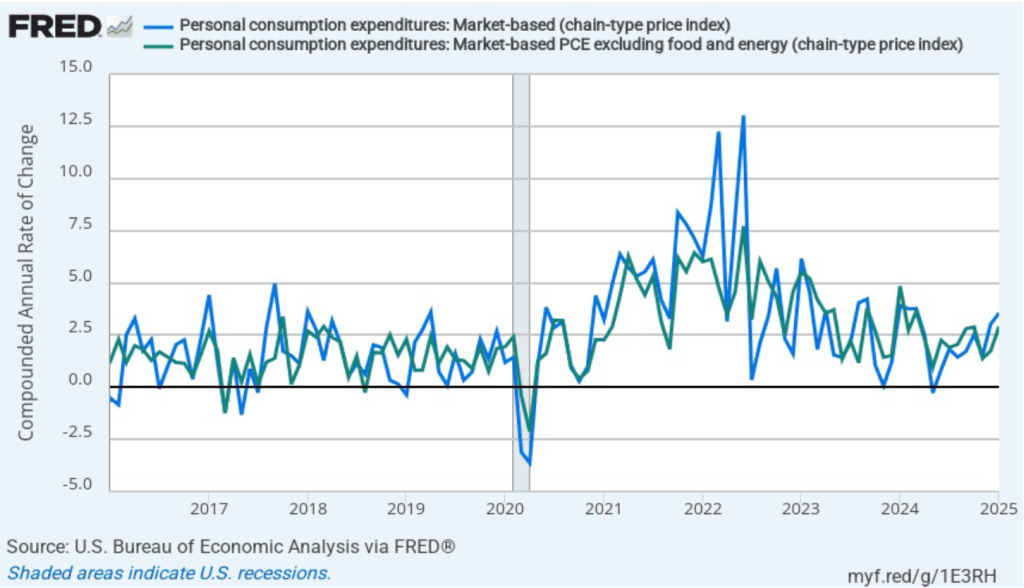
The following figure shows PCE inflation and core PCE inflation calculated by compounding the current month’s rate over an entire year. (The figure above shows what is sometimes called 12-month inflation, while this figure shows 1-month inflation.) Measured this way, PCE inflation rose in January to 4.0 percent from 3.6 percent in December. Core PCE inflation rose in January to 3.5 percent from to 2.5 percent in December. So, both 1-month core PCE inflation estimates are running well above the Fed’s 2 percent target. But the usual caution applies that 1-month inflation figures are volatile (as can be seen in the figure), so we shouldn’t attempt to draw wider conclusions from one month’s data.
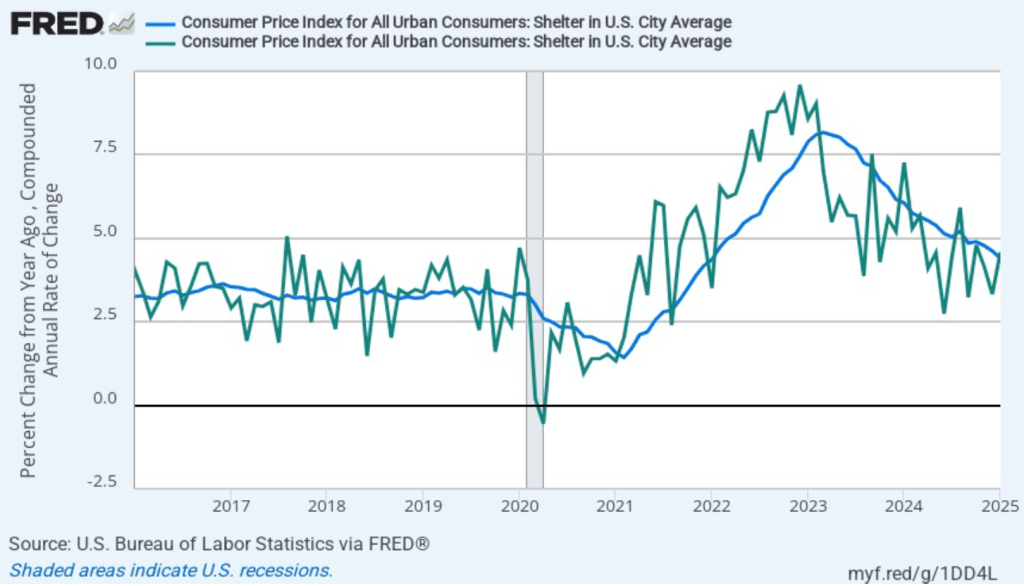
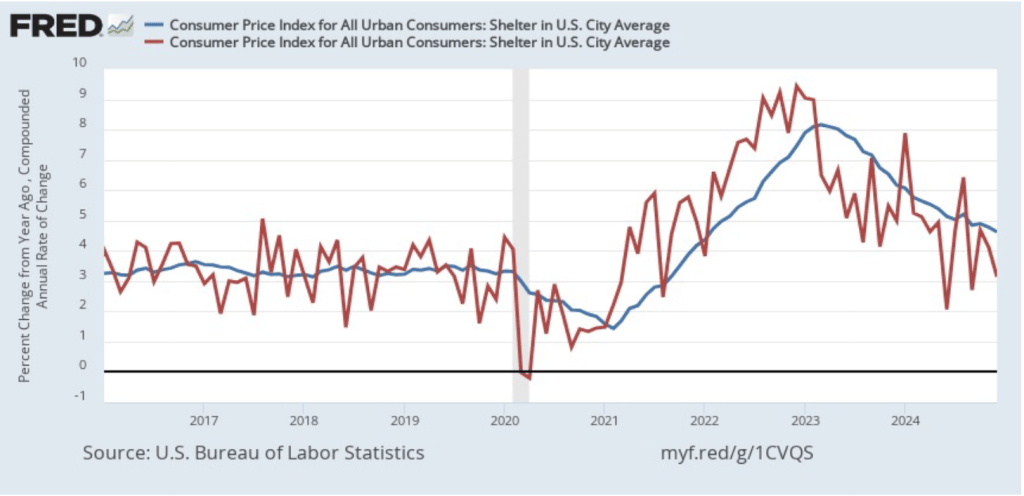
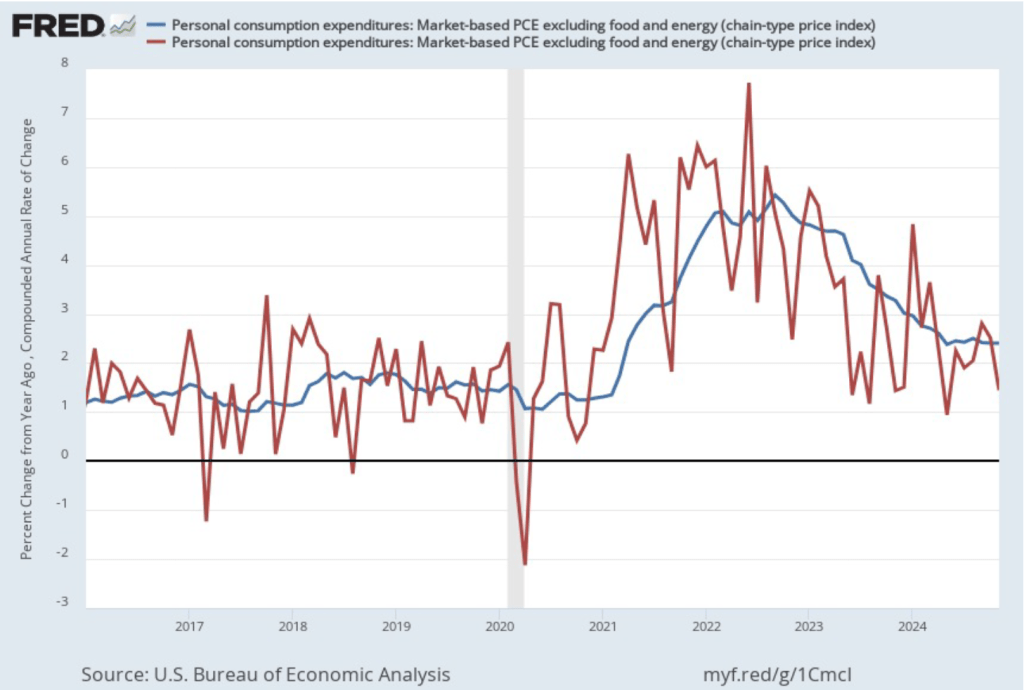
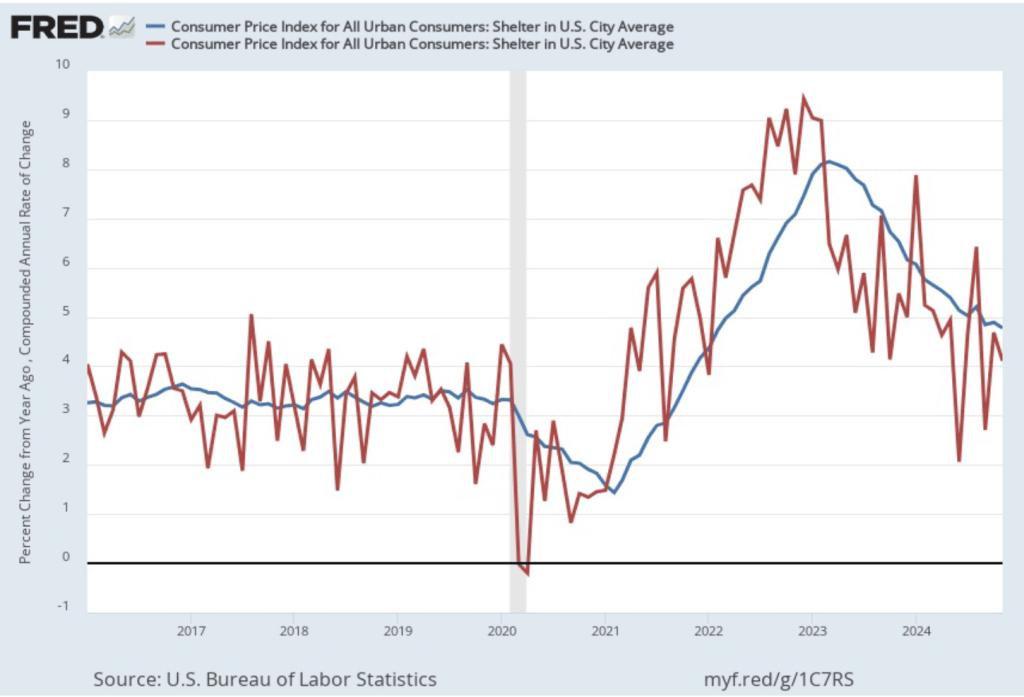
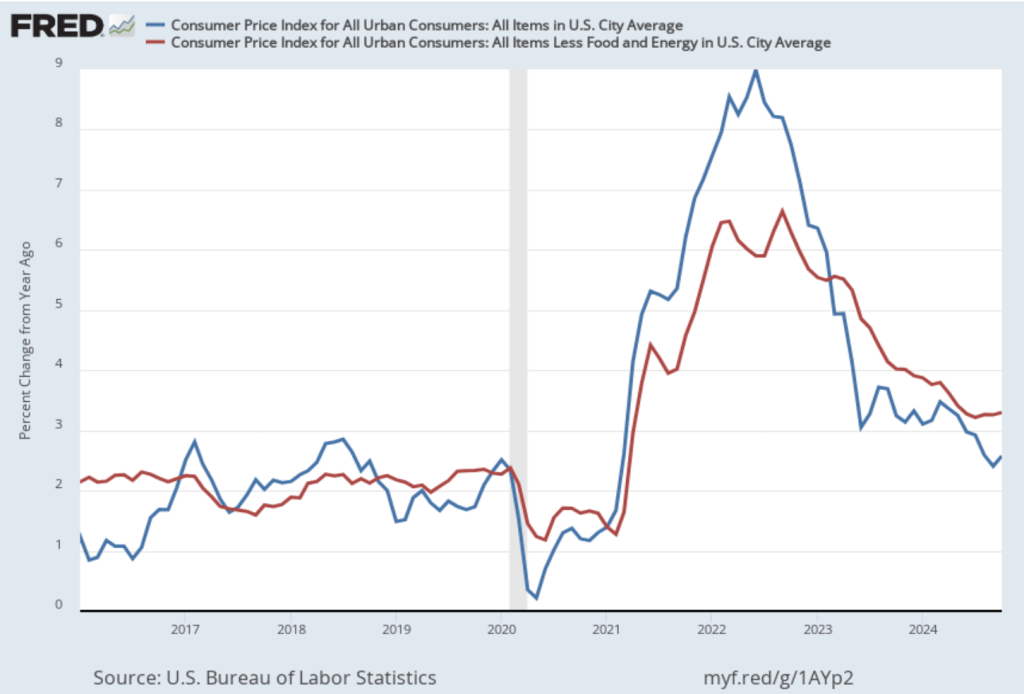
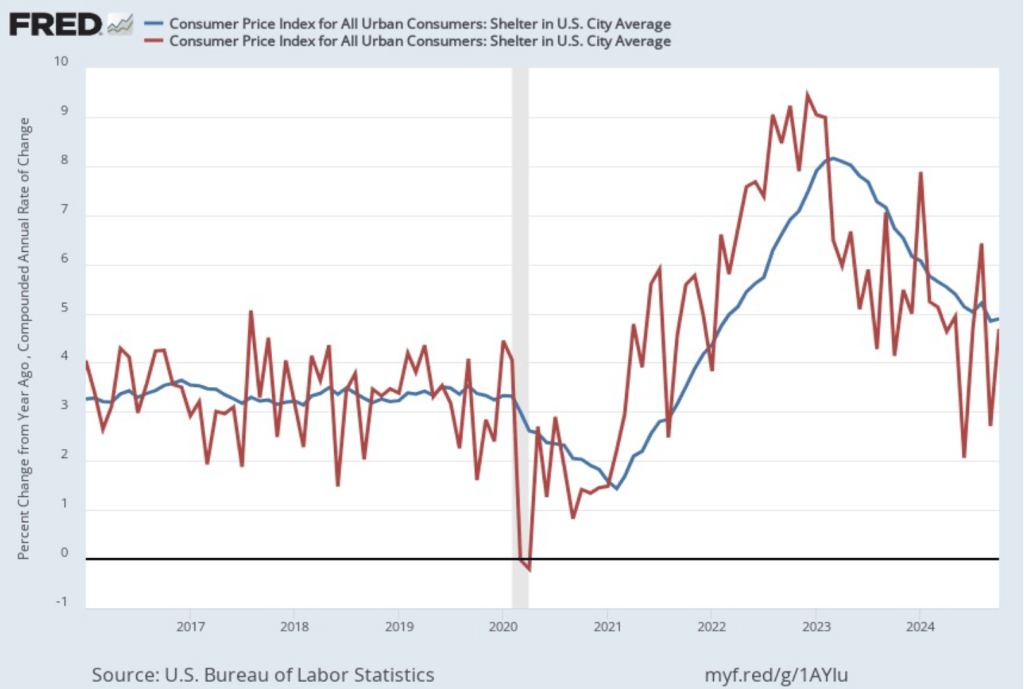
In recent months, Fed Chair Jerome Powell has noted that inflation in non-market services has been high. Non-market services are services whose prices the BEA imputes rather than measures directly. For instance, the BEA assumes that prices of financial services—such as brokerage fees—vary with the prices of financial assets. So that if stock prices rise, the prices of financial services included in the PCE price index also rise. Powell has argued that these imputed prices “don’t really tell us much about … tightness in the economy. They don’t really reflect that.” The following figure shows 12-month headline inflation (the blue line) and 12-month core inflation (the green line) for market-based PCE. (The BEA explains the market-based PCE measure here.)
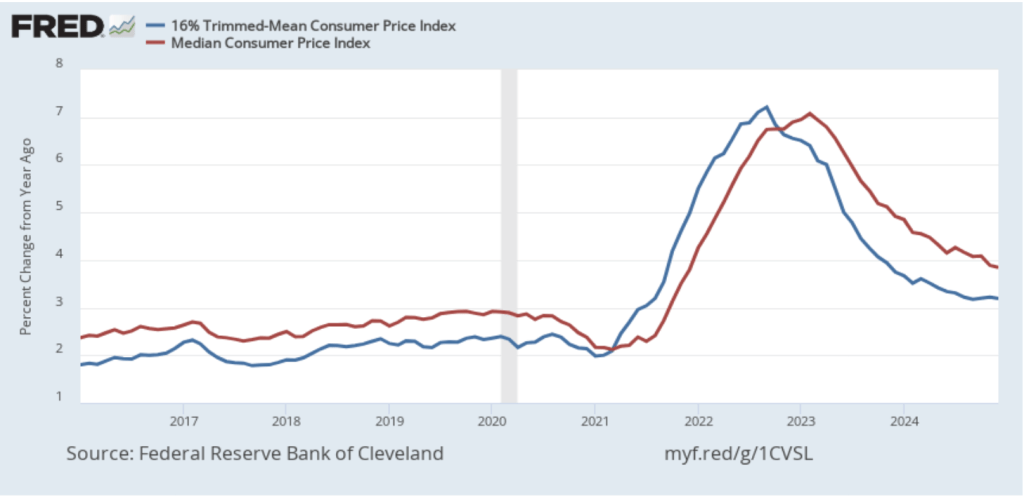
Headline market-based PCE inflation was 2.2 percent in January, and core market-based PCE inflation was 2.3 percent. So, both market-based measures show less inflation in January than do the total measures. In the following figure, we look at 1-month inflation using these measures. Again, inflation is running somewhat lower when using these market-based measures of inflation. Note, though, that all four market-based measures are running above the Fed’s 2 percent target.
In summary, today’s data don’t change the general picture with respect to inflation: While inflation has substantially declined from its high in mid-2022, it still is running above the Fed’s target of 2 percent. As a result, it’s likely that the Fed’s policymaking Federal Open Market Committee (FOMC) will leave its target for the federal funds rate unchanged at its next meeting on March 18–19.
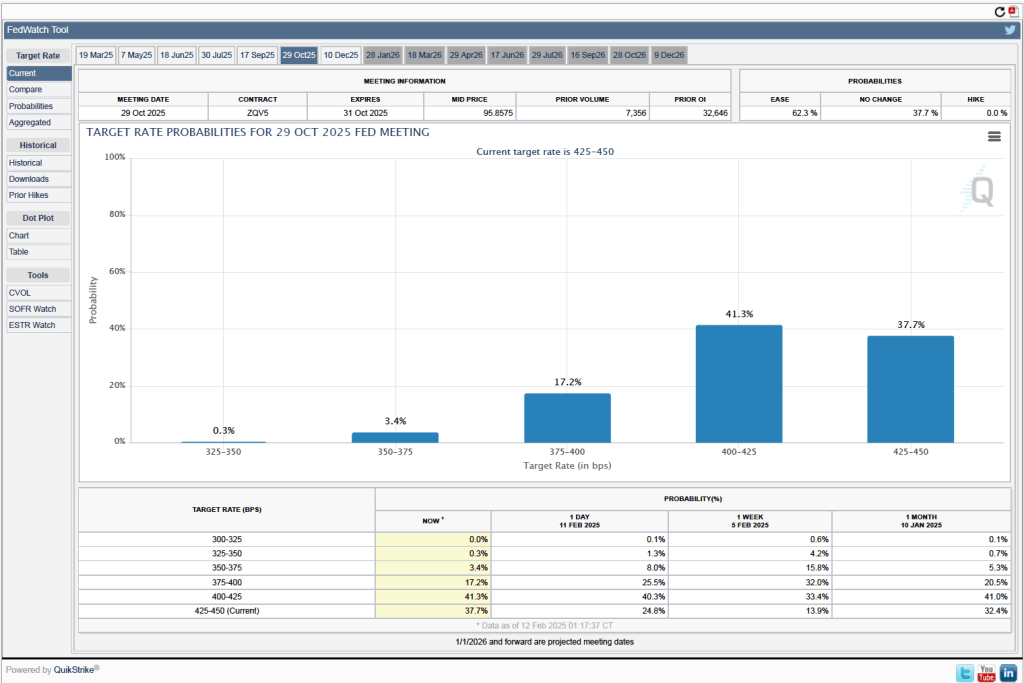
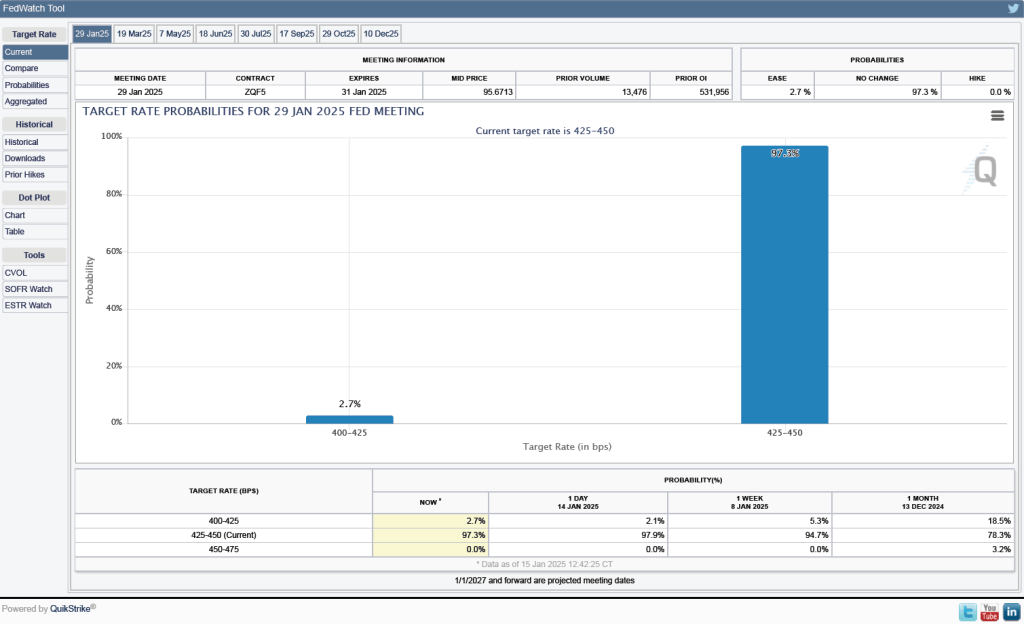
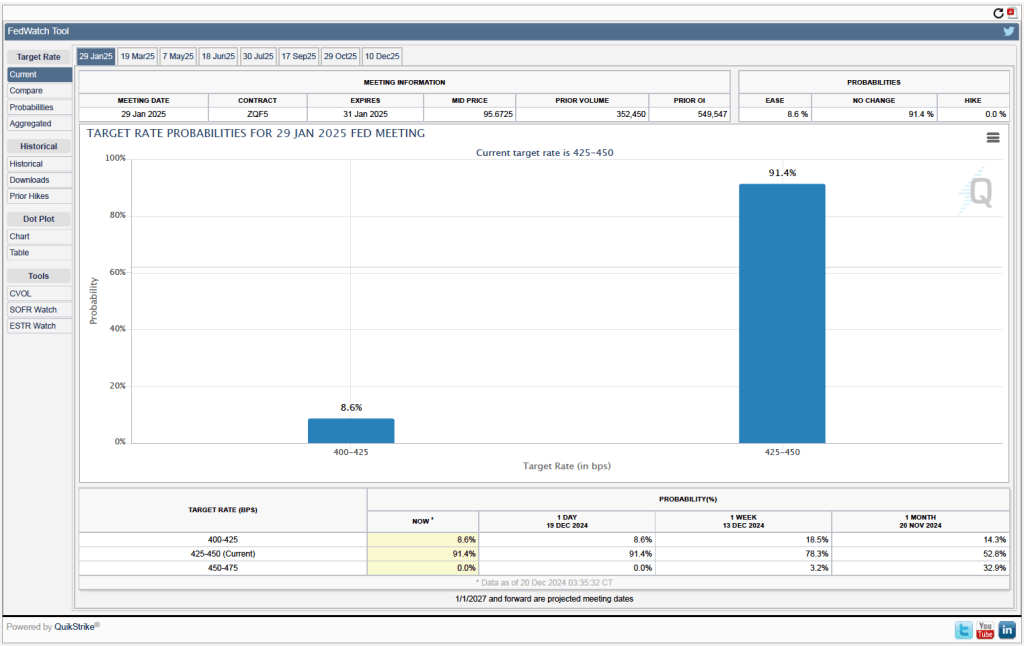
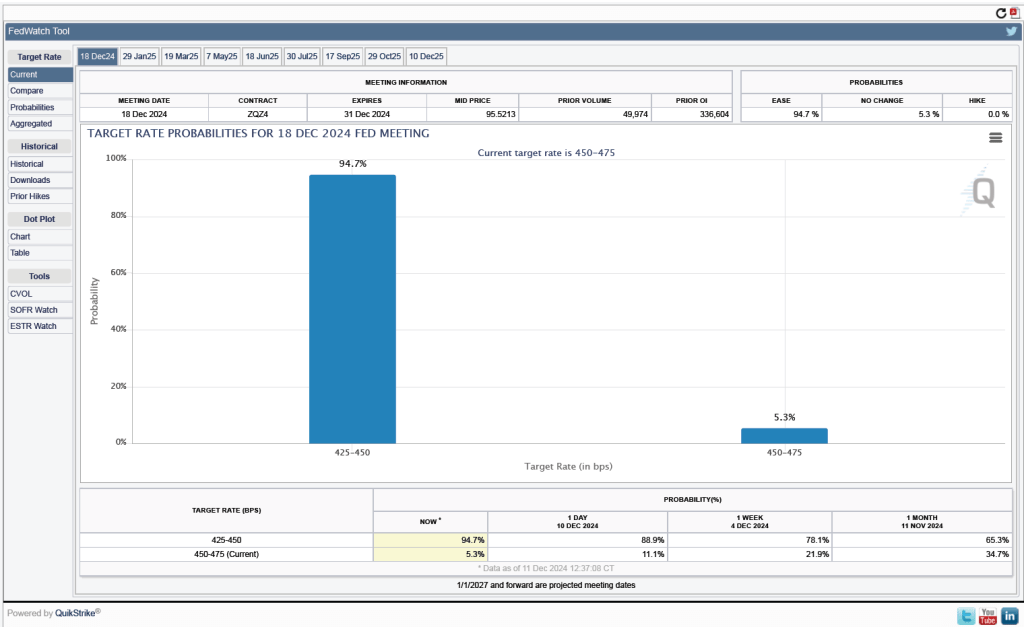
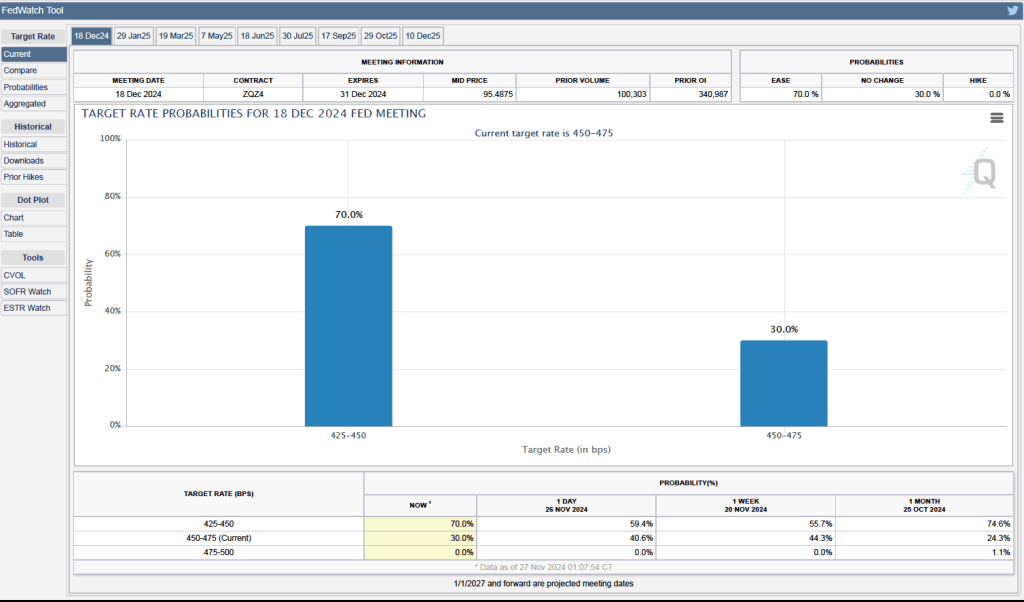
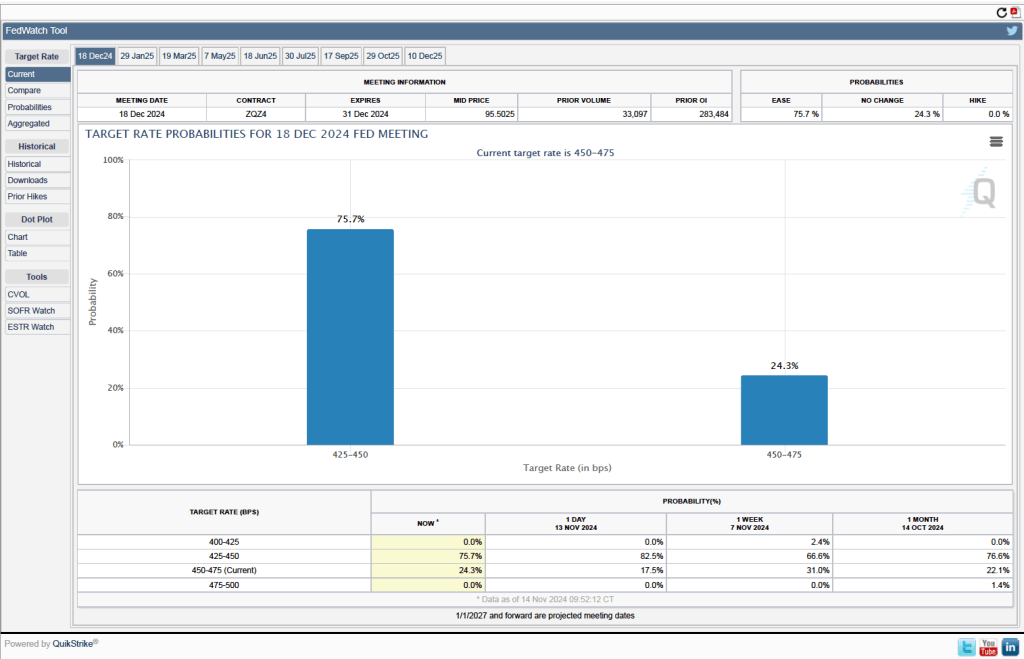
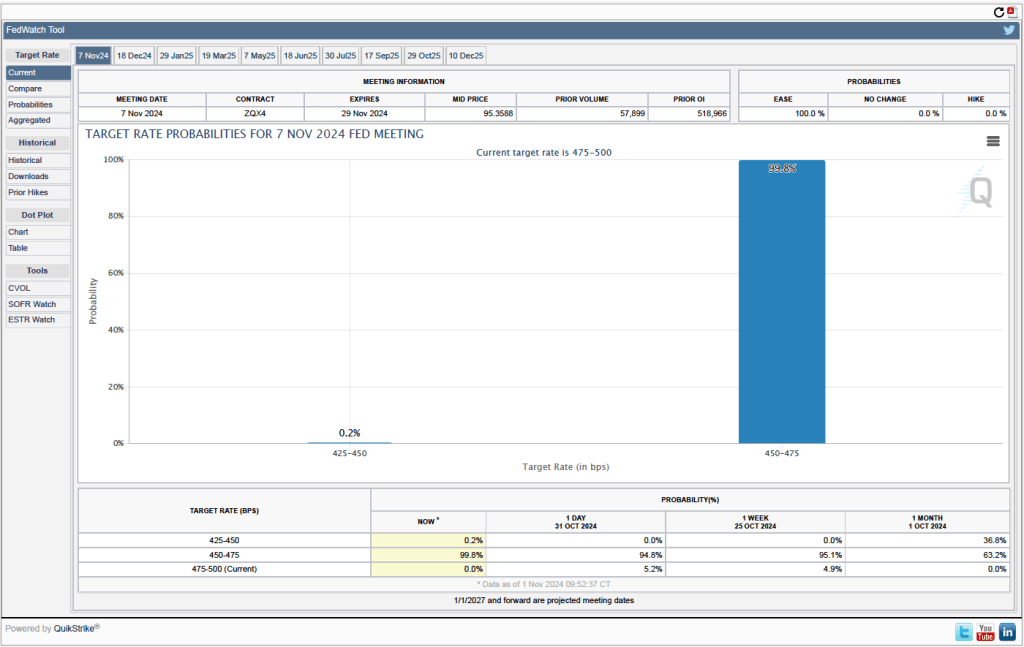
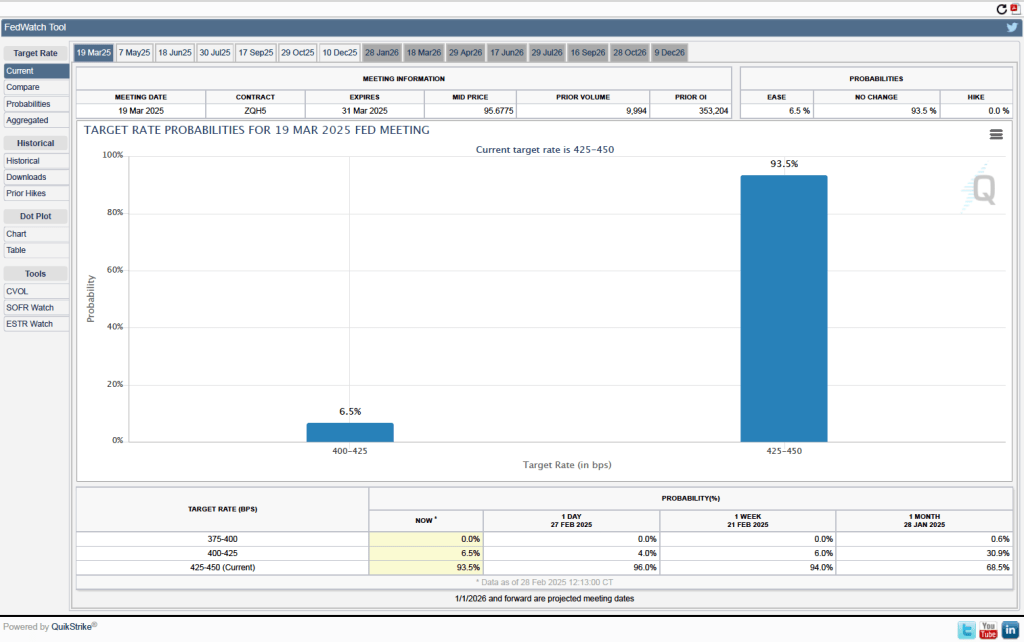
Investors who buy and sell federal funds futures contracts expect that the FOMC will leave its federal funds rate target unchanged at its next meeting. (We discuss the futures market for federal funds in this blog post.) As the following figure shows, investors assign a probability of 93.5 percent to the FOMC leaving its target for the federal funds rate unchanged at the current range of 4.25 percent to 4.50. Investors assign a probability of only 6.5 percent to the FOMC cutting its target by 0.25 percentage point (25 basis points).
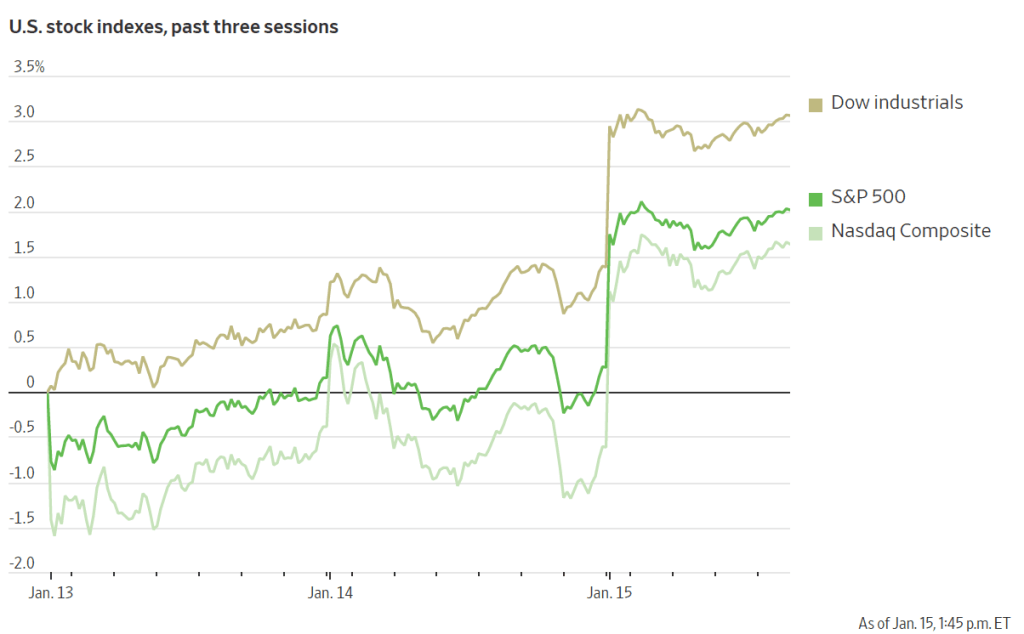
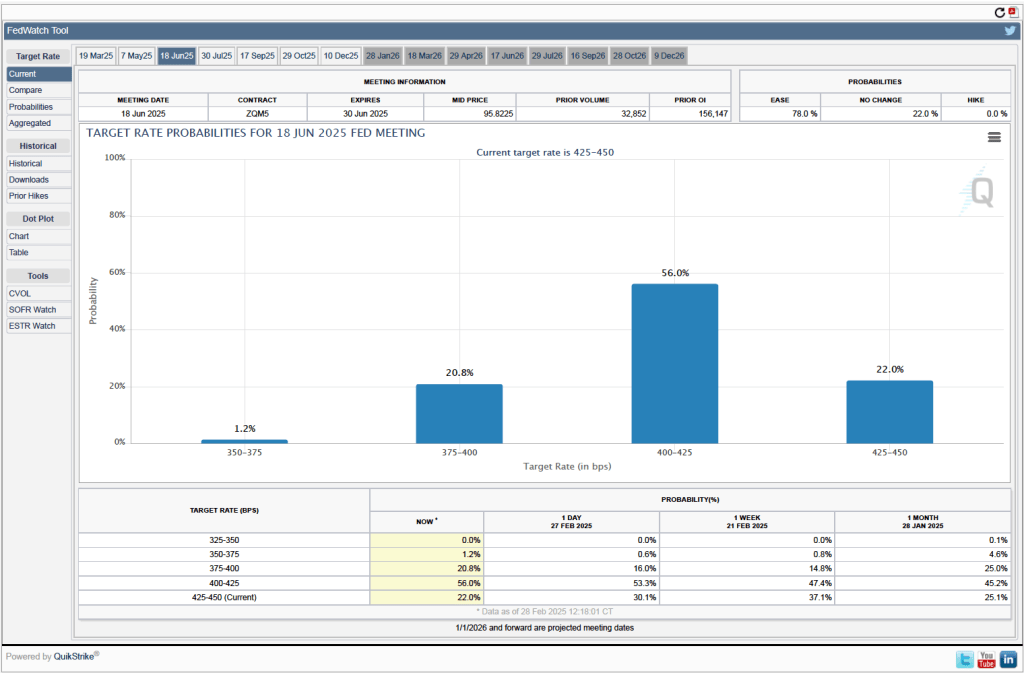
As shown the following figure shows, investors assign a probability of greater than 50 percent that the FOMC will cut its target range by at least 25 basis points at its meeting nearly four months from now on June 17–18. Investors may be concerned that the economy is showing some signs of weakening. Today’s BEA report indicates that real personal consumption expenditures declined at a very high 5.5 percent compound annual rate in January. (Although measured as the 12-month change, real consumption spending increased by 3.o percent in January.)
We’ll have a better understanding of the FOMC’s evaluation of recent macroeconomic data after Chair Powell’s news conference following the March 18–19 meeting.