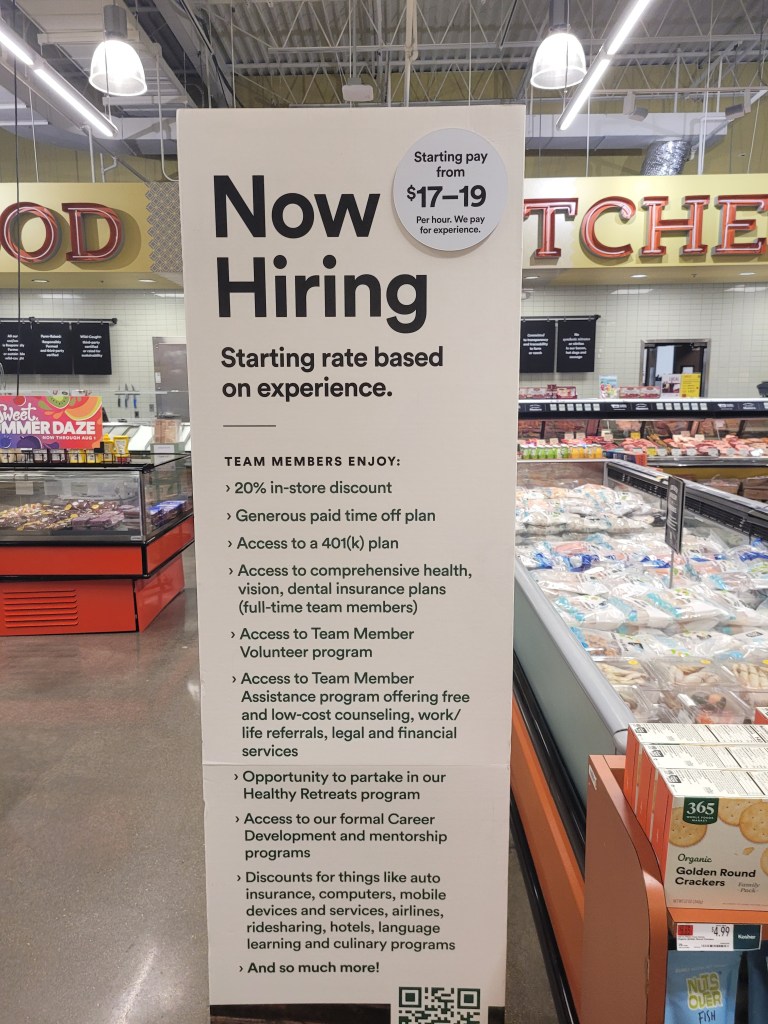
An image generated by GTP-4o of people shopping
This morning (November 27), the BEA released monthly data on the personal consumption expenditures (PCE) price index as part of its “Personal Income and Outlays” report for October. The Fed relies on annual changes in the PCE price index to evaluate whether it’s meeting its 2 percent annual inflation target. This month’s data indicates that progress towards the Fed’s target may have stalled.
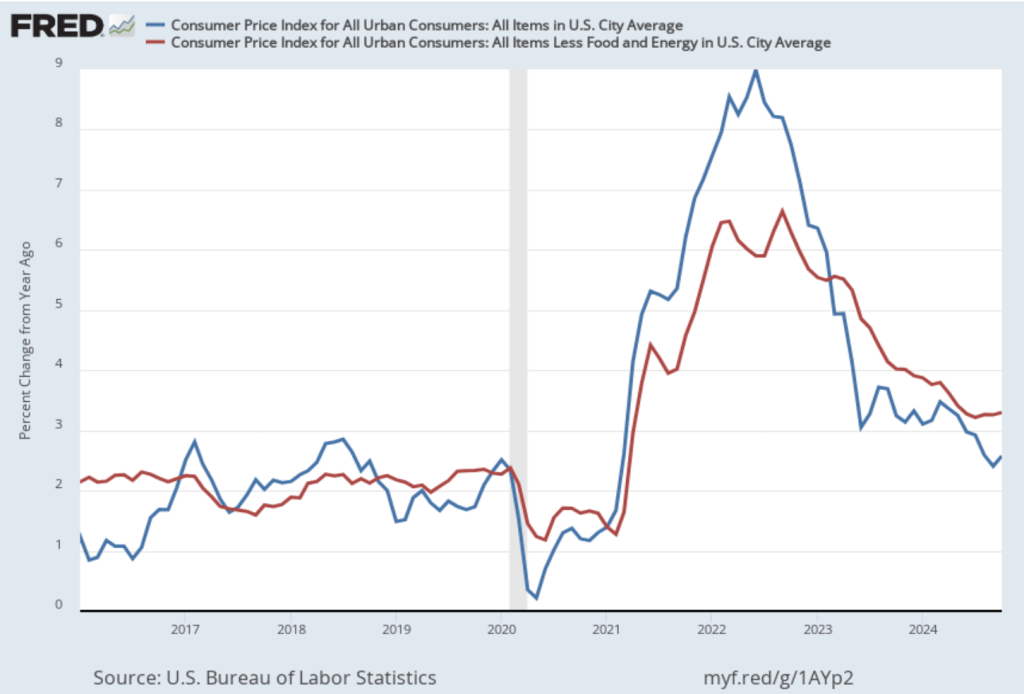
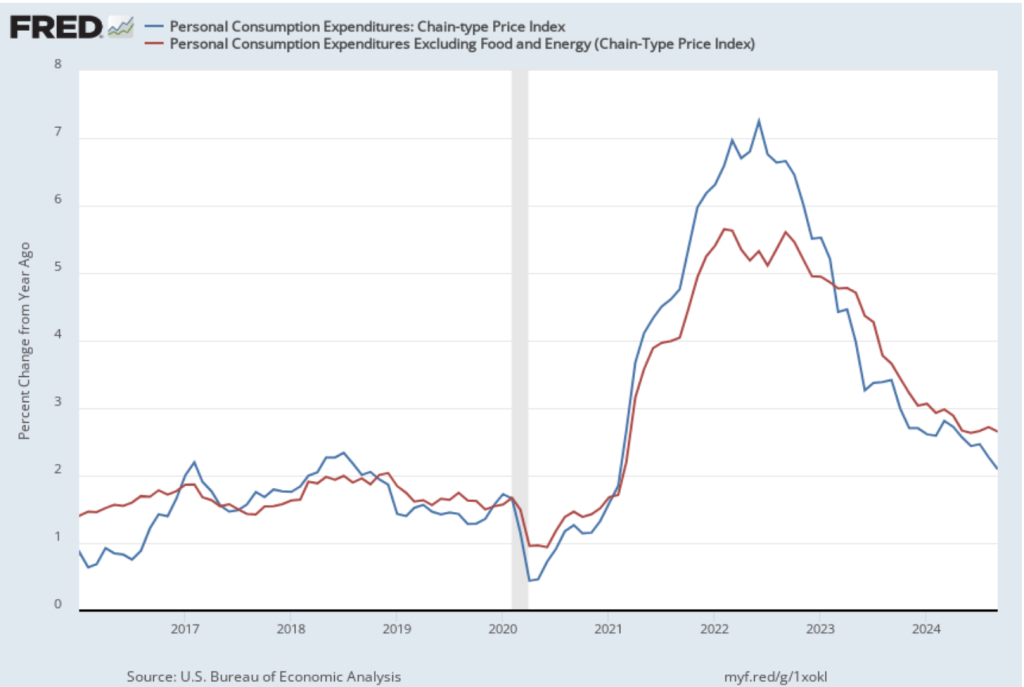
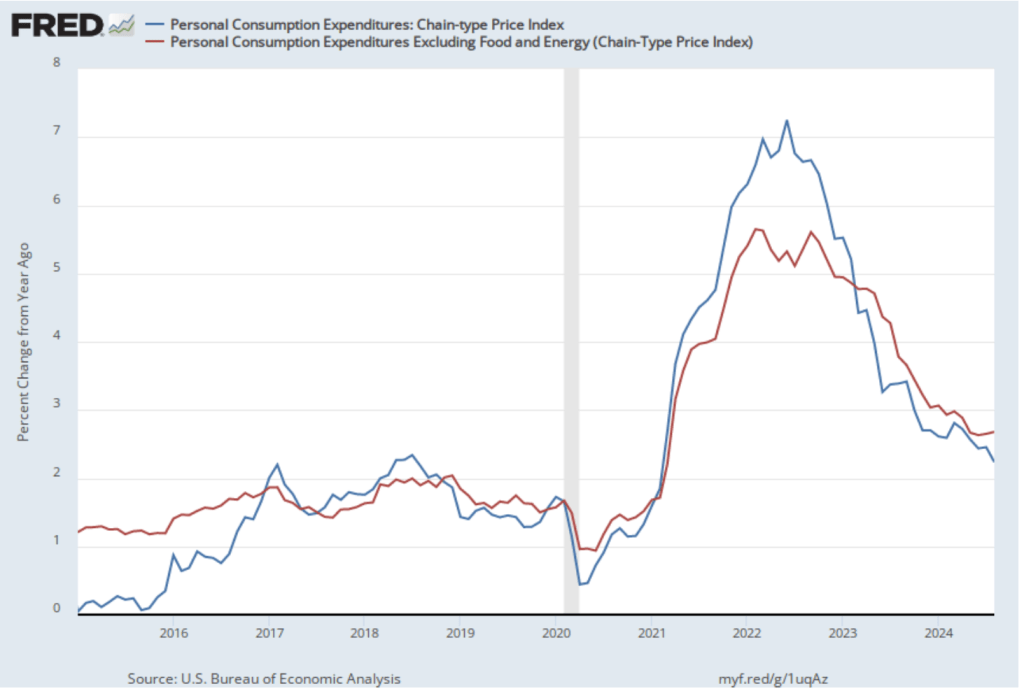
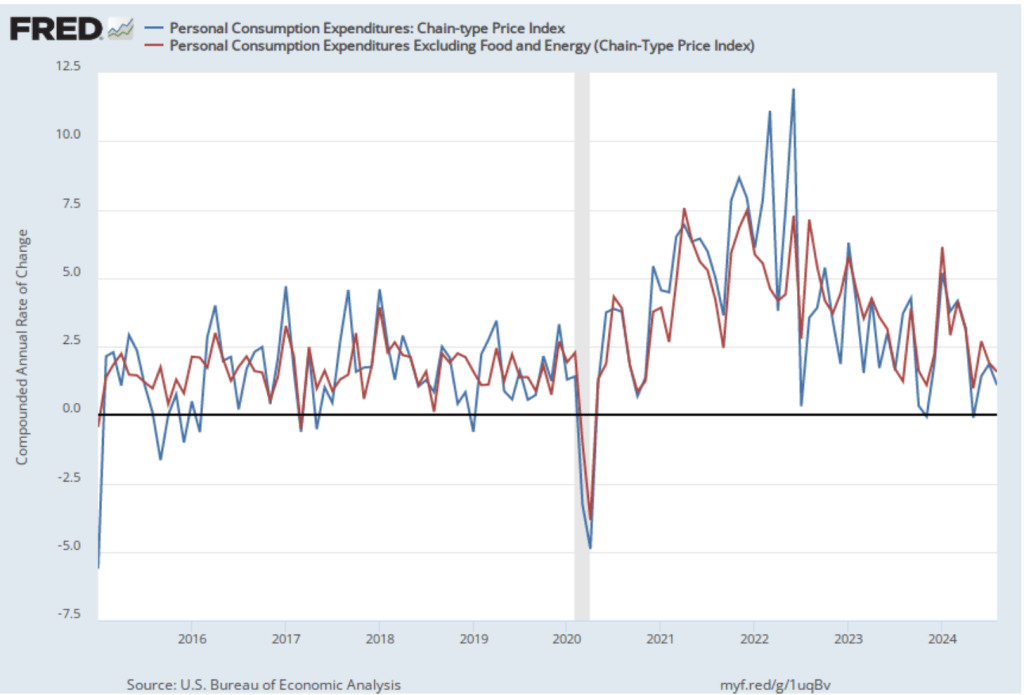
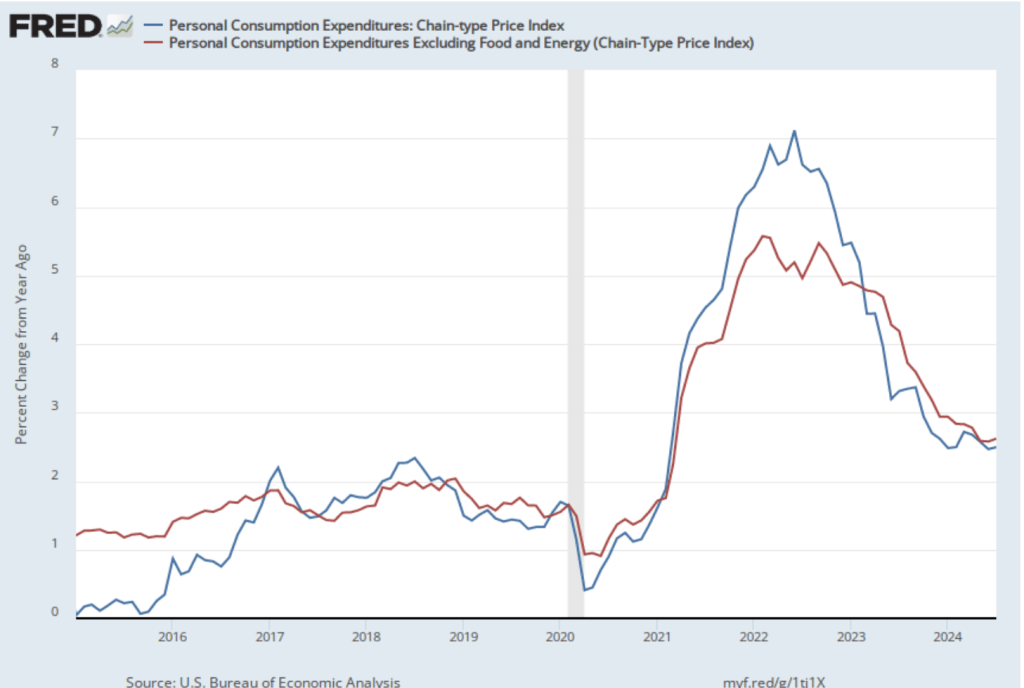
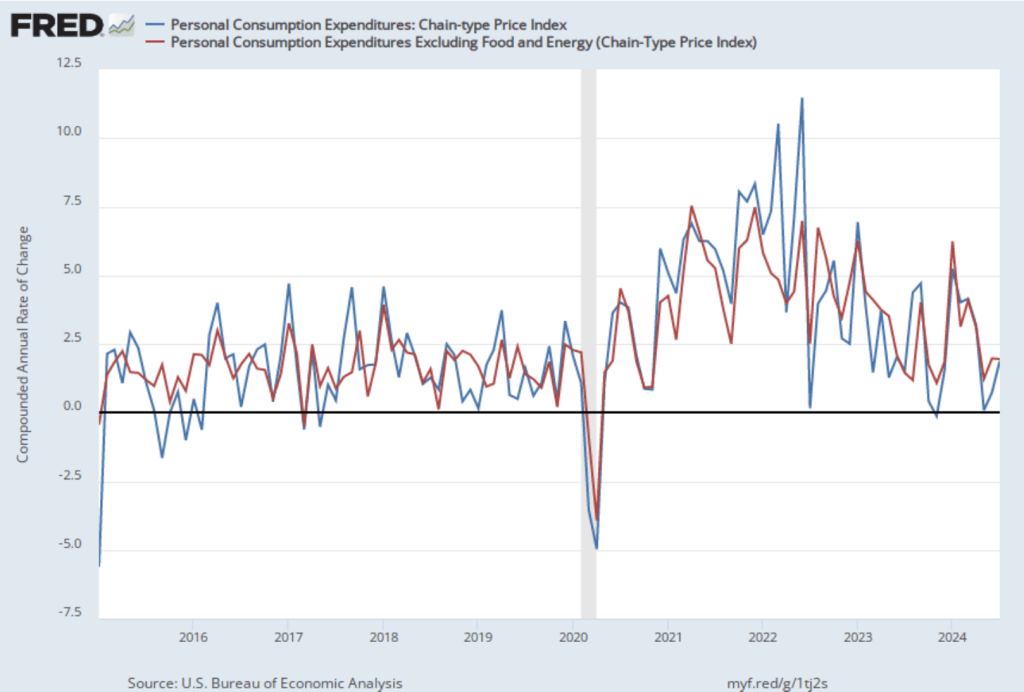
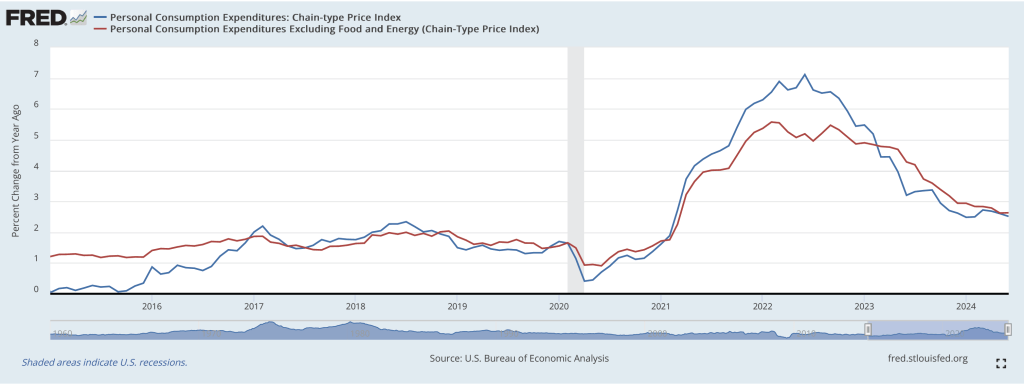
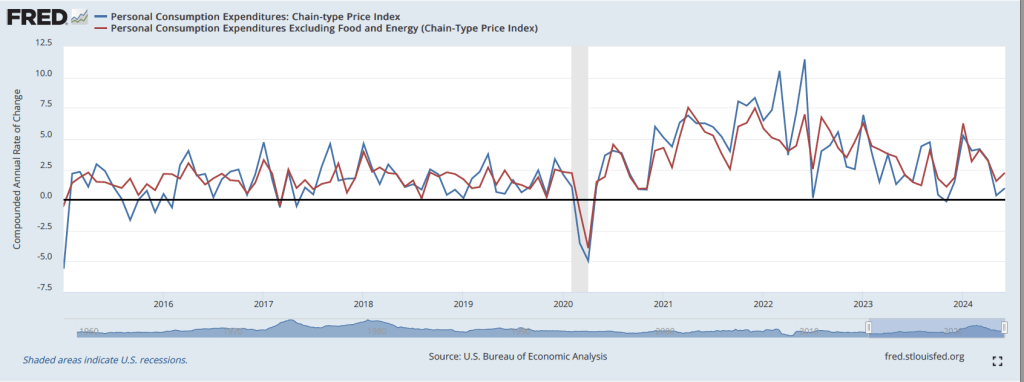
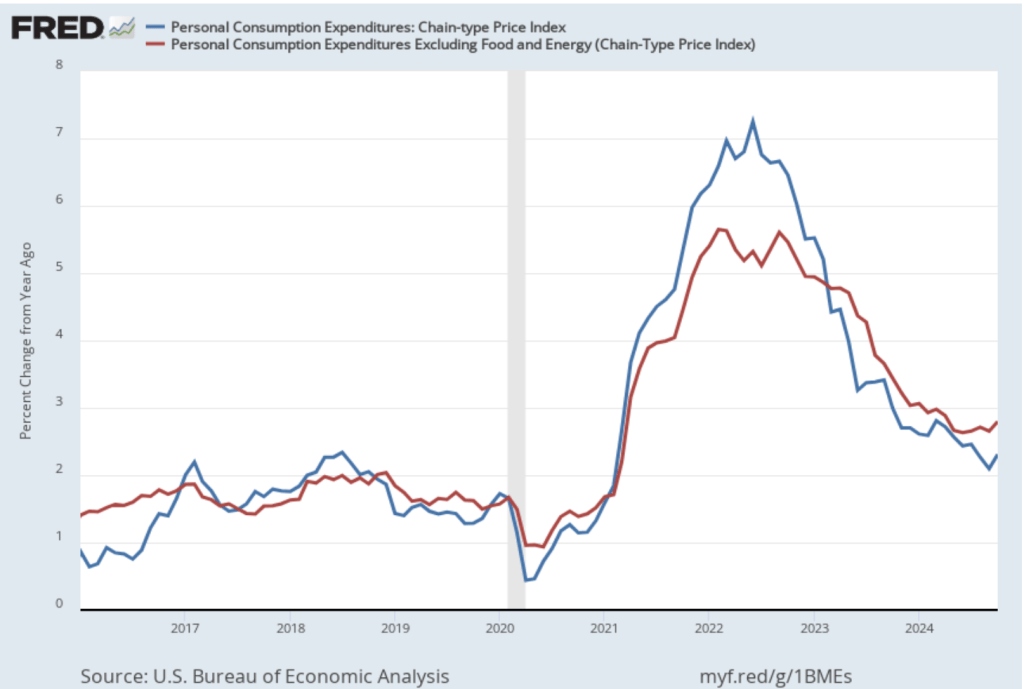
The following figure shows PCE inflation (blue line) and core PCE inflation (red line)—which excludes energy and food prices—for the period since January 2016 with inflation measured as the percentage change in the PCE from the same month in the previous year. Measured this way, in October, PCE inflation (the blue line) was 2.3 percent, up from 2.1 percent in September. Core PCE inflation (the red line) in October was 2.8 percent, up from 2.7 percent in September. Both PCE inflation and core PCE inflation were in accordance with the expectations of economists surveyed.
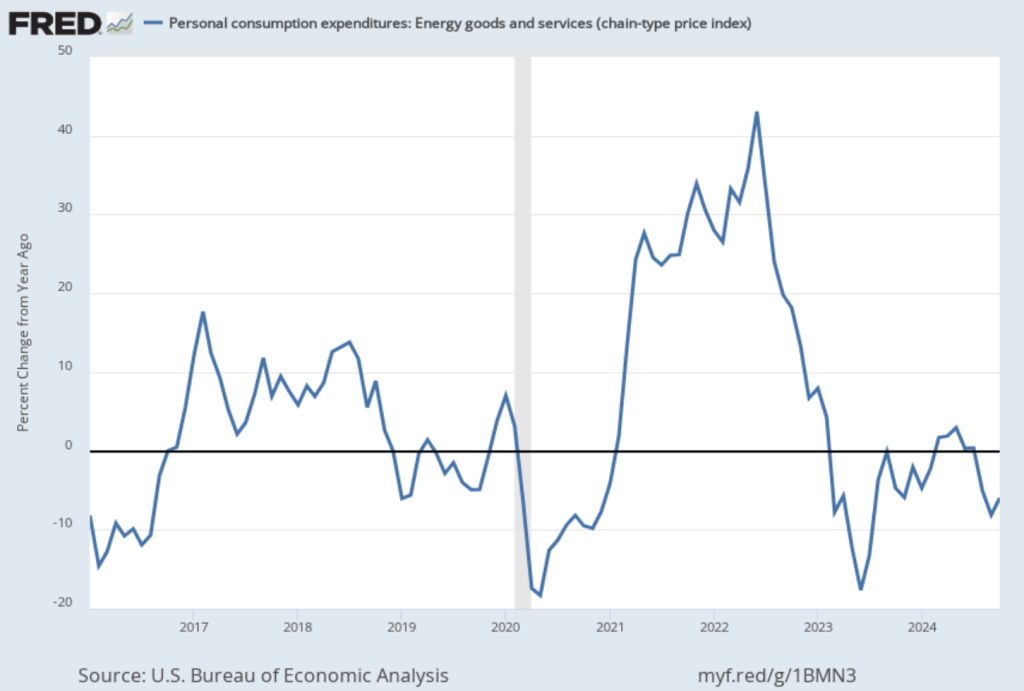
One reason that PCE inflation has been lower than core PCE inflation in recent months is that PCE inflation has been held down by falling energy prices, as shown in the following figure. Energy prices have been falling over the last three months and were down 5.9 percent in October. It seems unlikely that falling energy prices will persist.
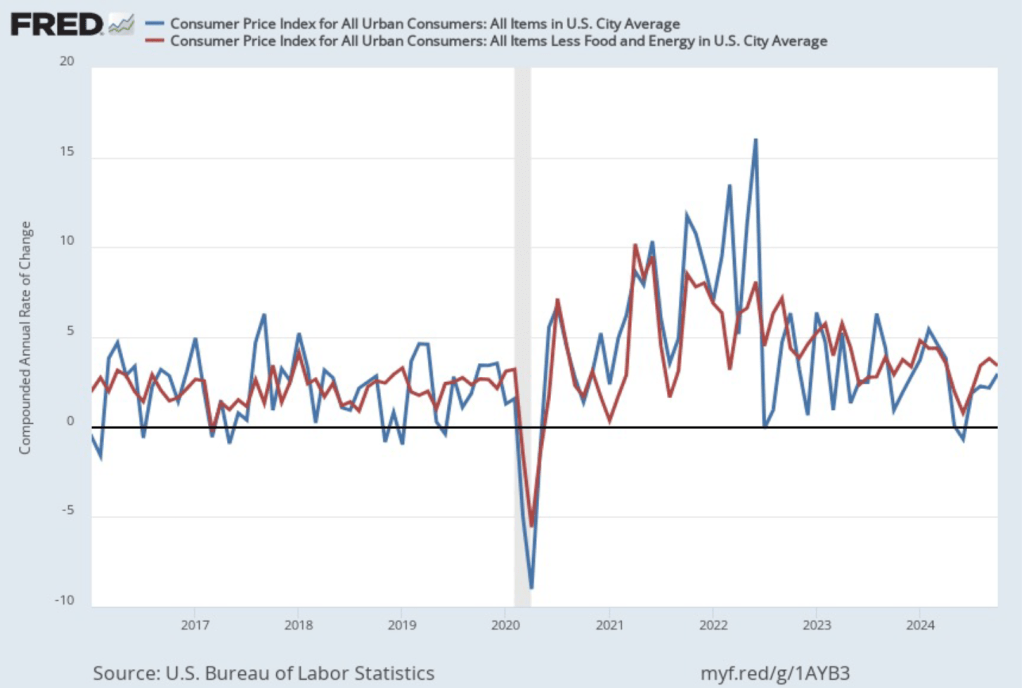
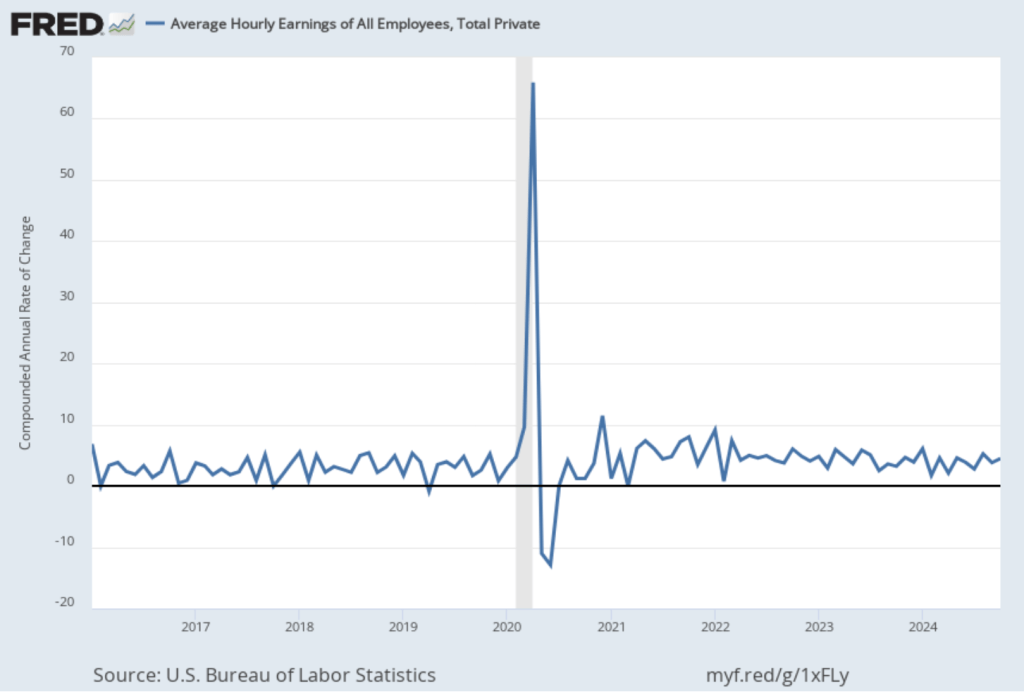
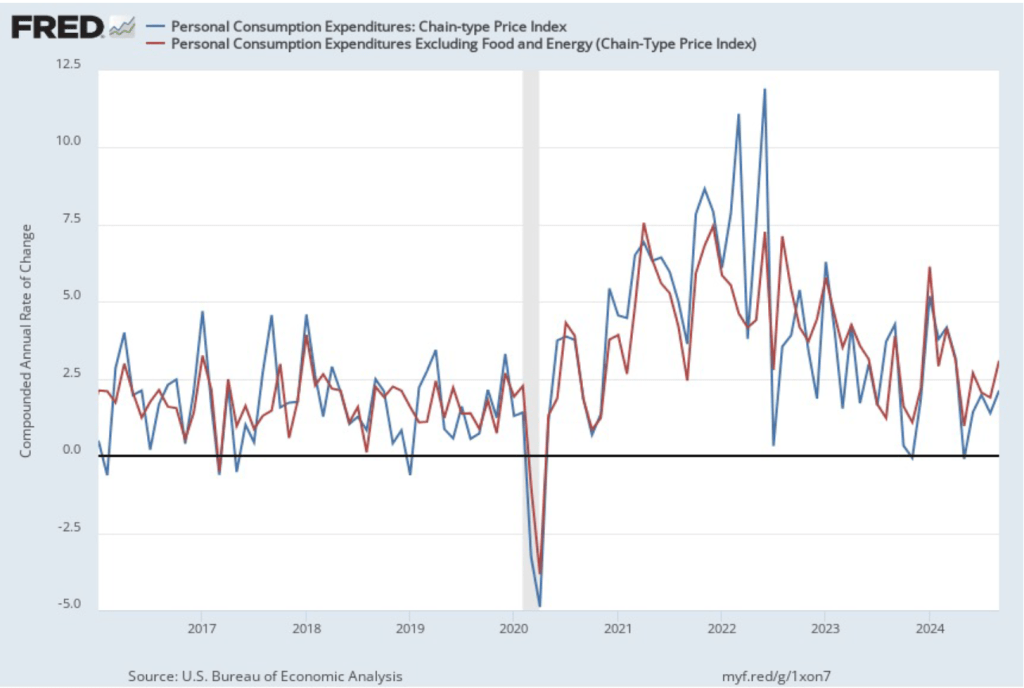
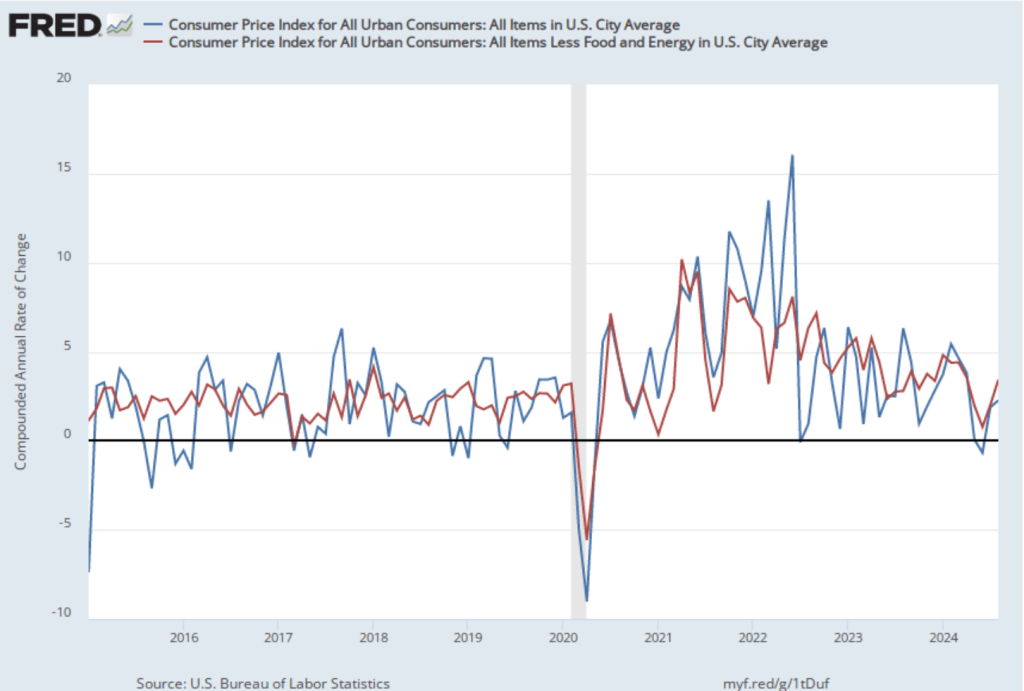
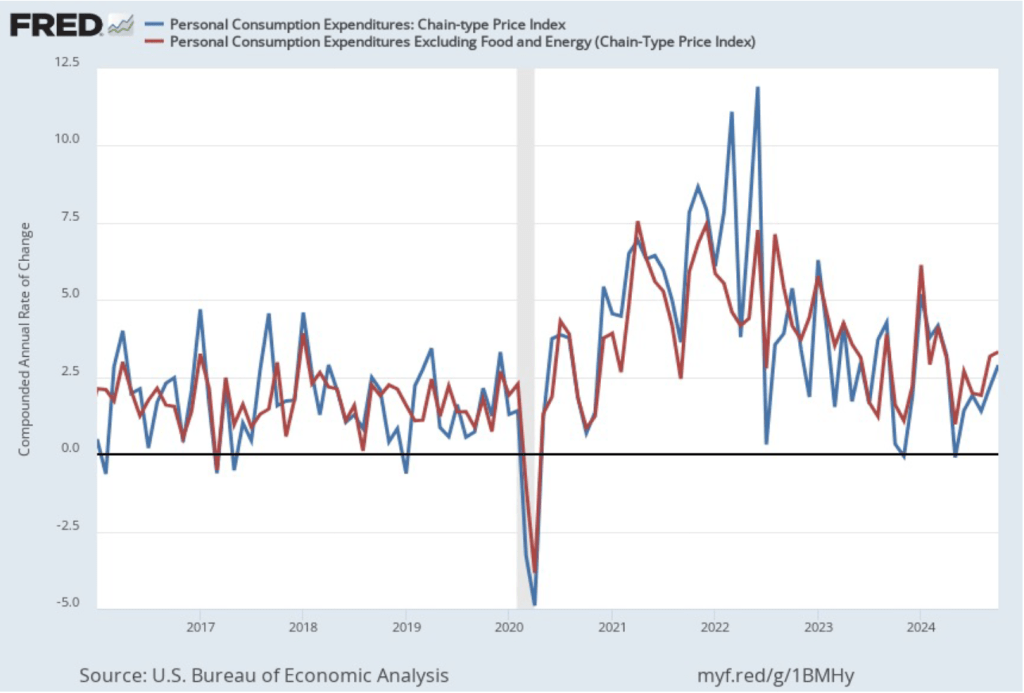
The following figure shows PCE inflation and core PCE inflation calculated by compounding the current month’s rate over an entire year. (The figure above shows what is sometimes called 12-month inflation, while this figure shows 1-month inflation.) Measured this way, PCE inflation rose in October to 2.9 percent from 2.1 percent in September. Core PCE inflation rose from 3.2 percent in September to 3.3 percent in October. Because core inflation is generally a better measure of the underlying trend in inflation, both 12-month and 1-month core PCE inflation indicate that inflation may still run well above the Fed’s 2 percent target in coming months. But the usual caution applies that data from one month shouldn’t be overly relied on.
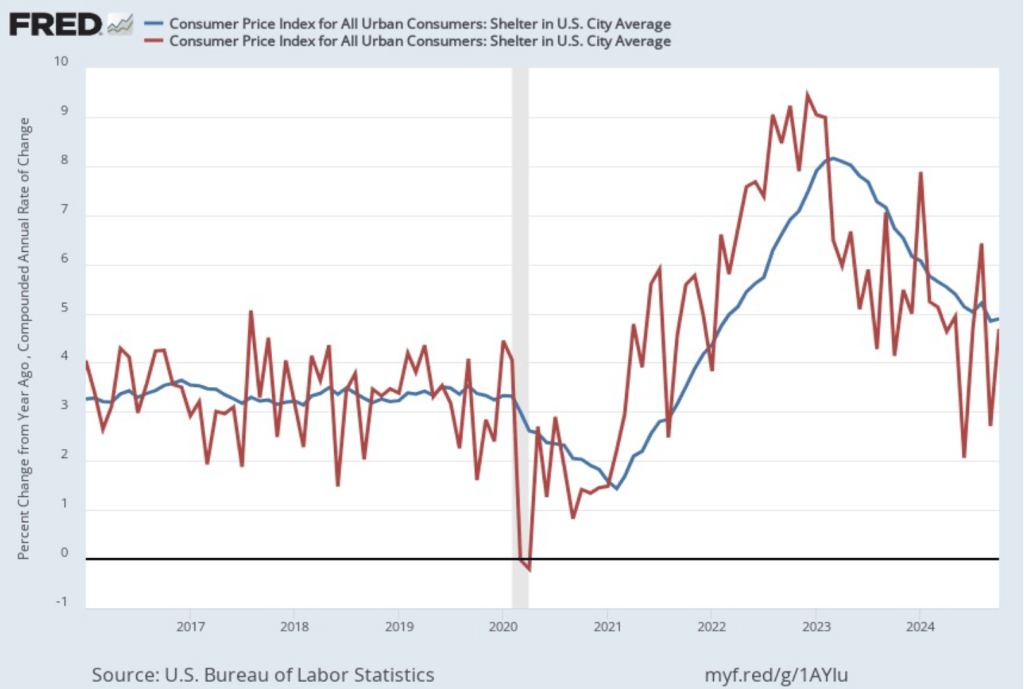
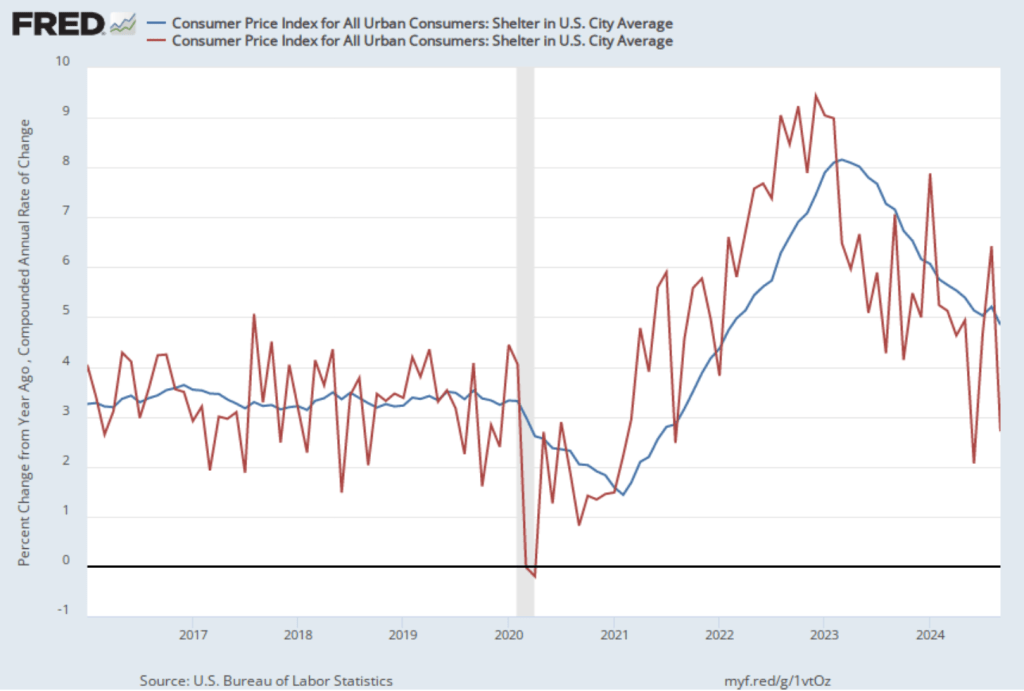
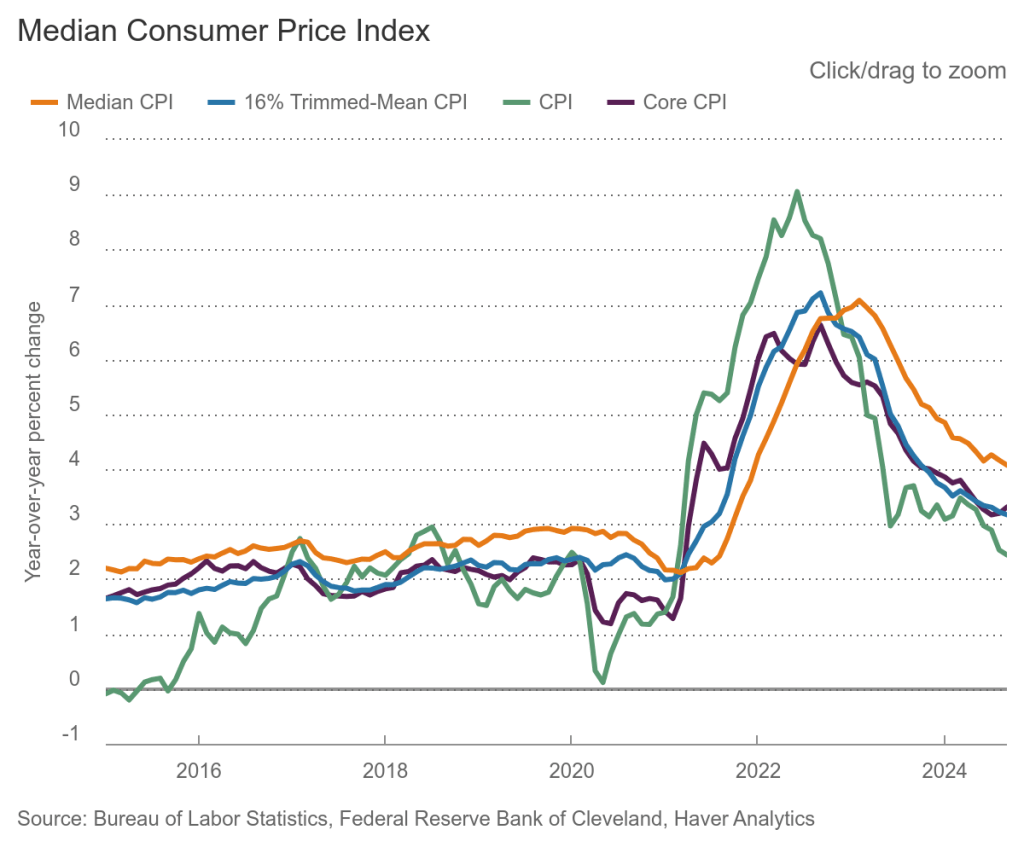
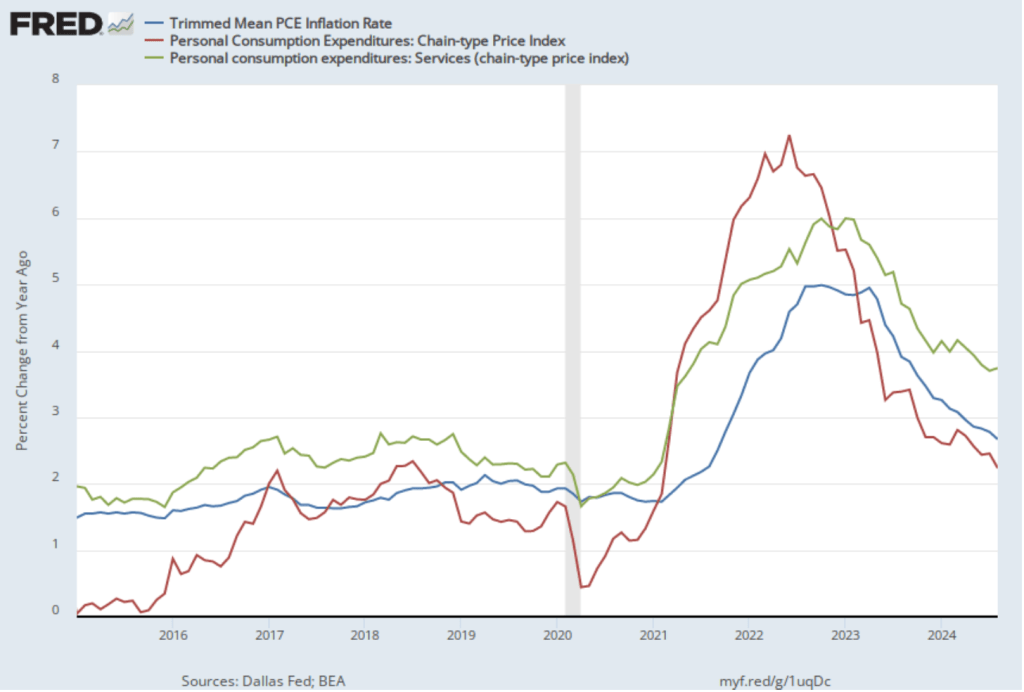
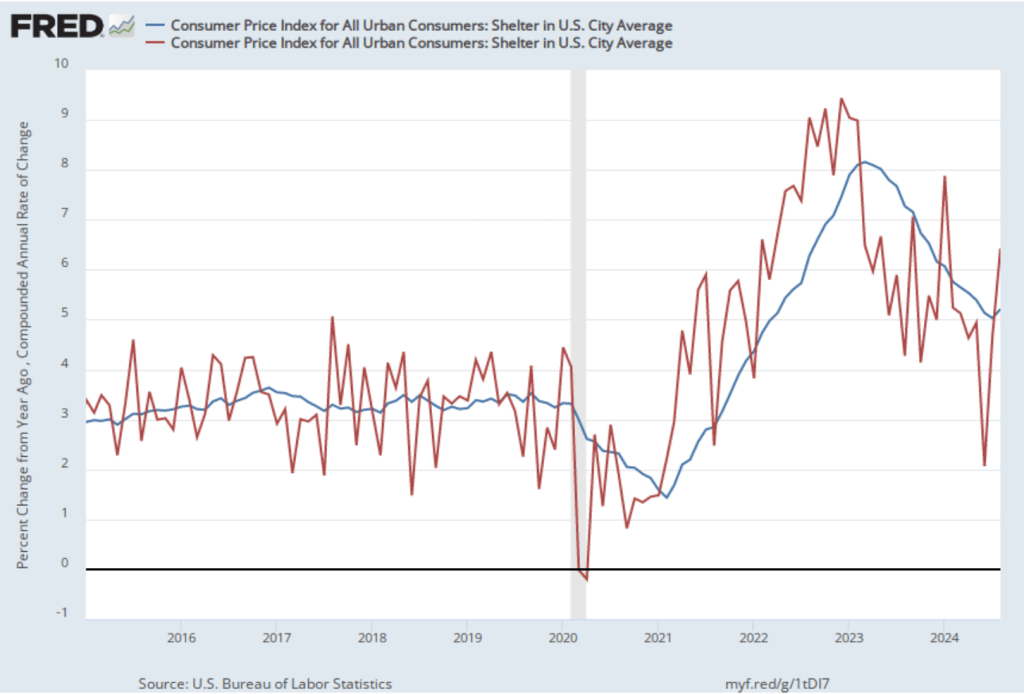
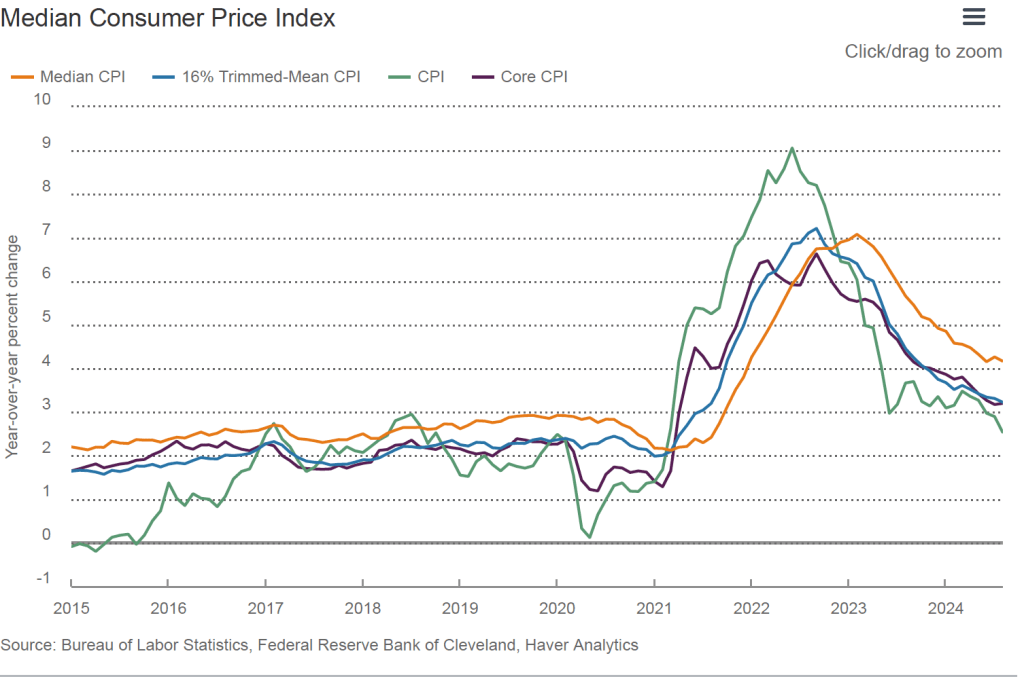
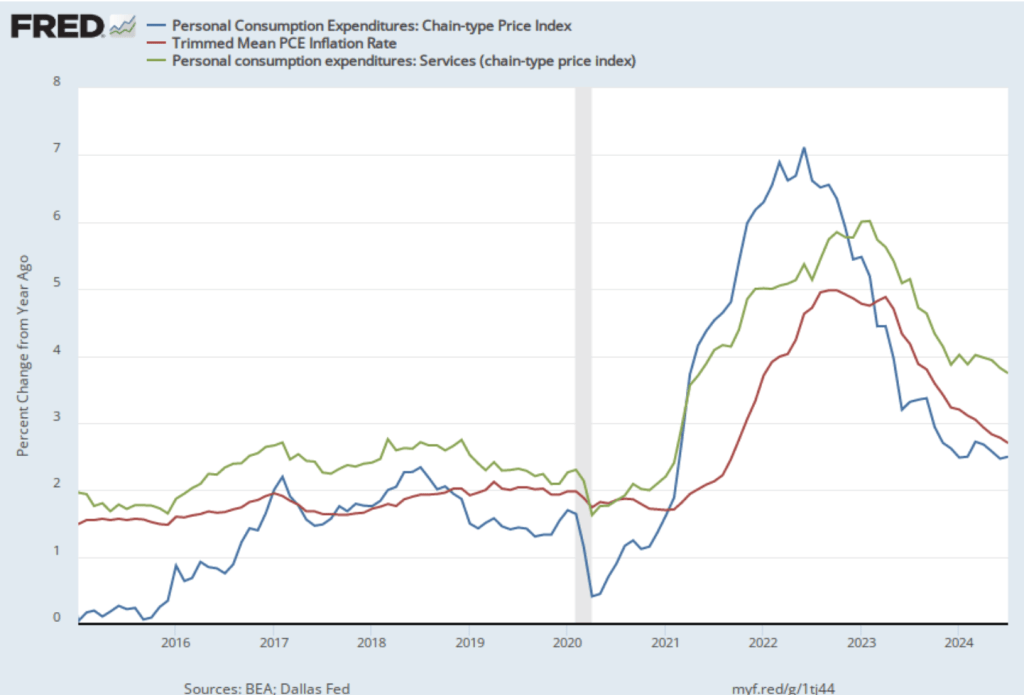
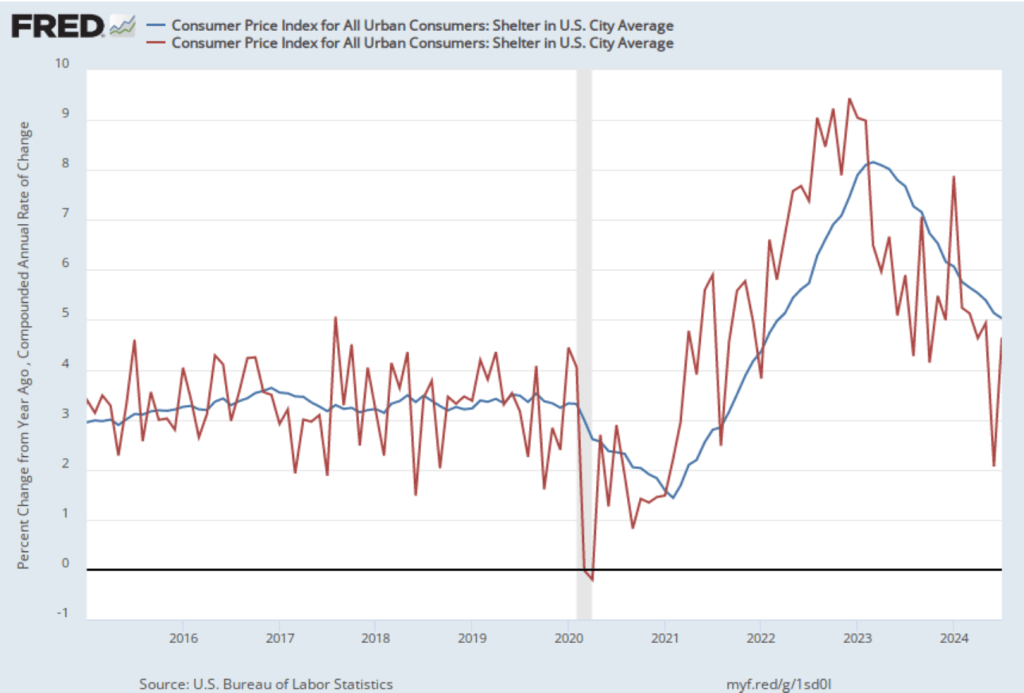
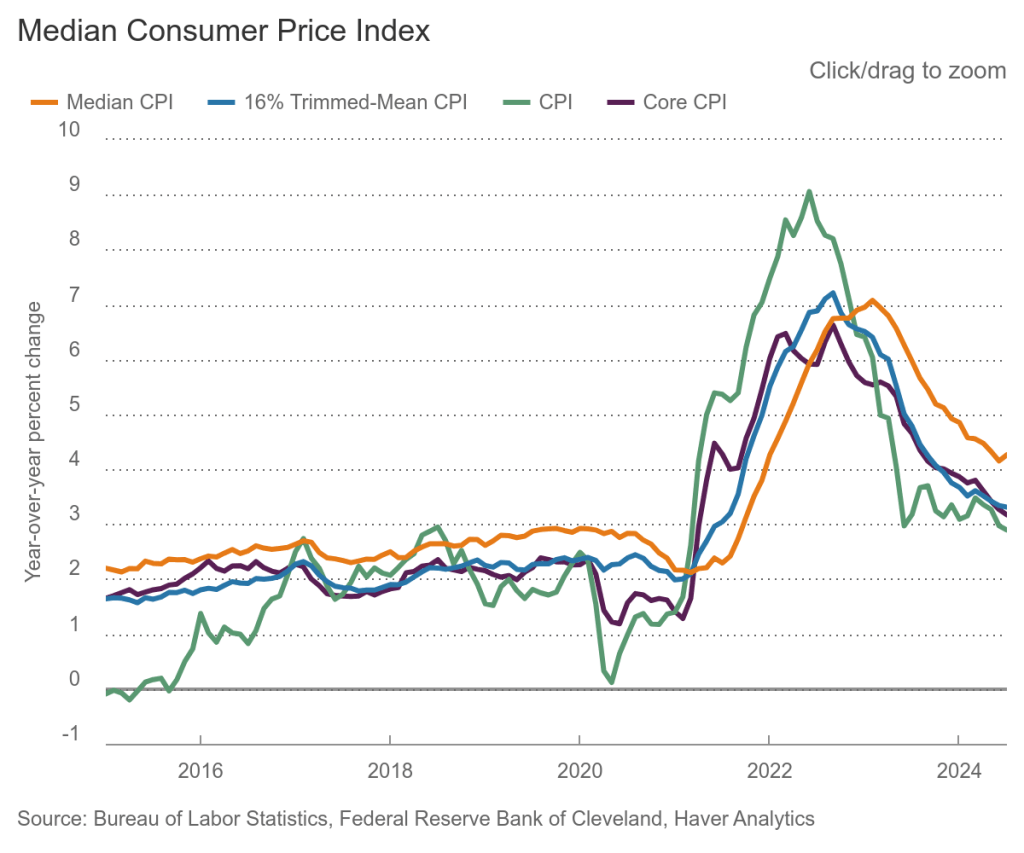
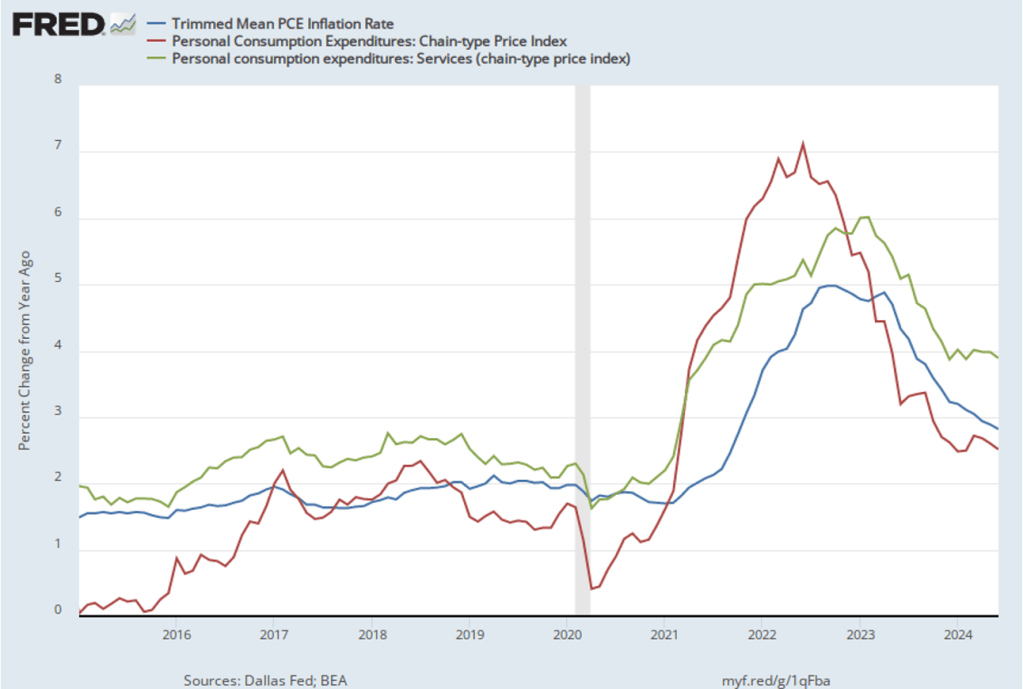
The following figure shows other ways of gauging inflation by including the 12-month inflation rate in the PCE (the same as shown in the figure above—although note that PCE inflation is now the red line rather than the blue line), inflation as measured using only the prices of the services included in the PCE (the green line), and core inflation, excluding the price of housing services as well as the prices of food and energy (the blue line). Fed Chair Jerome Powell and other members of the Federal Open Market Committee (FOMC) have said that they are concerned by the persistence of elevated rates of inflation in services and in housing.
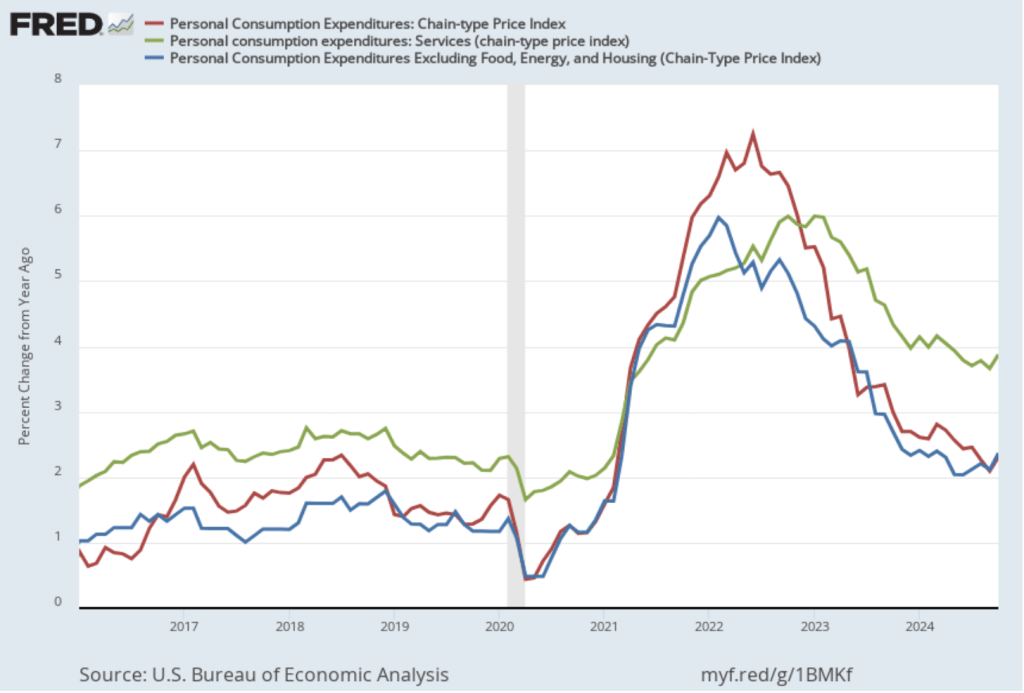
Inflation in services remained high, increasing from 3.7 percent in September to 3.9 percent in October. Core inflation, measured by excluding housing as well as food and energy, increased from 2.1 percent in September to 2.4 percent in October.
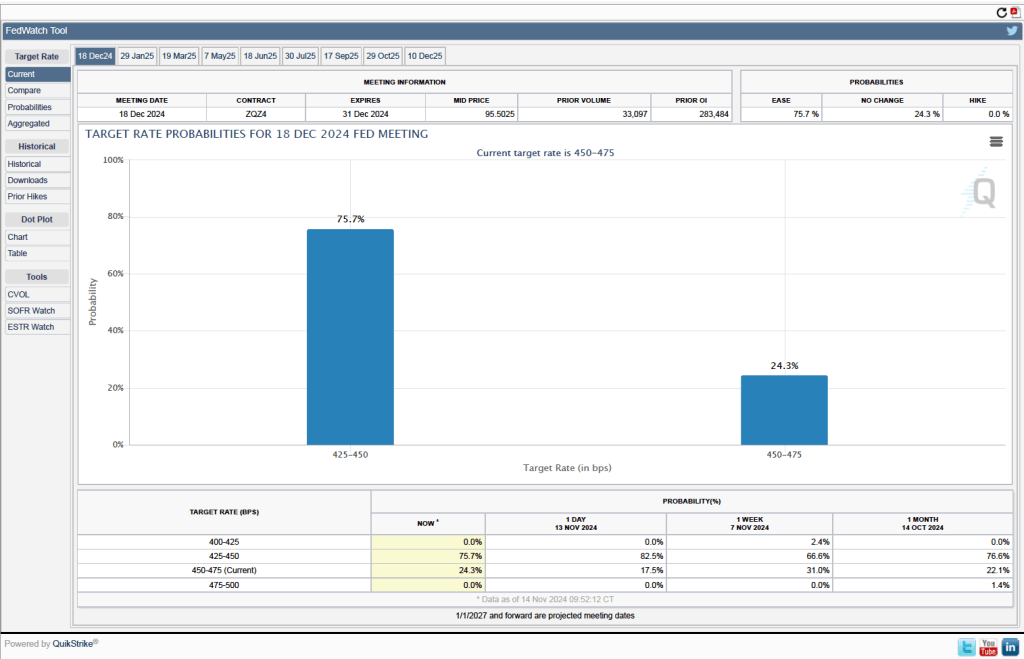
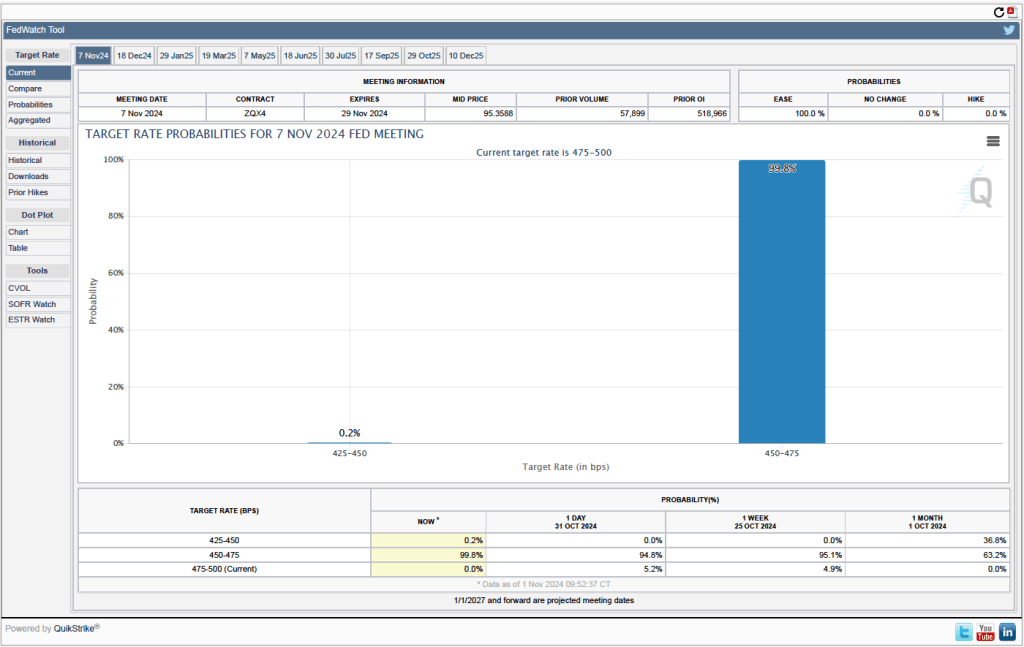
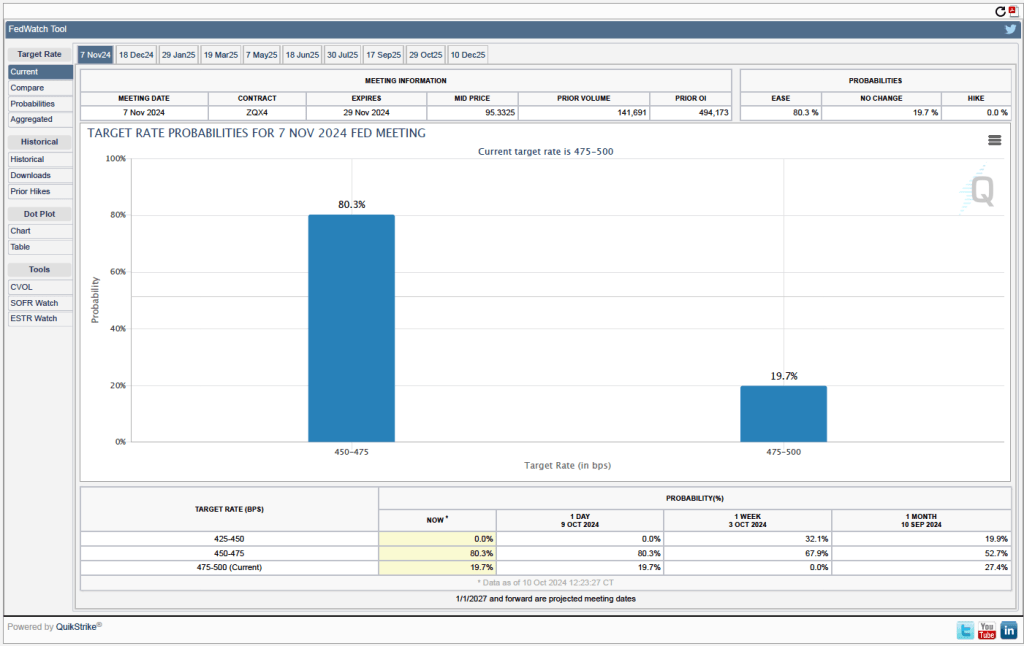
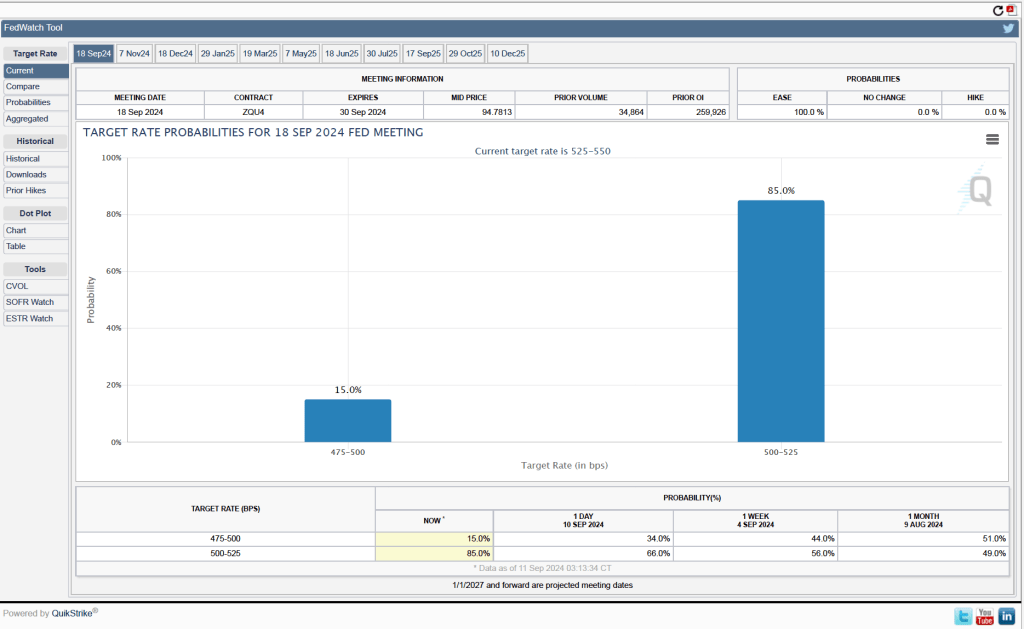
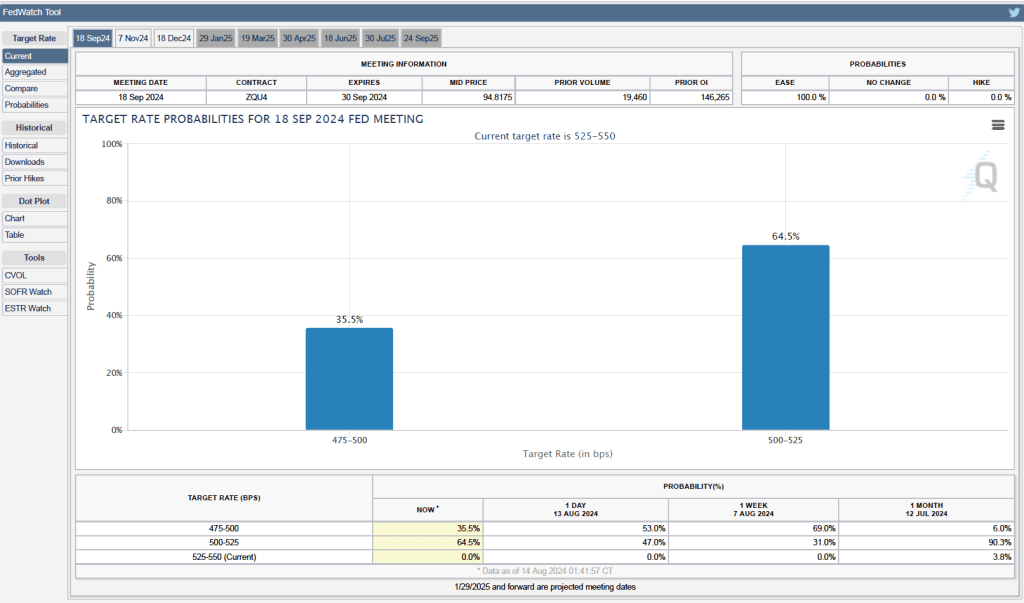
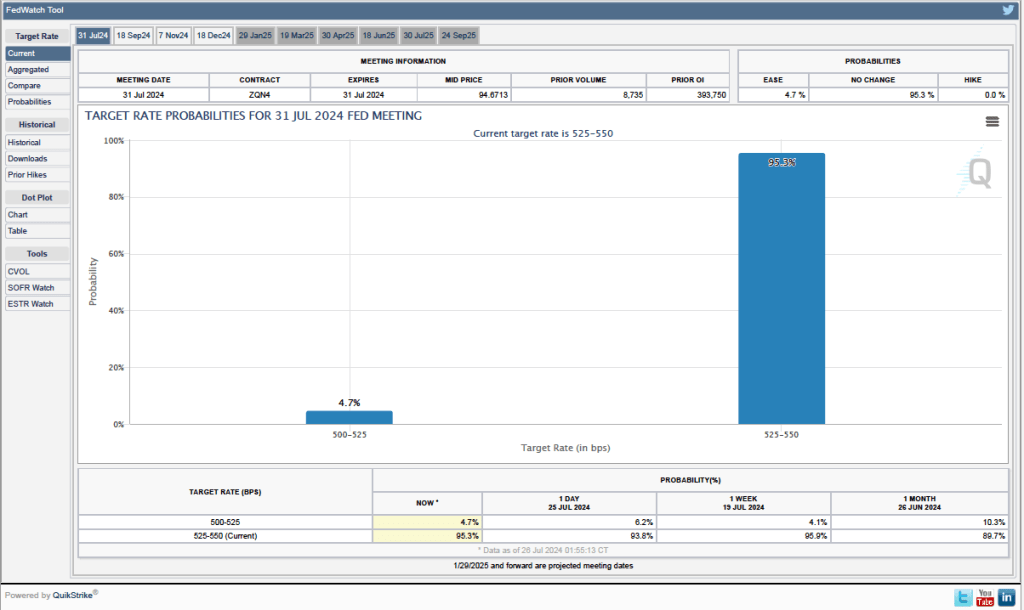
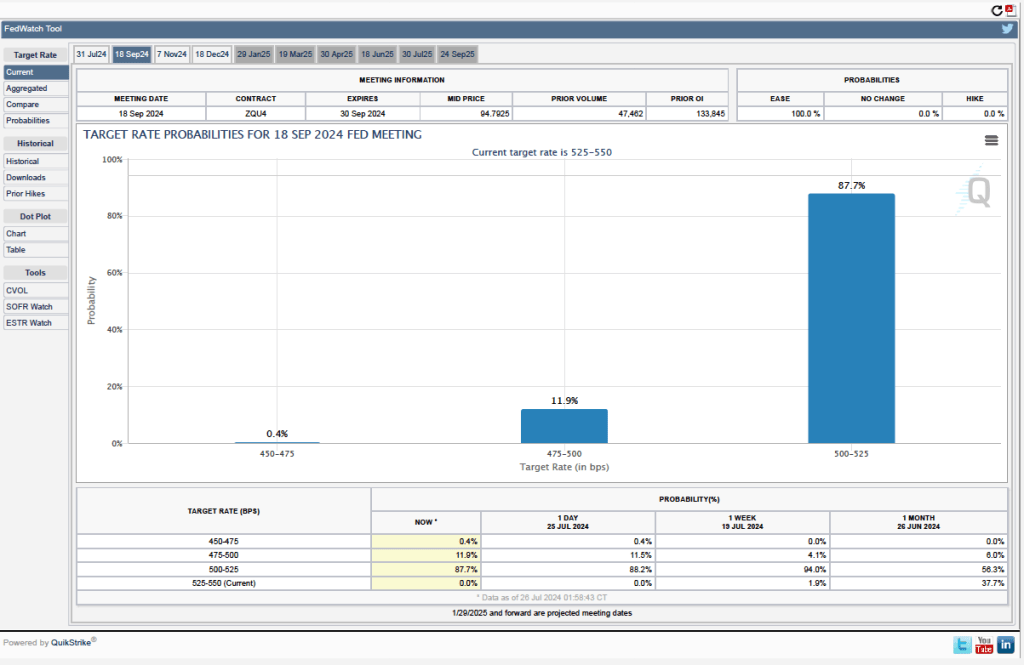
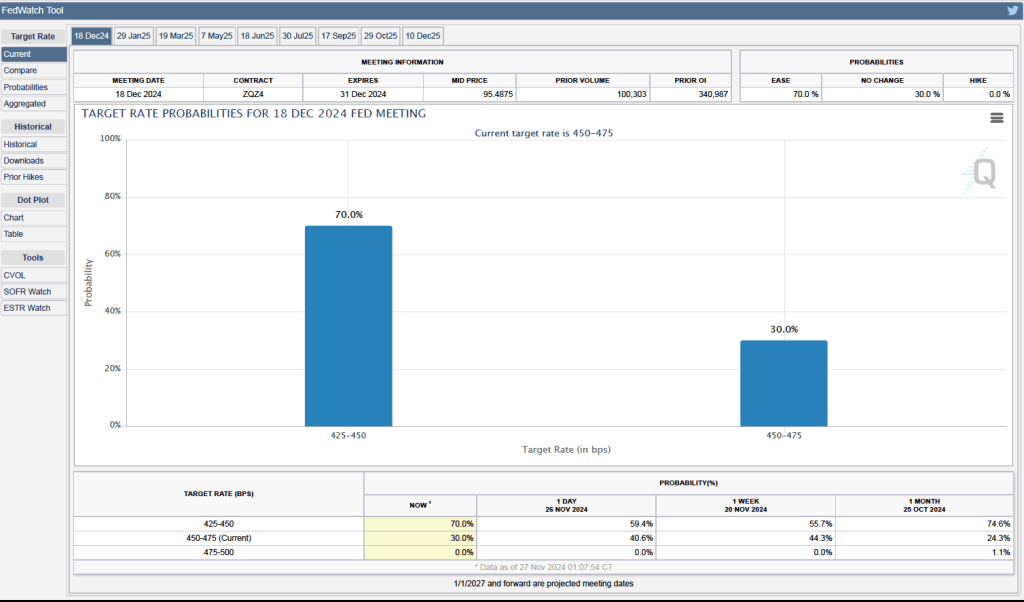
Some Fed watchers have suggested that higher inflation readings may lead he Fed’s policymaking Federal Open Market Committee (FOMC) to leave its target for the federal funds rate unchanged at its next meeting on December 17-18. As of today, however, investors who buy and sell federal funds futures contracts are still expecting that the FOMC will reduce its target by 0.25 percent (25 basis points) at its next meeting. (We discuss the futures market for federal funds in this blog post.) As shown in the following figure, investors assign a probability of 70 percent to the FOMC cutting its target for the federal funds rate from the current range of 4.50 percent to 4.75 percent to a range of 4.25 percent to 4.50 percent. Investors assign a probability of only 30 percent to the FOMC leaving its target unchanged.
Since the FOMC began increasing the target for the federal funds rate in the spring of 2022, economists have discussed three possible outcomes of the Fed’s monetary policy:
- A hard landing, with the economy only returning to the Fed’s 2 percent inflation target if the U.S. economy experiences a recession
- A soft landing, with the economy returning to 2 percent inflation without experiencing a recession.
- No landing, with the economy not experiencing a recession but with inflation remaining persistently above the Fed’s 2 percent target.
With GDP and employment data showing no indication that a recession will begin soon and with today’s data showing inflation—while having declined substantially from its mid-2022 peak—remaining above the Fed’s 2 percent target, the chances of the no landing outcome seem to be increasing.