It’s not surprising that employment in health care has been increasing. The National Health Expenditure (NHE) Projections Model of the Centers for Medicare & Medicaid Services estimates that the long-run income elasticity of demand for private personal health care spending is 1.58. So, a 10 percent increase in U.S. disposable personal income will result in the long run in a 15.8 percent increase in private personal health care spending. In other words, we would expect personal health care spending to become an increasing fraction of total household spending. In addition, the median age of the U.S. population has increased from 32.9 years in 1990 to a projected 40.1 years in 2025. As people age, their demand for health care increases. Finally, holding income and age constant, demand for health care has also increased as a result of the increasing effectiveness of medical care in treating disease.
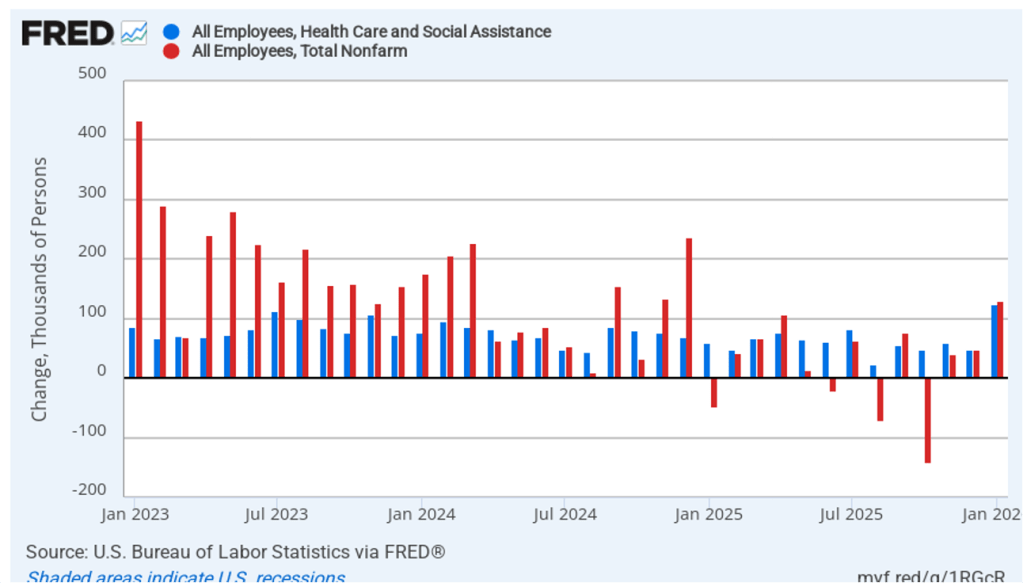
Despite these long-run trends, it’s surprising how dependent increases in U.S. employment have become recently on the growth in health care jobs. The following figure shows monthly changes in a broad measure of health care employment (the blue bars) and in total nonfarm employment (the red bars), using data from the establishment survey from the Bureau of Labor Statistics (BLS). (This blog post yesterday discussed the latest “Employment Situation” report from the BLS.)
The values for January 2023 through December 2024 show what we might expect—the increase in total employment being significantly larger than the increase in health care employment. During this period, health care employment was about 48.5 percent of total employment. In other words, although health care employment was a key driver of increases in employment, non-health care employment was also steadily increasing. The situation since January 2025 is much different with health care employment increasing by 817,000, while total employment increased by only 311,000. In other words, since January 2025, employment outside of health care (again, broadly defined) has fallen by more than 500,000 jobs.
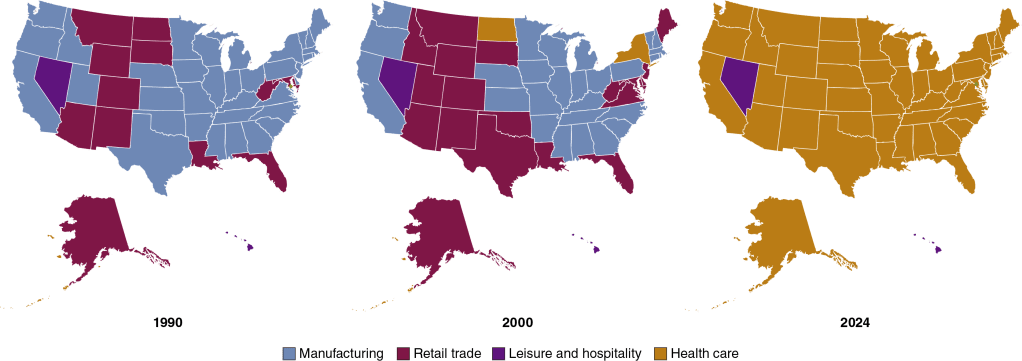
We can look at longer term trends in health care employment relative to employment in other industries. The following maps show the change over time in the industry with the most employment in each state, using data from the BLS’s “Quarterly Census of Employment and Wages.” The industries are grouped into four broad categories: manufacturing, retail trade, leisure and hospitality, and health care. (Industries are defined as follows using the North American Industry Classification System (NAICS): Manufacturing is NAICS 31–33, Retail trade is NAICS 44–45, Leisure and hospitality is NAICS 72, and health care is NAICS 62.)
In 1990, manufacturing was the largest source of private employment in most states, and in no state was health care the largest employer. By 2000, manufacturing was still the largest employer in 27 states, but health care had become the largest employer in 2 states. The results for 2024 are strikingly different: Manufacturing was no longer the largest employer in any state, and health care was the largest employer in 48 states—every state except for Hawaii and Nevada.
In 1990, almost twice as many people in the United States worked in manufacturing as worked in health care. In 2024, employment in health care was 80 percent greater than employment in manufacturing. And these trends are likely to continue. The BLS forecast in 2025 that 12 of the 20 fastest-growing occupations over the next 10 years will be in health care.
Supports:Microeconomics and Economics, Chapter 6, and Essentials of Economics, Chapter 7, Section 7.5-7.7
ChatGTP-4o image of cars in the Lincoln Tunnel, which connects New Jersey with midtown Manhattan.
In January 2025, New York City began enforcing congestion pricing in the borough of Manhattan south of 60th Street—the congestion relief zone. The Metropolitan Transportation Authority (MTA) in New York collects a toll from a vehicle entering that zone either automatically using the vehicle’s E-ZPass transponder or by reading the vehicle’s license plate and mailing a bill to the vehicle’s owner. Nobel Laureate William Vickrey of Columbia University first proposed congestion pricing in the 1950s as a way to deal with the negative externalities from traffic congestion. Congestion pricing acts as a Pigovian tax that internalizes the external costs drivers generate by using streets in congested areas. (We discuss Pigovian taxes in Microeconomics and Economics, Chapter 5, Section 5.3, and in Essentials of Economics, Chapter 4, Section 4.3.)
The New York City congestion toll is somewhat complex, varying according to the type of vehicle and how the vehicle enters the area in which the toll applies. The congestion toll fora car entering Manhattan through the Lincoln Tunnel on a weekday between 5 am and 9 pm is $6.00 on top of the existing toll of $16.06. In January 2025, the volume of cars driving through the Lincoln Tunnel declined by 8 percent during the weekday hours of 5 am to 9 pm. According to an article in Crain’s New York Business, the number of vehicles entering the congestion relief zone compared with the same month in the previous year declined by 8 percent in January, 12 percent in February, and 13 percent in March.
From the information given, can we determine the price elasticity of demand for entering Manhattan by driving though the Lincoln Tunnel during weekdays from 5am to 9am? Briefly explain.
Suppose someone makes the following claim: “Because the quantity of cars using the Lincoln Tunnel has declined by 8 percent, we know that the MTA must have collected less revenue from cars using the tunnel than before the congestion toll was imposed.” Briefly explain whether you agree.
Is the pattern of increasing percentage declines in vehicle traffic in the congestion relief zone each month from January to March what we would expect? Be sure your answer refers to concepts related to the price elasticity of demand.
Step 1: Review the chapter material. This problem is about the price elasticity of demand, so you may want to review Chapter 6, Sections 6.1-6.4.
Step 2: Answer part (a) by explaining whether from the information given we can determine the price elasticity of demand for entering Manhattan by driving through the Lincoln Tunnel. We do have sufficient information to determine the price elasticity, provided that nothing else that would affect the demand for driving through the Lincoln Tunnel changed during January. We’re told the percentage change in the quantity demand, so we need only to calculate the percentage change in the price to determine the price elasticity. The change in the price is the $6 congestion toll. The average of the price before and the price after the toll is imposed is ($16.06 + $22.06) = $19.06. Therefore, the percentage change in the price is ($6/$19.06) × 100 = 31.5 percent. The price elasticity of demand is equal to the percentage change in quantity dmanded divided by the percentage change in price: –6%/31.5% = –0.3. Because this value is less than 1 in absolute value, we can conclude that the demand for driving through the Lincoln Tunnel is price inelastic.
Step 3: Answer part (b) by explaining whether because the quantity of cars driving through the Lincoln Tunnel has declined the MTA must have collected less revenue from cars using the tunnel. As shown in Section 6.3 of the textbook, total revenue received will fall after a price increase only if demand is price elastic. In this case, demand is price inelastic, so the total revenue the MTA collects from cars using the Lincoln Tunnel will rise, not fall.
Step 3: Answer part (c) by explaining whether the pattern of increasing percentage declines in vehicle traffic in the congestion relief zone is one we would expect. In Section 6.2, we see that the passage of time is one of the determinants of the price elasticity of demand. The more time that passes, the more price elastic the demand for a product becomes. In other words, the longer the time that people have to adjust to the congestion toll—by, for instance, taking a bus rather than driving through the Lincoln Tunnel in a car—the more likely it is that people will decide not to drive into the congestion relief zone. So, it is not surprising that the number of vehicles entering the congestion relief zone declined by a greater percentage each month from January to March.
Image generated by ChatGTP-4o of new cars on a dealer’s lot.
This afternoon (April 2), President Donald Trump announced a sweeping increase in tariff rates on imported goods. The increases were by far the largest since the Smoot-Hawley Tariff of 1930. The United States will impose 10 percent across-the-board tariff on all imports, with higher tariffs being imposed on individual countries. Taking into account earlier tariffs, Chinese imports will be subject to a 54 percent tariff. Imports from Vietnam will be subject to a 46 percent tariff, and imports from the countries in the European Union will be subject to a 20 percent tariff.
President Trump’s objectives in imposing the tariffs aren’t entirely clear because he and his advisers have emphasized different goals at different times. The most common objectives the president and his advisers have offered for the tariff increases are these three:
To increase the size of the U.S. manufacturing sector by raising the prices of imported manufactured goods.
To retaliate against barriers that other countries have raised against U.S. exports.
To raise revenue for the federal government.
The effects of the tariffs on the U.S. economy depend in part on whether foreign countries retaliate by raising their tariffs on imports from the United States and on whether, in the future, the president reduces tariffs in exchange for other countries reducing barriers to U.S. imports. For a background discussion of tariffs, see this post. Glenn and Tony discuss tariffs in this podcast, which was recorded on Friday afternoon (March 28). A discussion of the Smoot-Hawley Tariff can be found here.
The following Solved Problem looks at one aspect of the effects of a tariff increase.
Supports:Microeconomics and Economics, Chapter 6, Section 6.3.
Nearly every automobile assembled in the United States contains at least some imported parts. An article on axis.com made the following statement about the effect on U.S. automobile manufacturers of an increase in the tariff on imported auto parts: “If car prices [in the United States] go up, Americans will buy fewer of them, meaning less revenue ….” What assumption is the author of this article making about the demand for new automobiles in the United States?
Solving the Problem
Step 1: Review the chapter material. This problem is about the effect of price increases on a firm’s revenue, so you may want to review the section “The Relationship between Price Elasticity of Demand and Total Revenue.”
Step 2: Answer the question by explaining what must be true of the demand for new automobiles in the United States if an increase in automobile prices results in a decline in the revenue received by automobile producers. This section of Chapter 6 explains how the price elasticity of demand affects the revenue a firm receives following a price increase. A price increase, holding everything else constant that affects the demand for a good, always causes a decline in the quantity demanded. If demand is price inelastic, an increase in price will result in an increase in revenue because the percentage decline in quantity demanded will be smaller than the percentage increase in the price. If demand is price elastic, an increase in price will result in a decrease in revenue because the percentage decline in the quantity demanded will be larger than the percentage increase in price. We can conclude that the author of the article must be assuming that the demand for new automobiles in the United States is price elastic.
The pool at the All-Star Movie resort at Walt Disney World in Orlando, Florida (Photo from touringplans.com)
A recent article in the Wall Street Journal has the headline “Even Disney Is Worried About the High Cost of a Disney Vacation.” According to the article, “Some inside Disney worry that the company has become addicted to price hikes and has reached the limits of what middle-class Americans can afford ….”
As we discuss in Microeconomics, Chapter 15, the Walt Disney Company engages in price discrimination in a number of ways, by, for instance, charging more for ticket prices to its theme parks during the end-of-year holidays than on other days. Disney also offers hotels at different price levels, ranging from deluxe hotels like the Grand Floridian to more basic value hotels like the All-Star Movie Resort. In the case of hotels, some of the price difference is explained by differences in operating cost. Luxury hotels tend to have more amenities, including larger pools and restaurants on site, which raises their costs. Part of the difference in price, though, is the result of Disney estimating that people with higher incomes have a more inelastic demand for hotels than do people with lower incomes.
The Wall Street Journal article relies in part on data provided by Len Testa on his site touringplans.com. He notes that between 2018 and 2025, the percentage increase in the price Disney charged for staying at a value resort was less than the rate of inflation. In other words, the real price—the nominal price corrected for the effects of inflation—of staying at a Disney value resort decreased during that period. On the other hand, the percentage increase in the price Disney charged for staying at a deluxe was more than the rate of the inflation. So, the real price of staying at a Disney deluxe resort increased during this period.
One interpretation of these data is that over this period, Disney increased the extent of the price discrimination it was practicing with respect to hotel prices. It increased the gap between the price the families with more inelastic demand for Disney hotels pay and the price families with more elastic demand for Disney hotels pay. The article quotes Josh D’Amaro, who is the Disney executive in charge of the company’s theme parks, as saying “we intentionally offer a wide variety of ticket, hotel and dining options to welcome as many families as possible, whatever their budget.”
Supports: Microeconomics and Economics, Chapter 6, and Essentials of Economics, Chapter 7.
Photo from the New York Times.
An article in the Wall Street Journal reported that Starbucks during certain periods is cutting by 50 percent the prices of many of its coffees, including its Frappuccino. The article also noted that: “Many restaurant chains are pumping out new deals this year in a bid to reverse weak traffic.” The article also quoted a Starbucks spokesman as saying that Starbucks is cutting prices “to ensure that consumers who are facing a challenging economic environment continue to visit its cafes.”
What is Starbucks likely assuming about the price elasticity of demand for Frappuccinos?
Suppose that after cutting its price of Frappuccinos by 50 percent, the quantity of Frappuccinos sold increases by 20 percent. Ignoring any information other than the values of the price cut and the quantity increase, calculate the price elasticity of demand for Frappuccinos. Considering only the value of the price elasticity of demand you calculated, will Starbucks earn more revenue or less revenue from selling Frappuccions as a result of the price cut? Briefly explain.
Suppose that during the time that Starbucks cuts the price of Frappuccinos, competing coffee houses also cut the prices of their coffees. How will this fact affect your answer to part b.? Briefly explain.
Does the fact that, because of inflation, some consumers are facing a “challenging economic environment” affect your answer to part b.? Briefly explain.
Solving the Problem
Step 1: Review the chapter material. This problem is about the determinants of the price elasticity of demand and the effect of the value of the price elasticity of demand on a firm’s revenue following a price change, so you may want to review Chapter 6, Section 6.2 and Section 6.3.
Step 2: Answer part a. by explaining what Starbucks is likely assuming about the price elasticity of demand for Frappuccinos. Starbucks appears to be assuming that the demand for Frappuccions is price elastic, in which case a cut in the price will result in a more than proportional increase in the quantity of Frappuccions demanded.
Step 3: Answer part b. by using the values given to calculate the price elasticity of demand for Frappuccions and explain whether as a result of the price cut Starbucks will earn more or less revenue from selling Frappuccinos.If all other factors affecting the demand for a product are held constant, the price elasticity of demand equals the percentage change in the quantity demanded divided by the percentage change in price. Therefore, in this case the price elasticity of demand for Frappuccinos equals 20%/–50% = –0.4. Therefore, relying just on the information on the changes in the price and quantity demanded, the demand for Frappuccinos is price inelastic. As explained in Section 6.5, when demand is price inelastic, a cut in price will result in a decrease in revenue.
Step 4: Answer part c. by explaining whether other coffee houses cutting the prices of their coffees will affect your calculation from part b. of the price elasticity of demand for Frappuccinos. The calculation in part b. assumes that during the time that Starbucks cuts the price of Frappuccinos, nothing else that affects demand will have changed. We know that the coffees sold by other coffee houses are substitutes for Frappuccinos. So we would expect that if other coffeehouses cut the prices of their coffees, the demand curve for Frappuccinos will shift to the left. The 20 percent increase in the quantity of Frappuccions sold reflects the effects of both the price cut and the shift in the demand curve for Frappuccinos. Therefore our calculation of the price elasticity of demand for Frappuccinos is inaccurate. It’s likely that the price elasticity is larger (in absolute value) than the value we caculated in part b.
Step 5: Answer part d. by explaining whether the fact that some consumers are facing a “challenging economic environment” affects your answer to part b. The answer to part d. is similar to the answer to part c. If the fact that some consumers are facing a “challenging economic environment” means that these consumers are less likely to be buying coffee and other products away from home, then the demand curve for Frappuccinos will have shifted to the left during the period that Starbucks cut the price of these coffees. As a result, the value we computed for the price elasticity of demand in part b. will be inaccurate. Taken together, the factors mentioned in parts c. and d. indicate the difficulties that firms have in calculating the price elasticity of demand for their products during a time period when several factors that affect the demand for the products may be changing.
Supports: Microeconomics and Economics, Chapter 6.
Photo from the New York Times.
Blogger Matthew Yglesias made the following observation in a recent post: “If you look at gasoline prices, it’s obvious that if fuel gets way more expensive next week, most people are just going to have to pay up. But if you compare the US versus Europe, it’s also obvious that the structurally higher price of gasoline over there makes a massive difference: They have lower rates of car ownership, drive smaller cars, and have a higher rate of EV adoption.” (The blog post can be found here, but may require a subscription.)
What does Yglesias mean by Europe having a “structurally higher price” of gasoline?
Assuming Yglesias’s observations are correct, what can we conclude about the price elasticity of the demand for gasoline in the short run and in the long run?
Currently, the federal government imposes a tax of 18.4 cents per gallon of gasoline. Suppose that Congress increases the gasoline tax to 28.4 cents per gallon. Again assuming that Yglesias’s observations are correct, would you expect that the incidence of the tax would be different in the long run than in the short run? Briefly explain.
Would you expect the federal government to collect more revenue as a result of the 10 cent increase in the gasoline tax in the short run or in the long run? Briefly explain.
Solving the Problem
Step 1: Review the chapter material. This problem is about the determinants of the price elasticity of demand and the effect of the value of the price elasticity of demand on the incidence of a tax, so you may want to review Chapter 6, Section 6.2 and Solved Problem 6.5. (Note that a fuller discussion of the effect of the price elasticity of demand on tax incidence appears in Chapter 17, Section 17.3.)
Step 2: Answer part a. by explaining what Yglesias means when he writes that Europe has a “structurally higher” price of gasoline. Judging from the context, Yglesias is saying that European gasoline prices are not just temporarily higher than U.S. gasoline prices but have been higher over the long run.
Step 3: Answer part b. by expalining what we can conclude from Yglesias’s observations about the price elasticity of demand for gasoline in the short run and in the long run. When Yeglesias is referring to gasoline prices rising “next week,” he is referring to the short run. In that situation he says “most people are going to have to pay up.” In other words, the increase in price will lead to only a small decrease in the quantity demanded, which means that in the short run, the demand for gasoline is price inelastic—the percentage change in the quantity demanded will be smaller than the percentage change in the price.
Because he refers to high gasoline prices in Europe being structural, or high for a long period, he is referring to the long run. He notes that in Europe people have responded to high gasoline prices by owning fewer cars, owning smaller cars, and owning more EVs (electric vehicles) than is true in the United States. Each of these choices by European consumers results in their buying much less gasoline as a result of the increase in gasoline prices. As a result, in the long run the demand for gasoline is price elastic—the percentage change in the quantity demanded will be greater than the percentage change in the price.
Note that these results are consistent with the discussion in Chapter 6 that the more time that passes, the more price elastic the demand for a product becomes.
Step 4: Answer part c. by explaining how the incidence of the gasoline tax will be different in the long run than in the short run. Recall that tax incidence refers to the actual division of the burden of a tax between buyers and sellers in a market. As the figure in Solved Problem 6.5 illustrates, a tax will result in a larger increase in the price that consumers pay for a product in the situation when demand is price inelastic than when demand is price elastic. The larger the increase in the price that consumers pay, the larger the share of the burden of the tax that consumers bear. So, we can conclude that the tax incidence of the gasoline tax will be different in the short run than in the long run: In the short run, more of the burden of the tax is borne by consumers (and less of the burden is borne by suppliers); in the long run, less of the burden of the tax is borne by consumers (and more of the burden is borne by suppliers).
Step 5: Answer part d. by explaining whether you would expect the federal government to collect more revenue as a result of the 10 cent increase in the gasoline tax in the short run or in the long run. The revenue the federal government collects is equal to the 10 cent tax multiplied by the quantity of gallons sold. As the figure in Solved Problem 6.5 illustrates, a tax will result in a smaller decrease in the quantity demanded when demand is price inelastic than when demand is price elastic. Therefore, we would expect that the federal government will collect more revenue from the tax in the short run than in the long run.
Supports: Microeconomics and Economics, Chapter 6, and Essentials of Economics, Chapter 7.
Photo from from Reuters via the Wall Street Journal.
An article on bloomberg.com noted that in China after Apple cut by 10 percent the price of its iPhone 15 Pro Max—the most expensive iPhone model—sales of this model increased by 12 percent.
a. Based on this information, is the demand in China for this model iPhone price elastic or price inelastic? Briefly explain.
b. Do you have enough information to be confident in your answer to part a.? Briefly explain.
c. Assuming that the price elasticity you calculated in part a. is accurate, should managers at Apple be confident that if they cut the price of this iPhone model by an additional 10 percent they would sell 12 percent more? Briefly explain.
Solving the Problem
Step 1: Review the chapter material. This problem is about the price elasticity of demand, so you may want to review Microeconomics (and Economics), Chapter 6, Sections 6.1, 6.2 and 6.3 (Essentials of Economics, Chapter 7, Sections 7.5, 7.6, and 7.7)
Step 2: Answer part a. by using the information provided to determine whether the demand for this iPhone model in China is price elastic or price inelastic. In Section 6.1, we define the price elasticity of demand as being equal to (Percentage change in quantity demanded)/(Percentage change in price). From the information given, the price elasticity of demand for this iPhone model in China equals 12%/–10% = –1.2. Because this value is greater than 1 in absolute value, we can conclude that demand for this iPhone model in China is price elastic.
Step 3: Answer part b. by discussing whether you have enough information to be confident in your answer to part a. If we have values for the change in price and the change in the quantity demanded, we can calculate the price elasticity of demand provided that nothing that would affect the willingness of consumers to buy the good—other than the price of the good—has changed. In this case, if other factors that are relevant to consumers in making their decision about buying that iPhone model have changed, then the demand curve will have shifted and the 12 percent increase in iPhones sold will be a mixture of the effect of the price having decreased and the effects of other factors having changed. For example, if the prices of smartphones sold by Vivo and Huawei—two Chinese firms whose smartphones compete with the iPhone—had increased, then the demand curve for the iPhone 15 Pro Max will have shifted to the right and our calculation in part a. will not give us an accurate value for the price elasticity of demand for the iPhone 15 Pro Max.
Step 4: Answer part c. by explaining whether, assuming that the price elasiticity you calculated in part a. is accurate, Apple’s managers can be confident that if they if they cut the price of this iPhone model by an additional 10 percent they would sell 12 percent more of this model. The first price cut for this iPhone model caused a movement down the demand curve. For Apple’s managers to be confident that that the same percentage price cut would result in the same percentage increase in the quantity sold, the price elasticity would have to be constant along the demand curve for this model. As we show explicitly for a linear demand curve in Section 6.3, the price elasticity of demand is unlikely to be constant along the demand curve (although in an unusual case it would be). In general, we expect that in moving further down the demand curve the price elasticity of demand will decline in absolute value. If that result holds in this case, then an additional 10 percent cut in price is likely to result in less than a 12 percent increase in the quantity demanded.
Action Comics No. 1, published in June 1938, is often consider the first superhero comic book. (Image from comics.org.)
In a political advertisement that ran before the broadcast of the Super Bowl, President Joe Biden discussed shrinkflation, which refers to firms reducing the quantity of a product in container while keeping the price unchanged. In this post from the summer of 2022, we discussed examples of shrinkflation—including Chobani reducing the quantity of yogurt in the package shown here from 5.3 ounces to 4.5 ounces—and noted that shrinkflation complicates the job of the Bureau of Labor Statistics when compiling the consumer price index.
This yogurt remained the same price although the quantity of yogurt in the container shrank from 5.3 ounces to 4.5 ounces.
Shrinkflation isn’t new; firms have used the strategy for decades. Firms are particularly likely to use shrinkflation during periods of high inflation or during periods when the federal government implements price controls. Firms also sometimes resort to shrinkflation when the the price of a product has remained constant for long enough that the firms fear that consumers will react strongly to the firms increasing the price.
Comic books provide an interesting historical example of shrinkflation. David Palmer, a professor of management at South Dakota State University published an article in 2010 in which he presented data on the price and number of pages in copies of Action Comics from 1938 to 2010. When DC Comics introduced Superman in the first issue of Action Comics in June 1938, it started the superhero genre of comic books. Action Comics No. 1 had a price of $0.10 and was 64 pages.
After the United States entered World War II in December 1941, the federal government imposed price controls to try to limit the inflation caused by the surge in spending to fight the war. Rising costs of producing comic books, combined with the difficulty in raising prices because of the controls, led comic book publishers to engage in shrinkflation. In 1943, the publishers reduced the number of pages in their comics from 64 to 56. In 1944, the publishers engaged in further shrinkflation, reducing the number of pages from 56 to 48.
In 1951, during the Korean War, the federal government again imposed price controls. Comic book publishers responded with further shrinkflation, keeping the price at $0.10, while reducing the number of pages from 48 to 40. In 1954, they shrank the number of pages to 36, which remains the most common number of pages in a comic book today. At that time, the publishers also slightly reduced the width of comics from 7 3/4 inches to 7 1/8 inches. (Today the typical comic book has a width of 6 7/8 inches.)
By the late 1950s, comic book publishers became convinced that they would be better off raising the prices of comic books rather than further shrinking the number of pages. But they were reluctant to raise their prices because they had been a constant $0.10 for more than 20 years, so children and their parents might react very negatively to a price increase, and because no firm wanted to be the first to raise its price for fear of losing sales to its competitors. They were caught in a prisoner’s dilemma: Comic book publishers would all have been better off if they had raised their prices but the antitrust laws kept them from colluding to raise prices and no individual firm had an incentive to raise prices alone. (We discuss collusion, prisoner’s dilemmas, and other aspects of oligopolistic firm behaviour in Chapter 14 of Microeconomics and Economics.)
The most successful publisher in the 1950s was Dell, which sold very popular comic books featuring Donald Duck, Uncle Scrooge, and other characters that particularly appealed to younger children. Because the prices of Dell’s comic books, like those of other publishers, been unchanged at $0.10 since the late 1930s, the firm didn’t have a clear idea of the price elasticity of demand for its comics. In 1957, the firm’s managers decided to use a market experiment to gather data on the price elasticity of demand. In most cities, Dell kept the price of its comics at $0.10, but in some cities it sold the identical comics at a price of $0.15.
The experiment lasted from March 1957 to August 1958 when the company discontinued it by reverting to selling all of its comics for $0.10. Although we lack the data necessary to compare the sales of Dell comics with a $0.15 price to the sales of Dell comics with a $0.10 price, the fact that no other publisher raised its prices during that period and that Dell abandoned the experiment indicates that the demand curve for Dell’s comics was price elastic—the percentage decline in the quantity sold was greater than the 50 percent increase in price—so Dell’s revenue from sales in the cities selling comics with a price of $0.15 likely declined. Dell’s strategy can be seen as a failed example of price leadership. (We discuss the relationship between the price elasticity of demand for a good and the total revenue a firm earns from selling the good in Chapter 6, Section 6.3 of Microeconomics and Economics. We discuss price leadership in Microeconomic and Economics, Chapter 14, Section 14.2.)
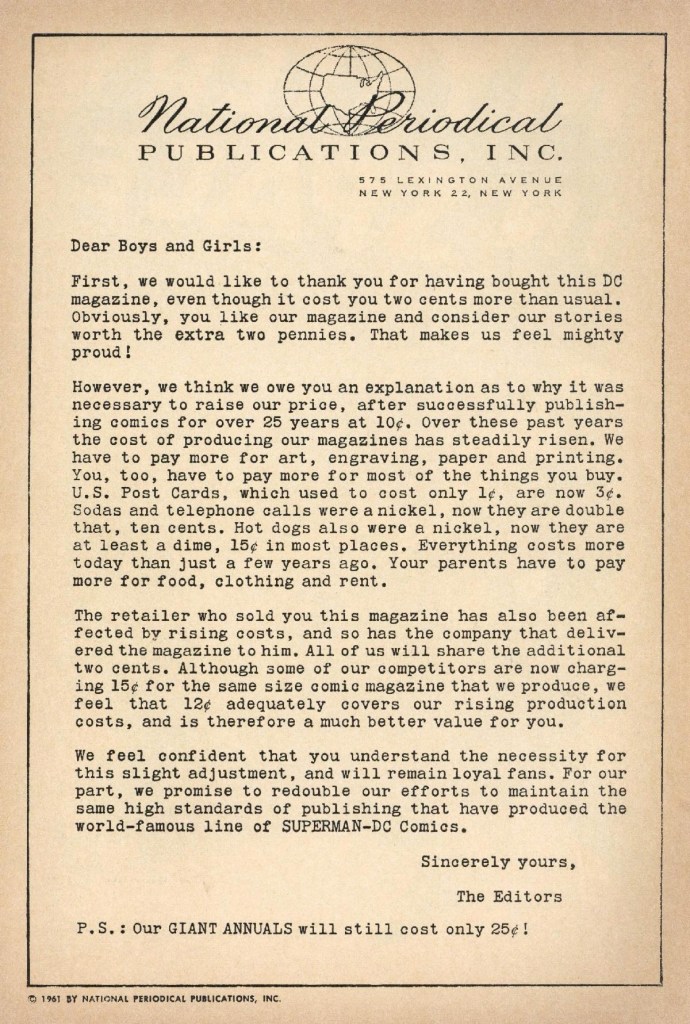
In March 1961, Dell increased the price of all of its comics from $0.10 to $0.15. At first, Dell’s competitors kept the prices of their comics at $0.10. As a result, in September 1961, Dell cut the price of its comics from $0.15 to $0.12. By early 1962, Dell’s competitors, including DC Comics, Marvel Comics—publishers of Spider-Man and the Fantastic Four—along with several smaller publishers, had increased the prices of their comics from $0.10 to $0.12. The managers at DC decided that raising the price of comics after having kept it constant for so long required an explantion. Accordingly, they printed the following letter in each of their comics.
H/T to Buddy Saunders for the image.
Comic book publishers have raised their prices many times since the early 1960s, with most comics currently having a price of $4.99. During the recent period of high inflation, comic publishers did not use a strategy of shrinkflation perhaps because they believe that 36 pages is the minimum number that buyers will accept.
The first 25 years of the comic book industry represents an interesting historical example of shrinkflation.
On Friday, February 2, Apple released Vision Pro, its long-awaited, much discussed virtual reality (VR) headset. The Vision Pro headset allows users to experience either VR, in which the user sees only virtual objects, as for instance when the user sees only images from a video game; or augmented reality (AR), in which the user sees virtual objects, such as icon apps or web pages superimposed on the real world (as in the two photos below). Apple refers to people using the headsets as being engaged in “spatial computing” and sometimes refers to the headsets as “face computers.”
Photo from Apple via the Wall Street Journal.
Photo from Apple via the Wall Street Journal.
Vision Pro has a price of $3,499, which can increase to more than $4,000 when including the cost of the insert necessary for anyone who wears prescription eyeglasses or contact lenses and who chooses to buy additional storage capacity. The price is much higher than Meta’s Quest Pro VR headset (shown in the photo below), which has a price of $999.
Photo from meta.com.
In this post, we can briefly discuss some of the economic issues raised by the Vision Pro. First, why would Apple charge such a high price? In her review of the Vision Pro in the Wall Street Journal, Joanna Stern, the site’s personal technology writer, speculated that: “You’re probably not going to buy the $3,500 Apple Vision Pro. Unless you’re an app developer or an Apple die-hard ….”
There are several reasons why Apple may believe that a price of $3,499 is profit maximizing. But we should bear in mind that pricing any new product is difficult because firms lack good data on the demand curve and are unsure how consumers will respond to changes in price. In our new ninth edition of Economics and Microeconomics, in Chapter 6 on price elasticity we discuss how Elon Musk and managers at Tesla experimented with the cutting the price of the Model 3 car as they attempted to discover the effect on price changes on the quantity demanded. Managers at Apple are in similar situation of lacking good data on how many headsets they are likely to sell at $3,499.
If Apple lacks good data on how consumers are likely to respond to different prices, why pick a price four times as high as Meta is charging for its Quest Pro VR headsets?
First, Apple expects to be able to clearly differentiate its headset from Meta’s headset. If consumers considered the two headsets to be close substitutes, the large price difference would make it unlikely that Apple would sell many headsets. Apple has several marketing advantages over Meta that make it likely that Apple can convince many consumers that the Meta headset is not a close substitute for the Vision Pro:
Apple has a history of selling popular electronic products, such as the iPhone, iPad, Air Pods, and the Apple Watch. It also owns the most popular app store. Apple has succeeded in seamlessly integrating these electronic products with each other and with use of the app store. As a result, a significant number of consumers have a strong preference for Apple products over competitors. Meta has a much more limited history of selling popular electronic products. For instance, it doesn’t produce its own smartphone.
Apple has an extensive network of retail stores inside and outside of the United States. The stores have been successful in giving consumers a chance to try a new electronic product before buying it and to receive help at the stores’ Genius Bars with setting up the device or dealing with any later problems. Meta operates few retail stores, relying instead on selling through other retailers, such as Best Buy, or through its online site. For some consumers Meta’s approach is less desirable than Apple’s.
Second, as we discuss in Economics and Microeconomics, Chapter 15, Section 15.5, charging a high price for a new electronic product is common, partly because doing so allows firms to price discriminate across time. With this strategy, firms charge a higher price for a product when it is first introduced and a lower price later. Some consumers are early adopters who will pay a high price to be among the first to own certain new products. Early adopers are a particularly large segment of buyers of Apple products, with long lines often forming at Apple stores on the days when a new product is released. That firms price discriminate over time helps explain why products such as Blu-ray players and 4K televisions sold for very high prices when they were first introduced. After the demand of the early adopters was satisfied, the companies reduced prices to attract more price-sensitive customers. For example, the price of Blu-ray players dropped by 95 percent within five years of their introduction. Similarly, we can expect that Apple will cut the price of Vision Pro significantly over time.
Third, because Apple is initially producing a relatively small number of units, it is likely experiencing a high average cost of producing the Vision Pro. The production of the components of the headset and the final assembly are likely to be subject to large economies of scale. (We discuss economies of scale in Economics and Microeconomics, Chapter 11, Section 11.6.) Apple hasn’t released information on how many units of the headset it intends to produce during 2024, but estimates are that it will be fewer than 400,000 and perhaps as few as 180,000. (Estimates can be found here, here, and here.) Compare that number to the 235 million iPhones Apple sold during 2023. We would expect as Apple’s suppliers increase their production runs, the average cost of production will decline as Apple moves down its long-run average cost curve. As a result, over time Apple is likely to cut the price.
In addition, when producing a new good, firms often experience learning as managers better understand the most efficient way to produce and assemble the new good. For example, the best method of assembling iPhones may not be the best method of assembling headsets, but this fact may only become clear after assembling several thousand headsets. Apple is likely to experience a learning curve with the average cost of producing headsets declining as the total number of headsets produced increases. While economies of scale involve a movement down a static long-run average cost curve, learning results in the long-run average cost curve shifting down. This second reason why Apple’s average cost of producing headsets will decline contributes to the liklihood that Apple will cut the price of the Vision Pro over time.
Finally, we can discuss a key factor that will determine how successful Apple is in selling headsets. In Chapter 11 of the new ninth edition of Economics and Microeconomics, we have a new Apply the Concept, “Mark Zuckerberg … Alone in the Metaverse?” In that feature, we note that Meta CEO Mark Zuckerberg has invested heavily in the metaverse, a word that typically means software programs that allow people to access either AR or VR images and information. Zuckerberg believed so strongly in the importance of the metaverse that he changed the name of the company from Facebook to Meta. The metaverse, which is accessed using headsets likes Meta’s Quest Pro or Apple’s Vision Pro, is subject to large network externalities—the usefulness of the headsets increases with the number of consumers who use them. The network externalities arise because many software applications, such as Meta’s Horizon World, depend on interactions among users and so are not very useful when there aren’t many users.
Meta hasn’t sold as many headsets as they expected because they have had difficulty attracting enough users to make their existing software useful and the failure to have enough users has reduced the incentive for other firms to develop apps for Meta’s headsets. Initially, some reviewers made similar comments about Apple’s Vision Pro. For instance, even though streaming films in 3D is one of the uses that Apple promotes, some streaming services, including Netflix and YouTube, have not yet released apps for Vision Pro. Some important business related apps, such as FaceTime and Zoom, aren’t yet available. There are also currently no workout apps. As one reviewer put it “there are few great apps” for Vision Pro. Another reviewer wondered whether the lack of compelling software and apps might result in the Vision Pro headset suffering the fate of “every headset I test [which] ends up in my closet collecting dust.”
So, a key to the success of the Vision Pro will be the ability of Apple to attract enough users to exploit the network externalities that exist with VR/AR headsets. If successful, the Vision Pro may represent an important development in the transition to spatial computing.
Supports: Microeconomics and Economics Chapter 6, Section 6.2 and Esstentials of Economics, Chapter 7, Section 7.6.
The Houthis, a rebel group based in Yemen, have been attacking shipping in the Red Sea, which freighters sail through after exiting the Suez Canal. About 30 percent of global shipping travels through the Suez Canal. An article in the Financial Times noted that maritime insurance firms have increased their charges for insuring freight passing through the Suez Canal by about $6,000 per container.” The article also noted that: “Freight demand is price inelastic in the short run and transport isn’t a big part of overall costs.” And that “the average container holds about $100,000 worth of goods wholesale, which will be sold at destination for $300,000.”
Is there a connection between the observation that freight demand is price inelastic and the observation that the charge for transporting goods isn’t a large fraction of the price of the goods shipped by container? Briefly explain.
The article notes that the main alternative to transporting freight by ship is to transport it by air, but if only 1 percent of freight sent by ship were to be sent by air instead, all the available flight capacity would be filled. Does this fact also have relevance to explaining the price inelasticity of demand for transporting freight by ship? Briefly explain.
Solving the Problem
Step 1: Review the chapter material. This problem is about the determinants of the price elasticity of demand, so you may want to review Microeconomics and Economics, Chapter 6, Section 6.2 (Essentials of Economics, Chapter 7, Section 7.6), “The Determinants of the Price Elasticity of Demand and Total Revenue.”
Step 2: Answer part a. by explaining why the small fraction that transportation is of the total price of the goods in a container of freight makes it more likely that the demand for shipping is price inelastic in the short run. This section of the chapter notes that goods and services that are only a small fraction of a consumer’s budget tend to have less elastic demand than do goods and services that are a large faction. In this case, the consumer is a firm shipping freight. Because the $6,000 increase per container in the cost of shipping freight makes up only 2 percent of the dollar amount the freight can be sold for, shippers are likely not to significantly reduce the quantity of shipping services they demand. Note, though, that the article refers to the price elasticity of freight demand “in the short run.” It’s possible that over a longer period of time the market for transporting freight by ship may adjust by, for instance, firms offering to ship freight by air increasing their capacity and lowering their prices. In that case, the price elasticity of demand for transporting freight by ship will be higher in the long run than in the short tun.
Step 3: Answer part b. by explaining whether the limited amount of available capacity for sending freight by air may help explain why the demand for sending freight by ship is price inelastic. This section of the chapter notes that the most important determinant of the price elasticity of demand for a good or service is the availability of close substitutes. That there is only a small amount of unused capacity to transport goods by air indicates that transporting goods by air is not a close substitute for transporting goods by sea. Therefore, we would expect that this factor contributes to the demand for transporting goods by sea being price inelastic in the short run.