Statement on the Federal Reserve
The Federal Reserve’s independence and the public’s perception of that independence are critical for economic performance, including achieving the goals Congress has set for the Federal Reserve of stable prices, maximum employment, and moderate long-term interest rates. The reported criminal inquiry into Federal Reserve Chair Jay Powell is an unprecedented attempt to use prosecutorial attacks to undermine that independence. This is how monetary policy is made in emerging markets with weak institutions, with highly negative consequences for inflation and the functioning of their economies more broadly. It has no place in the United States whose greatest strength is the rule of law, which is at the foundation of our economic success.
SIGNATORIES
Ben S. Bernanke served two terms as Chair of the Board of Governors of the Fed, as well as Chair of the Council of Economic Advisers under President George W. Bush.
Jared Bernstein served as Chair of the Council of Economic Advisers under President Joe Biden.
Jason Furman served as Chair of the Council of Economic Advisers under President Barack Obama.
Timothy F. Geithner served as the 75th Secretary of the Treasury under President Barack Obama, as well as President and Chief Executive Officer of the Federal Reserve Bank of New York.
Alan Greenspan served five terms as Chair of the Board of Governors of the Fed, first appointed by President Ronald Reagan and then reappointed by Presidents George H.W. Bush, Bill Clinton, and George W. Bush. He also was Chair of the Council of Economic Advisers under President Gerald Ford.
Glenn Hubbard served as Chair of the Council of Economic Advisers under President George W. Bush.
Jacob J. Lew served as the 76th Secretary of the Treasury under President Barack Obama.
N. Gregory Mankiw served as Chair of the Council of Economic Advisers under President George W. Bush.
Henry M. Paulson served as the 74th Secretary of the Treasury under President George W. Bush.
Kenneth Rogoff is the Maurits C. Boas Professor of International Economics at Harvard University and former chief economist of the International Monetary Fund.
Christina Romer served as Chair of the Council of Economic Advisers under President Barack Obama.
Robert E. Rubin served as the 70th Secretary of the Treasury under President Bill Clinton, after serving as the first director of the White House National Economic Council.
Janet Yellen served as the 78th Secretary of the Treasury under President Joe Biden, Chair and Vice Chair of the Board of Governors of the Fed, Chair of the Council of Economic Advisers under President Bill Clinton, and President and CEO of the Federal Reserve Bank of San Francisco.
*********************
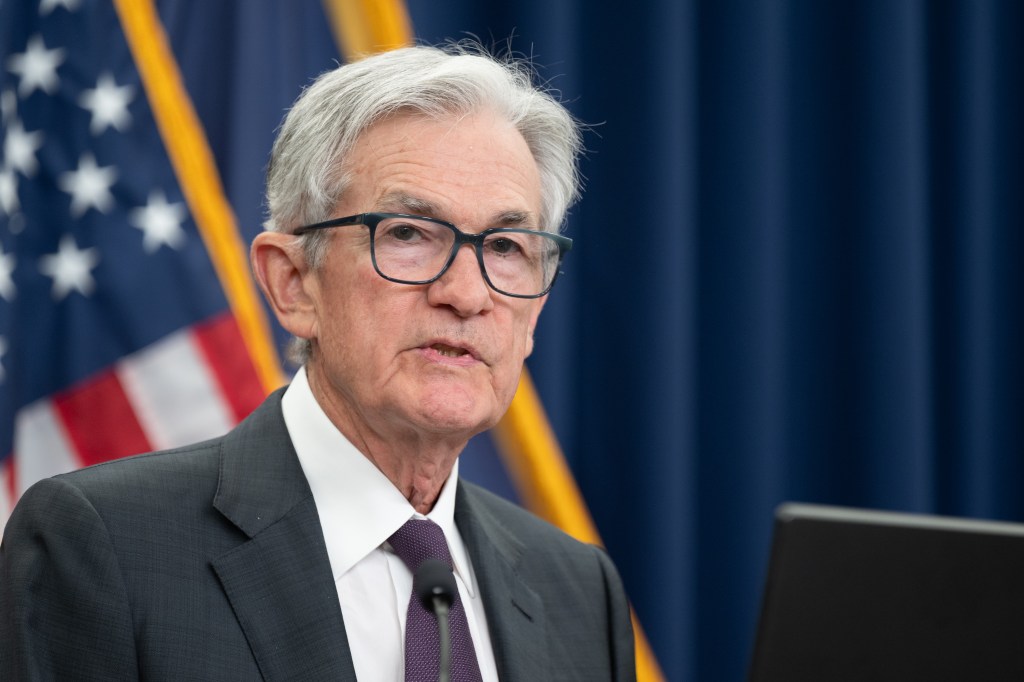
Separately, Federal Reserve Chair Jerome Powell issued the following statement last night. (Here is a link to Powell’s statement and to a video of Powell reading the statement.)
Good evening.
On Friday, the Department of Justice served the Federal Reserve with grand jury subpoenas, threatening a criminal indictment related to my testimony before the Senate Banking Committee last June. That testimony concerned in part a multi-year project to renovate historic Federal Reserve office buildings.
I have deep respect for the rule of law and for accountability in our democracy. No one—certainly not the chair of the Federal Reserve—is above the law. But this unprecedented action should be seen in the broader context of the administration’s threats and ongoing pressure.
This new threat is not about my testimony last June or about the renovation of the Federal Reserve buildings. It is not about Congress’s oversight role; the Fed through testimony and other public disclosures made every effort to keep Congress informed about the renovation project. Those are pretexts. The threat of criminal charges is a consequence of the Federal Reserve setting interest rates based on our best assessment of what will serve the public, rather than following the preferences of the President.
This is about whether the Fed will be able to continue to set interest rates based on evidence and economic conditions—or whether instead monetary policy will be directed by political pressure or intimidation.
I have served at the Federal Reserve under four administrations, Republicans and Democrats alike. In every case, I have carried out my duties without political fear or favor, focused solely on our mandate of price stability and maximum employment. Public service sometimes requires standing firm in the face of threats. I will continue to do the job the Senate confirmed me to do, with integrity and a commitment to serving the American people.
Thank you.