The meeting room of the FOMC in the Federal Reserve building in Washington, DC.
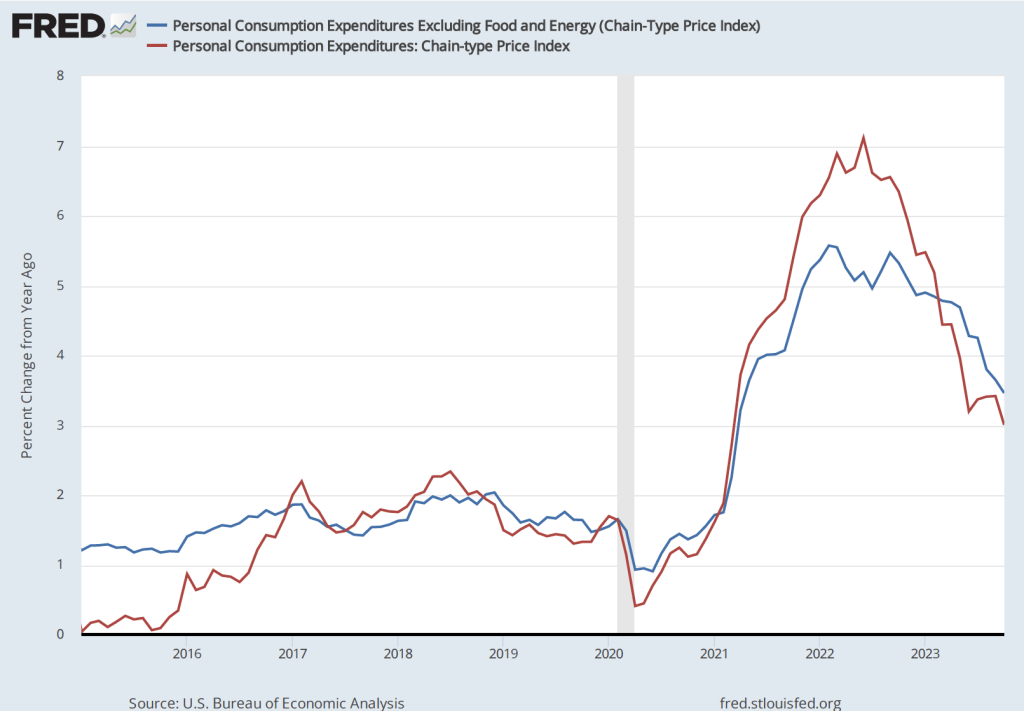
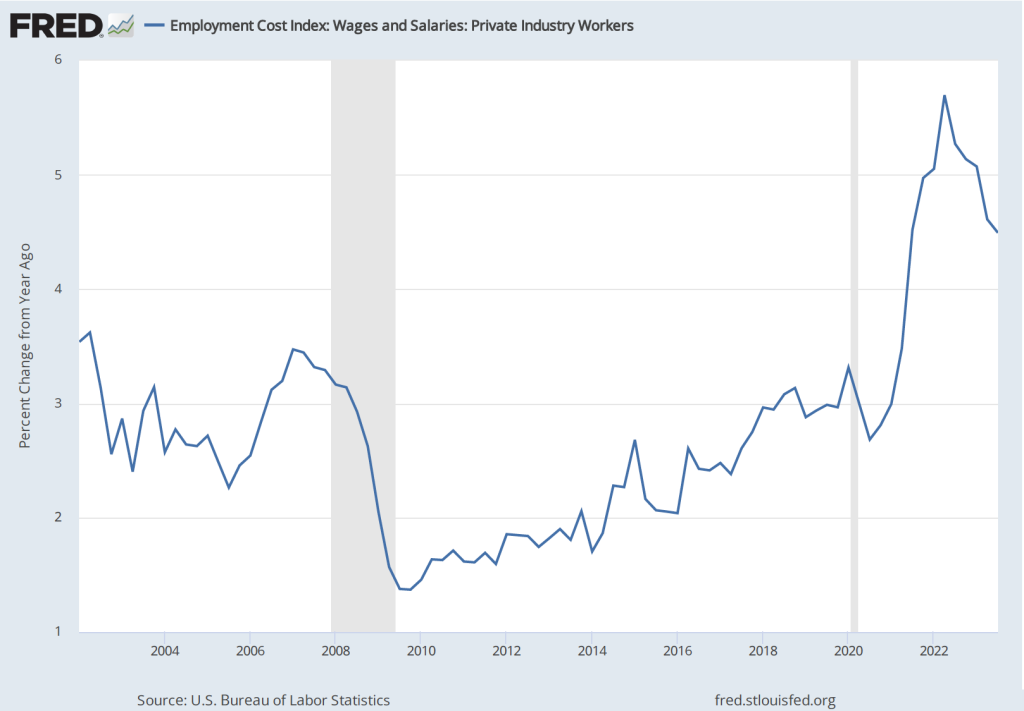
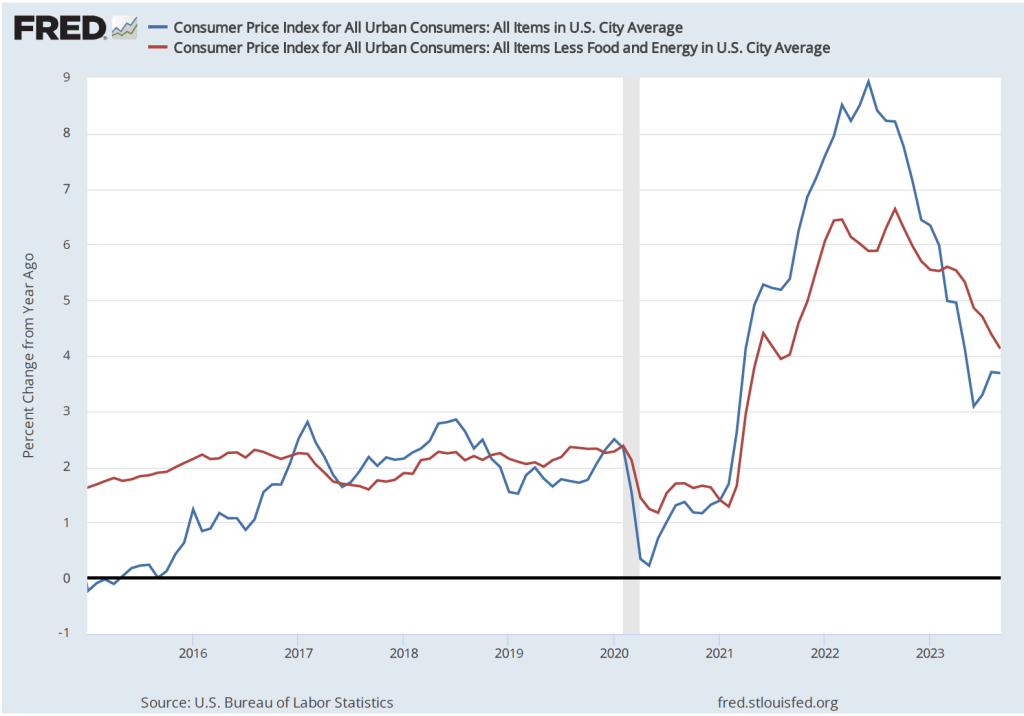
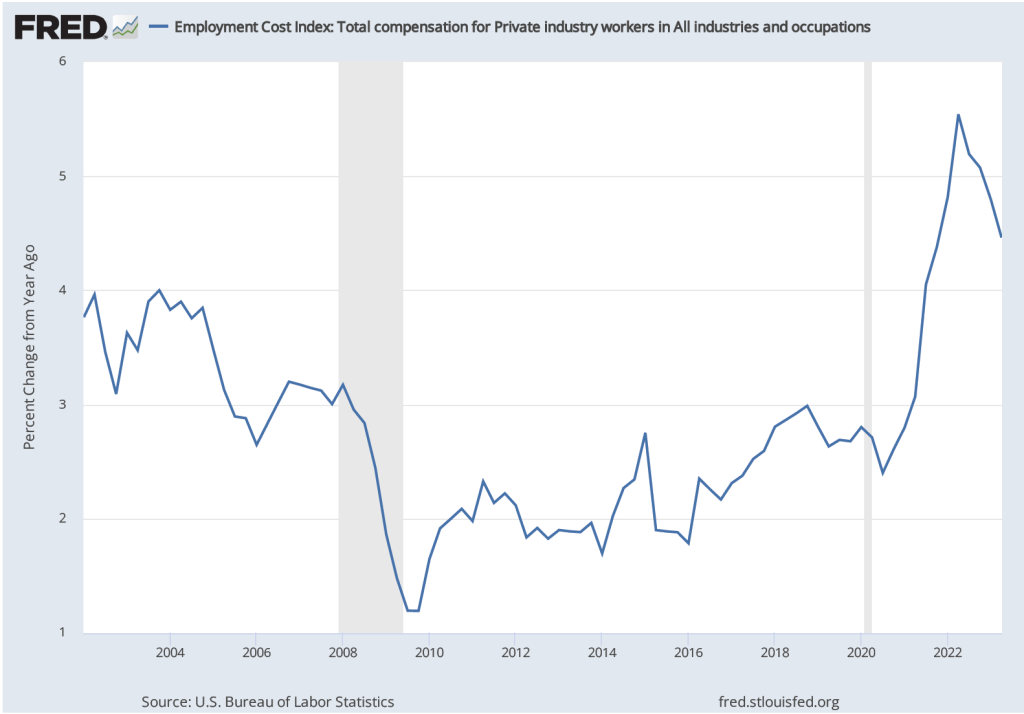
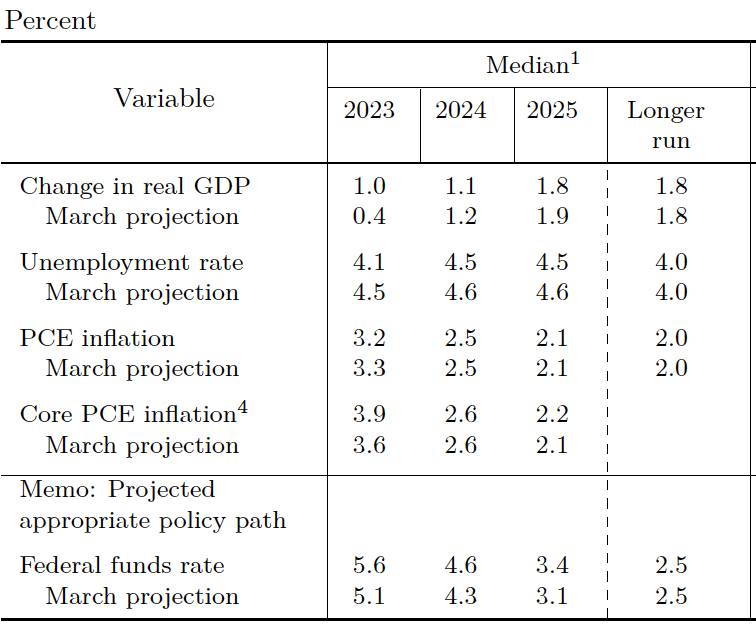
As we’ve noted in several recent posts, the inflation rate has fallen significantly from its peak in mid-2022, as U.S. economic growth has been slowing and the labor market appears to be less tight, slowing the growth of wages. Some economists and policymakers now believe that by early 2024, inflation will approach the Fed Reserve’s 2 percent inflation target. At that point, the Fed’s Federal Open Market Committee (FOMC) is likely to turn its attention from inflation to making sure that the U.S. economy doesn’t slip into a recession.
Accordingly, both economists and financial market participants have begun to anticipate the point at which the FOMC will begin to cut its target for the federal funds rate. (One note of caution: Fed Chair Jerome Powell has made clear that the FOMC stands ready to further increase its target for the federal funds rate if the inflation rate shows signs of increasing. He made this point most recently on December 1 in a speech at Spelman College in Atlanta.) There is currently an interesting disagreement between economists and investors over when the FOMC is likely to cut interest rates and by how much. We can see the views of investors reflected in the futures market for federal funds.
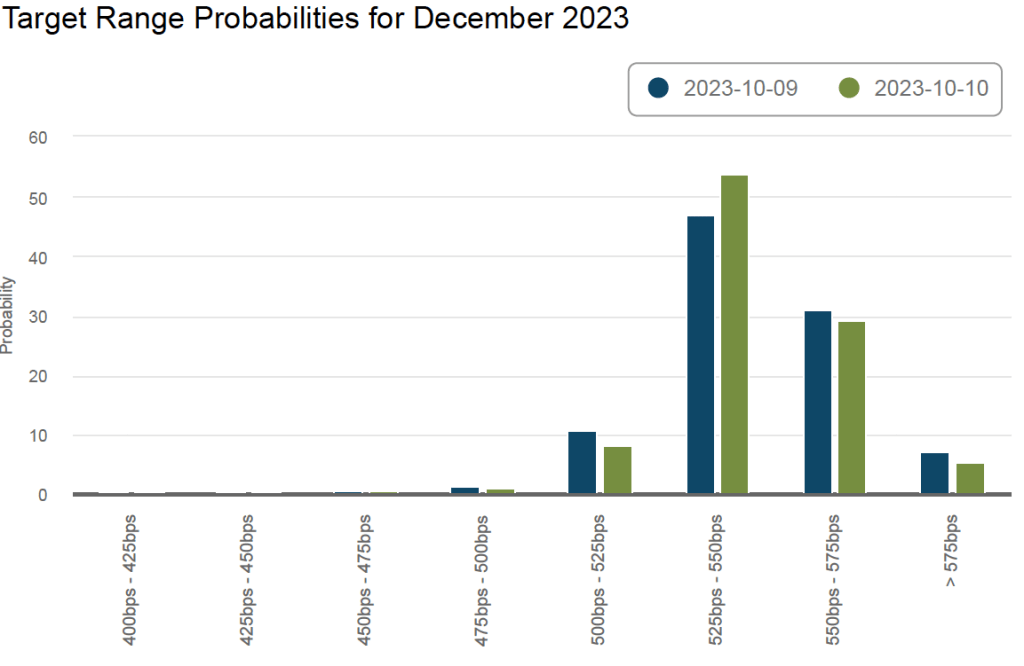
Futures markets allow investors to buy and sell futures contracts on commodities–such as wheat and oil–and on financial assets. Investors can use futures contracts both to hedge against risk—such as a sudden increase in oil prices or in interest rates—and to speculate by, in effect, betting on whether the price of a commodity or financial asset is likely to rise or fall. (We discuss the mechanics of futures markets in Chapter 7, Section 7.3 of Money, Banking, and the Financial System.) The CME Group was formed from several futures markets, including the Chicago Mercantile Exchange, and allows investors to trade federal funds futures contracts. The data that result from trading on the CME indicate what investors in financial markets expect future values of the federal funds rate to be. The following chart from the CME’s FedWatch Tool shows values after trading of federal funds futures on December 5, 2023.
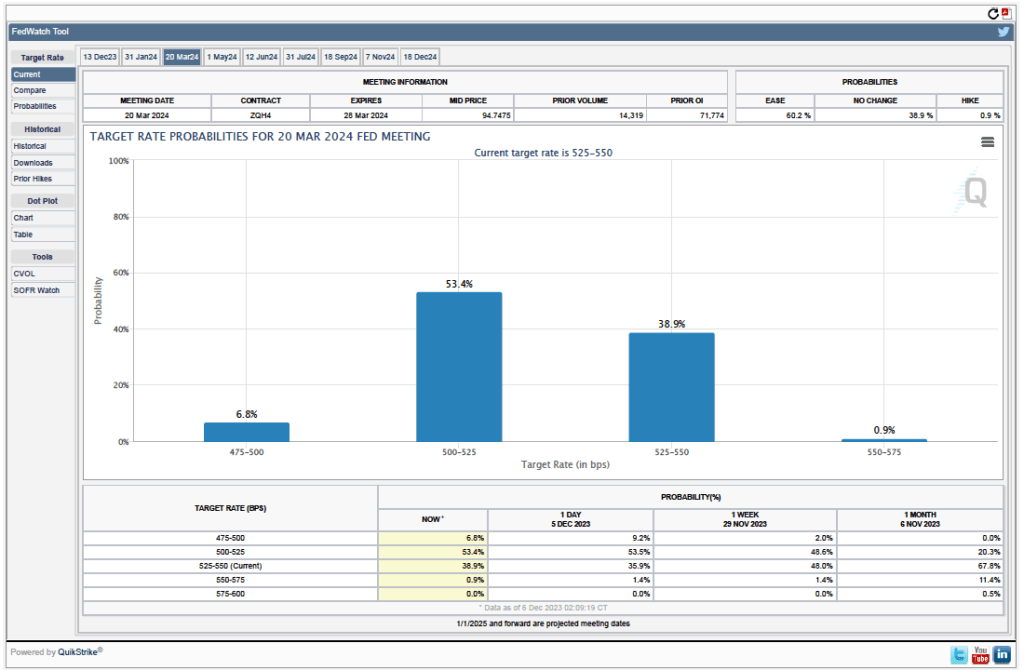
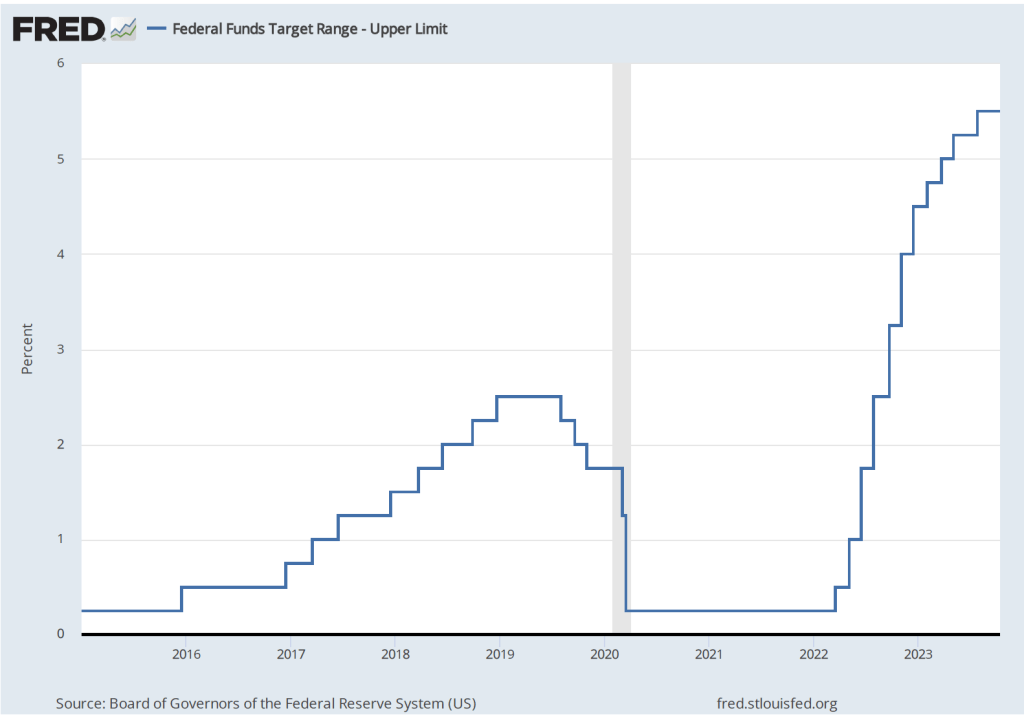
The probabilities in the chart reflects investors’ predictions of what the FOMC’s target for the federal funds rate will be after the committee’s meeting on March 20, 2024. This meeting is the first after which investors currently expect that the target is likely to be lowered. The target range is currently 5.25 percent to 5.50 percent. The chart indicates that investors assign a probability of 60.2 percent to the FOMC making at least a 0.25 percentage cut in the target rate at the March meeting.
Looking at the values for federal funds futures after the FOMC’s December 18, 2024 meeting, investors assign a 66.3 percent probability of the committee having reduced its target for the federal funds rate to 4.00 to 4.25 percent of lower. In other words, investors expect that during 2024, the FOMC will have cut its target for the federal funds rate by at least 1.25 percentage points.
Interesingly, according to a survey by the Financial Times, economists disagree with investors’ forecasts of the federal funds rate. According to the survey, which was conducted between December 1 and December 4, nearly two-thirds of economists believe that the FOMC won’t cut its target for the federal funds rate until July 2024 or later. Three-quarters of the economists surveyed believe that the FOMC will cut its target by 0.5 percent point or less during 2024. Fewer than 10 percent of the economists surveyed believe that during 2024 the FOMC will cut its target for the federal funds rate by 1.25 percent or more. (The Financial Times article describing the results of the survey can be found here. A subscription may be requred to read the article.)
So, at least among the economists surveyed by the Financial Times, the consensus is that the FOMC will cut its target for the federal funds rate later and by less than financial markets are indicating. What explains the discrepancy? The main explanation is that economists see inflation being persistently above the Fed’s 2 percent target for longer than do financial market participants. The economists surveyed are also more optimistic that the U.S. economy will avoid a recession in 2024. If a recession occurs, the FOMC is more likely to significantly cut its target than if the economy during 2024 experiences moderate growth in real GDP and the unemployment rate remains low.
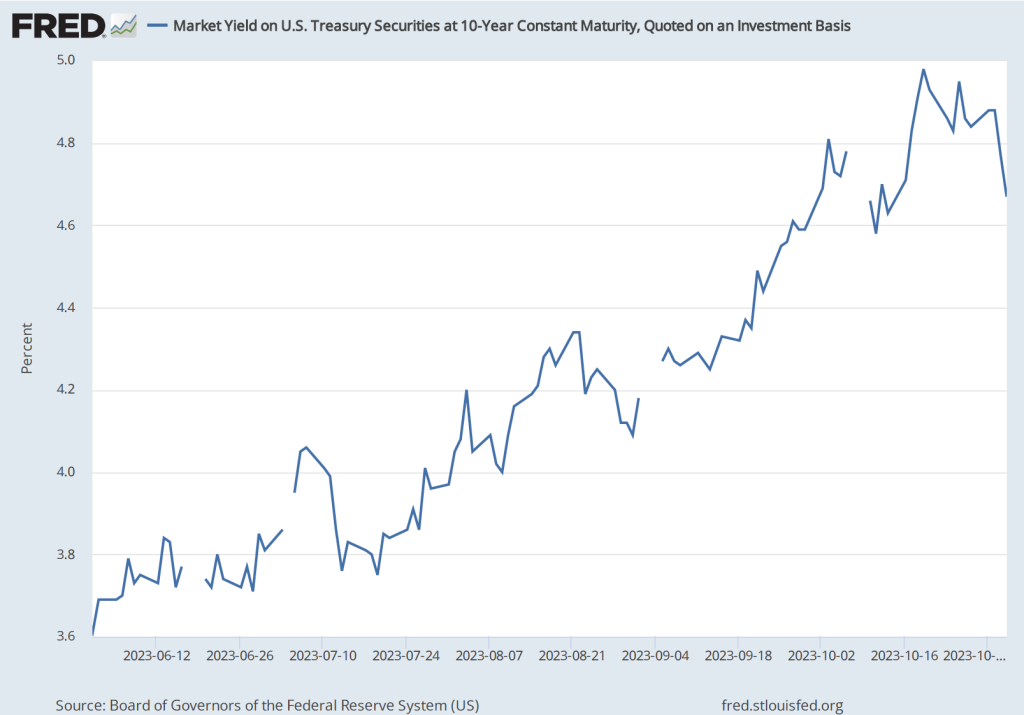
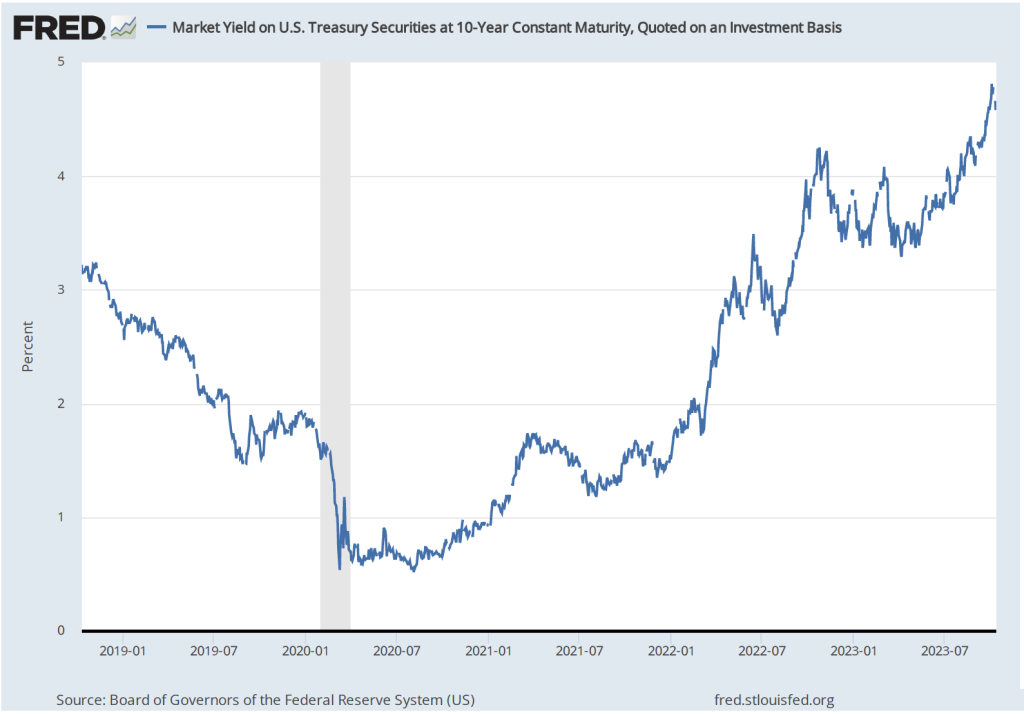
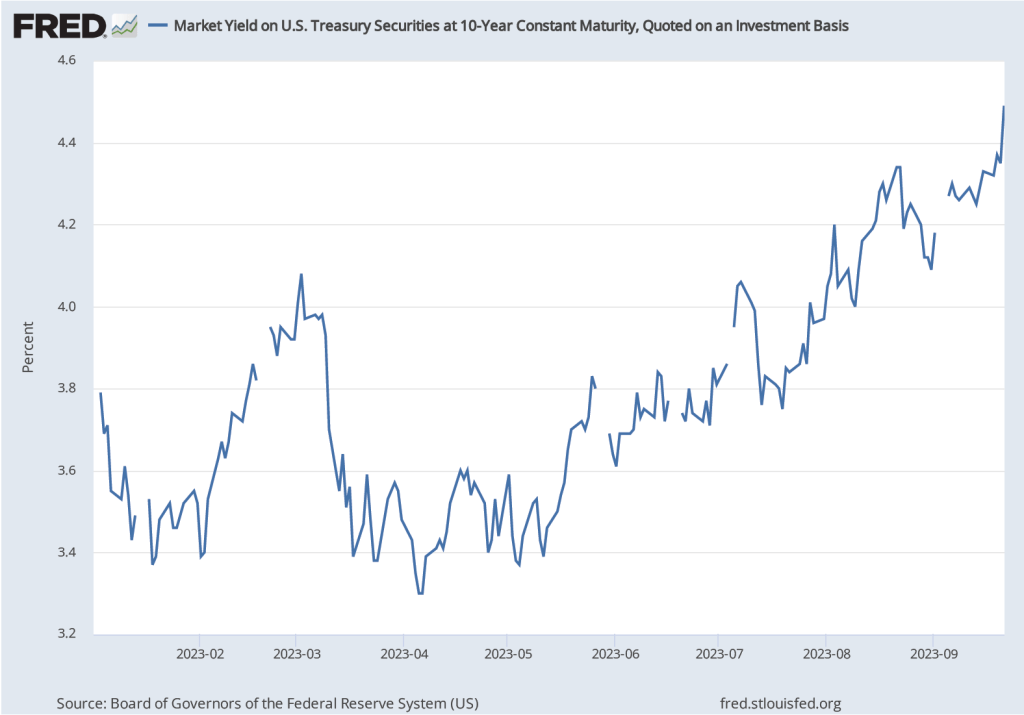
One other indication from financial markets that investors expect that the U.S. economy is likely to slow during 2024 is given by movements in the interest rate on the 10-year U.S. Treasury note. As shown in the following figure, from August to October of this year, the interest rate on the 10-year Treasury note rose from less than 4 percent to nearly 5 percent—an unusually large change in such a short period of time. Since then, most of that increase has been reversed with the interest rate on the 10-year Treasury note having fallen below 4.2 percent in early December
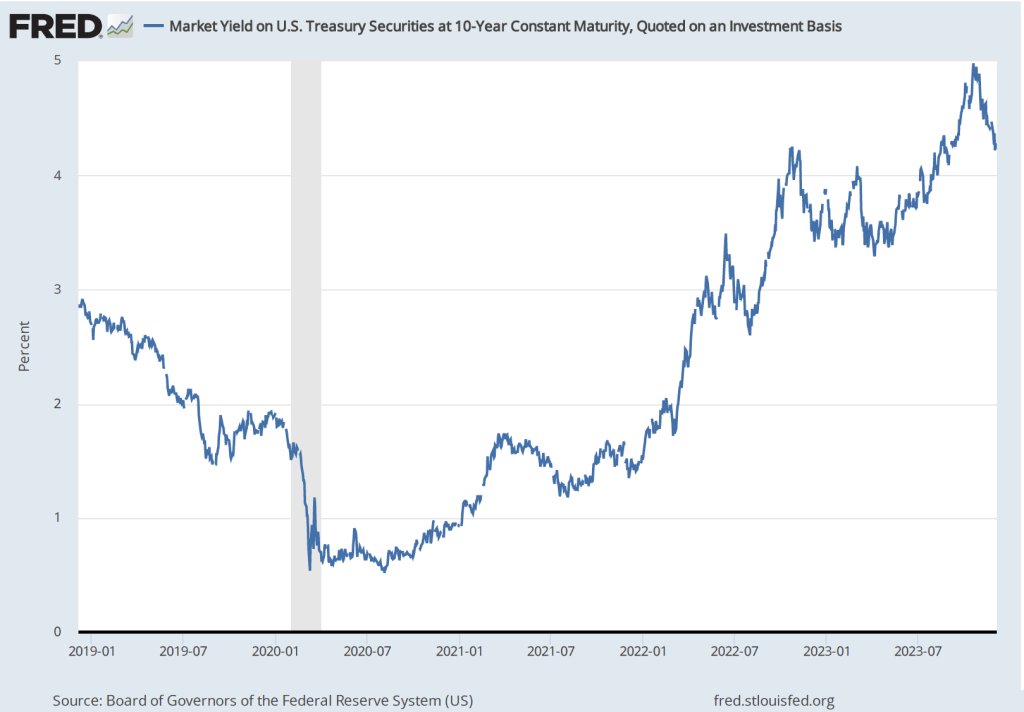
The movements in the interest rate on the 10-year Treasury note typically reflect investors’ expectations of future short-term interest rates. (We discuss the relationship between short-term and long-term interests rates—which economists call the term structure of interest rates—in Money, Banking, and the Financial System, Chapter 5, Section 5.2.) The increase in the 10-year interest rate between August and October reflected investors’ expectation that short-term interest rates were likely to remain persistently high for a considerable period—perhaps several years or more. The decline in the 10-year rate from late October to early December reflects investors changing their expectations toward future short-term interest rates being lower than they had previously thought. Again, as in the data on federal funds rate futures, investors seem to be expecting either slower economic growth or slower inflation than do economists.
One other complication about the interest rate on the 10-year Treasury note should be mentioned. Some of the increase in the rate from August to October may also have represented concern among investors that large federal budget deficit would cause the Treasury to issue more Treasury notes than investors would be willing to buy without the Treasury increasing the interest rate investors would receive on the newly issued notes. This concern may have been reinforced by data showing that foreign investors, particularly in China and Japan, appeared to have slowed or stopped adding to their holdings of Treasury notes. Part of the recent decline in the interest rate on the Treasury note may reflect investors becoming less concerned about these two factors.