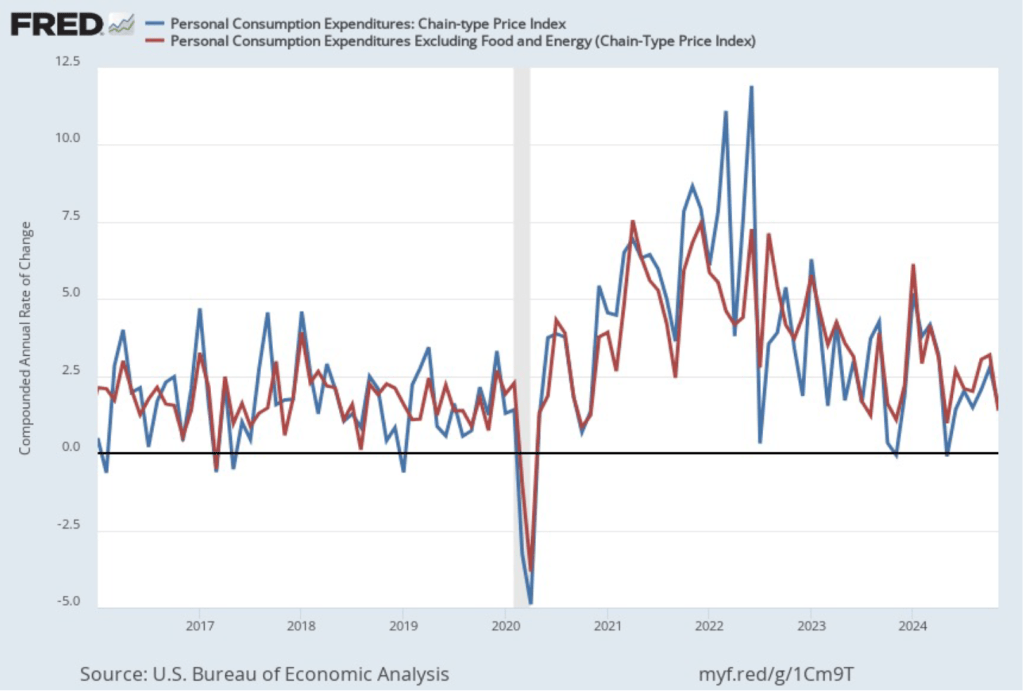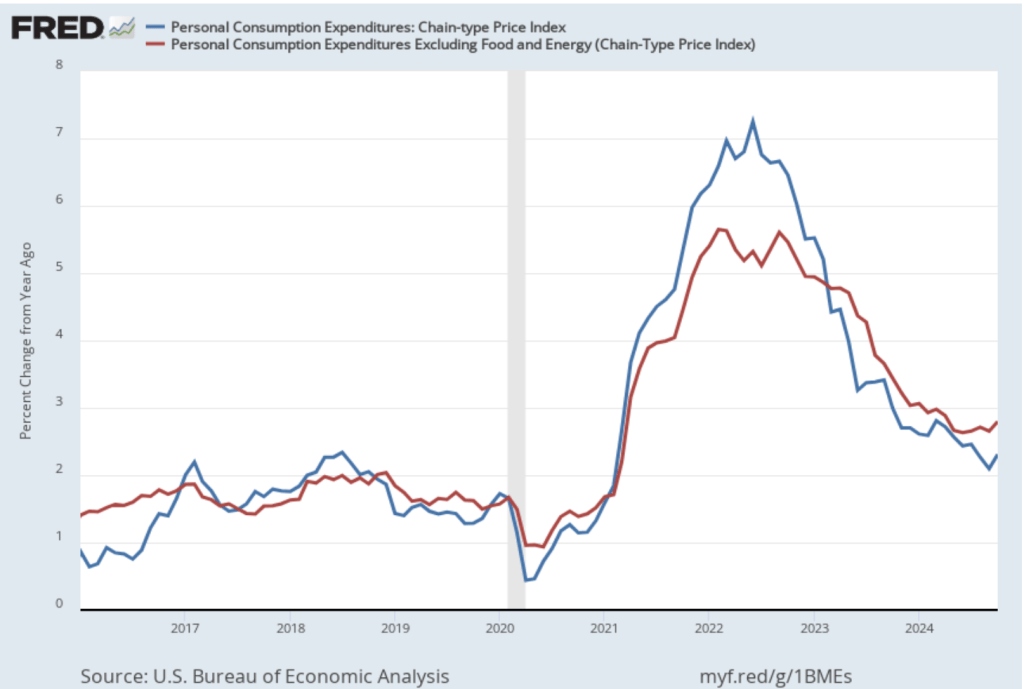
Last September the Federal Reserve’s policymaking Federal Open Market Committee (FOMC) cut its target for the federal funds rate by 0.50 percentage point (50 basis points. Many economists and policymakers expected the FOMC to continue cutting its federal funds rate target at meetings through 2025. (We discussed the September target cut in this blog post.) The FOMC cut its target by 25 basis points at both its November and December 2024 meetings. But by the December meeting, it had become clear that the inflation rate was not falling as quickly to the Fed’s 2 percent target as the committee members had hoped. As FOMC’s staff economists put it, there had been “upward surprises” in inflation data. According to the minutes of the December meeting, several members of the committee believed that “upside risks to the inflation outlook had increased.”
As a result, it seemed likely that the FOMC would leave its target for the federal funds rate unchanged at its next meeting on January 28-29. This conclusion was reinforced this morning (January 10) when the Bureau of Labor Statistics (BLS) released its “Employment Situation” report (often called the “jobs report”) for December. The report indicates that the labor market is stronger than expected.
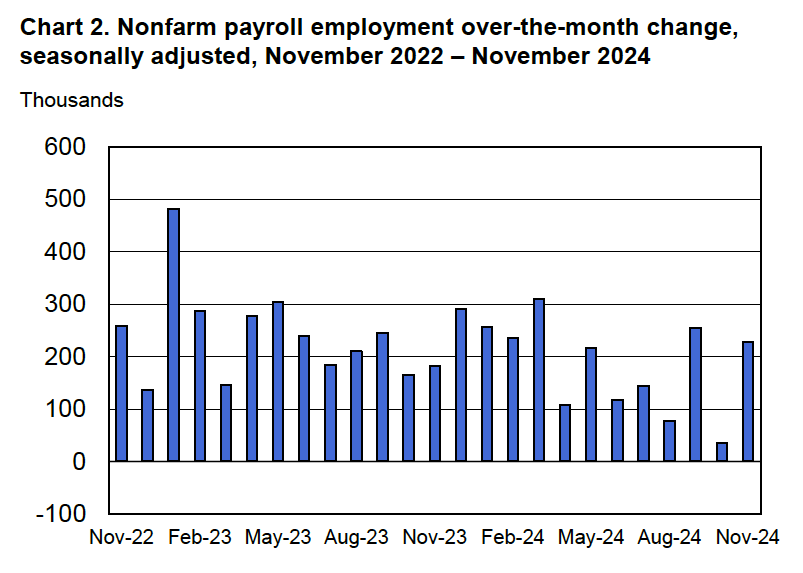
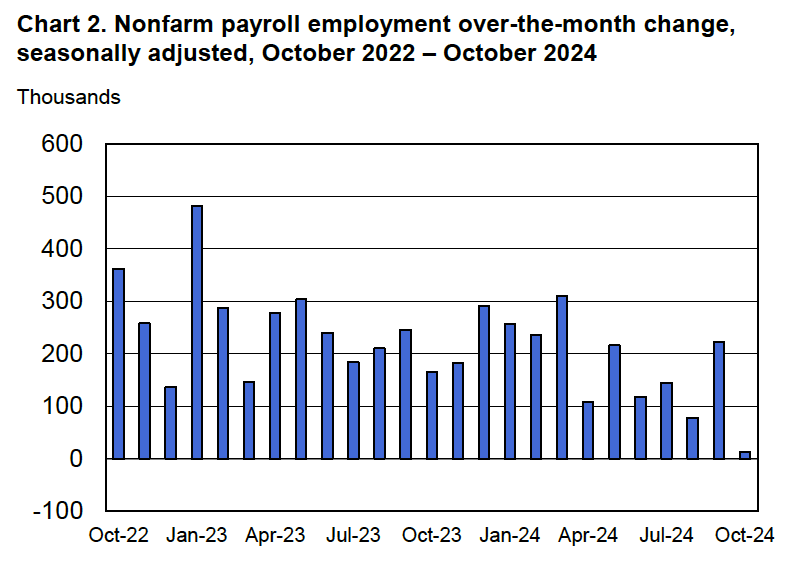
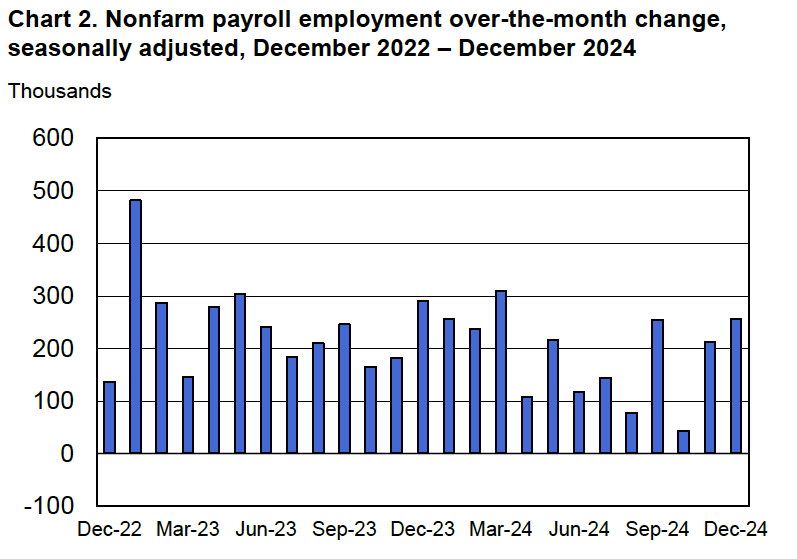
Economists who had been surveyed by the Wall Street Journal had forecast that payroll employment, as reported in the establishment survey, would increase by 155,000. The BLS reported that payroll employment in December had increased by 256,000, well above expectations. The unemployment rate—which is calculated from data in the household survey—was 4.1 percent, down slightly from 4.2 percent in November. The following figure, taken from the BLS report, shows the net changes in employment for each month during the past two years.
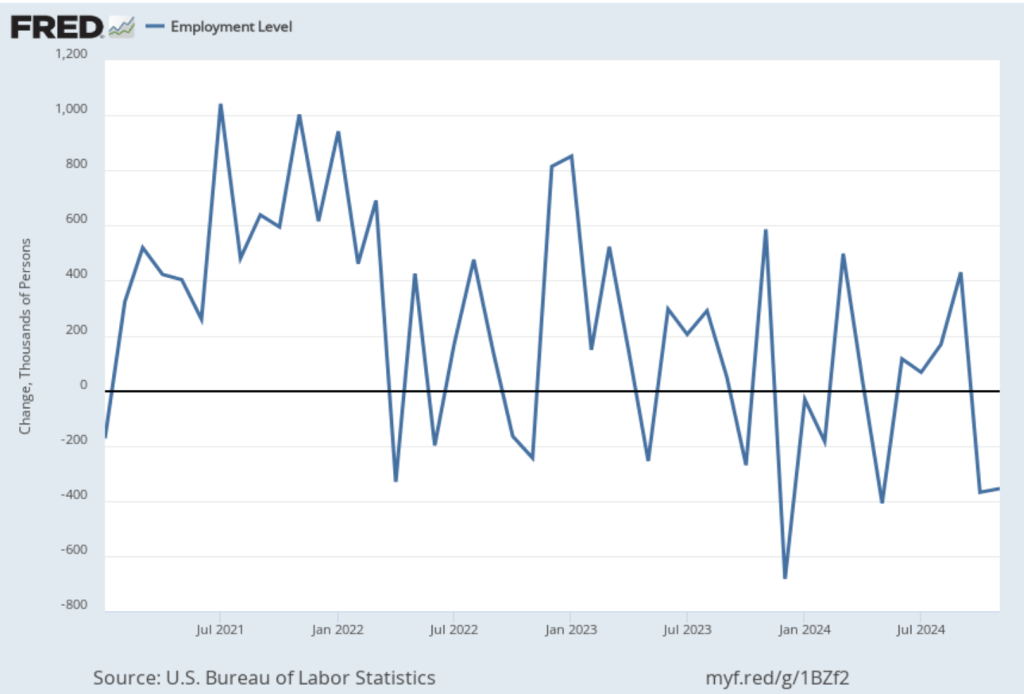
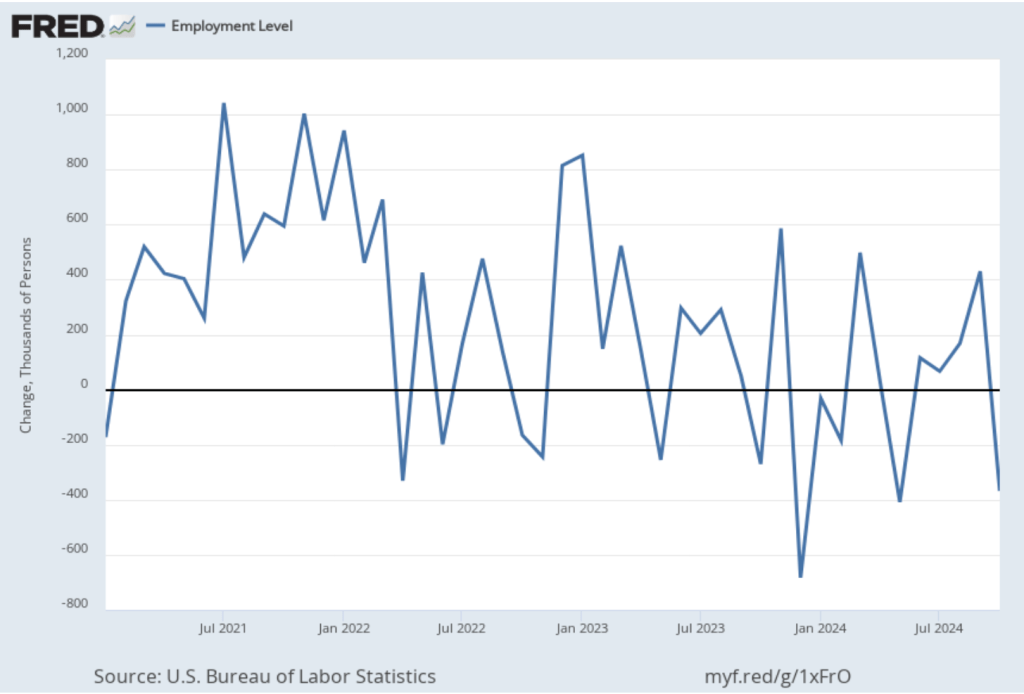
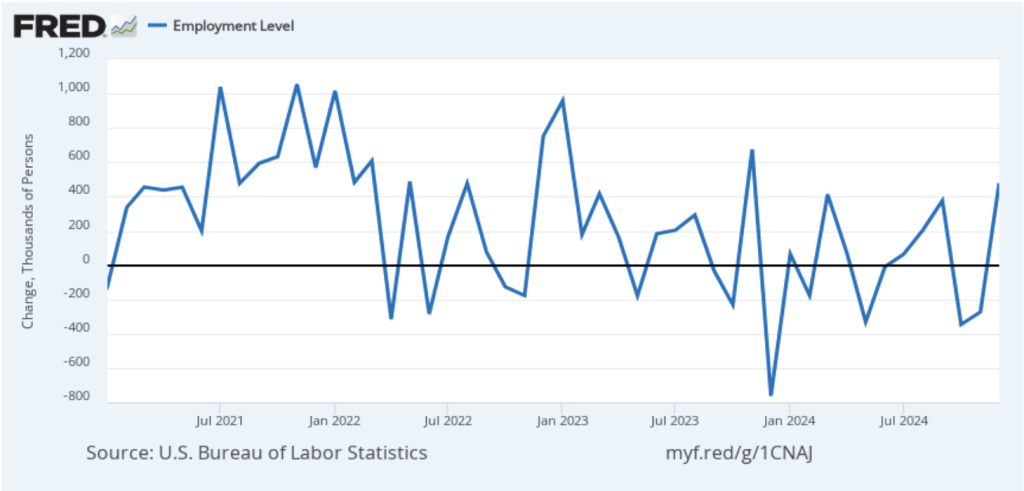
As the following figure shows, the net change in jobs from the household survey moves much more erratically than does the net change in jobs from the establishment survey. The net change in jobs as measured by the household survey for December also showed a strong increase of 478,000 jobs following a decline of 273,000 jobs in November. In any particular month, the story told by the two surveys can be inconsistent with employment increasing in one survey while falling in the other. But in December the two surveys were sending the same signal of rapid employment growth. (In this blog post, we discuss the differences between the employment estimates in the household survey and the employment estimates in the establishment survey.)
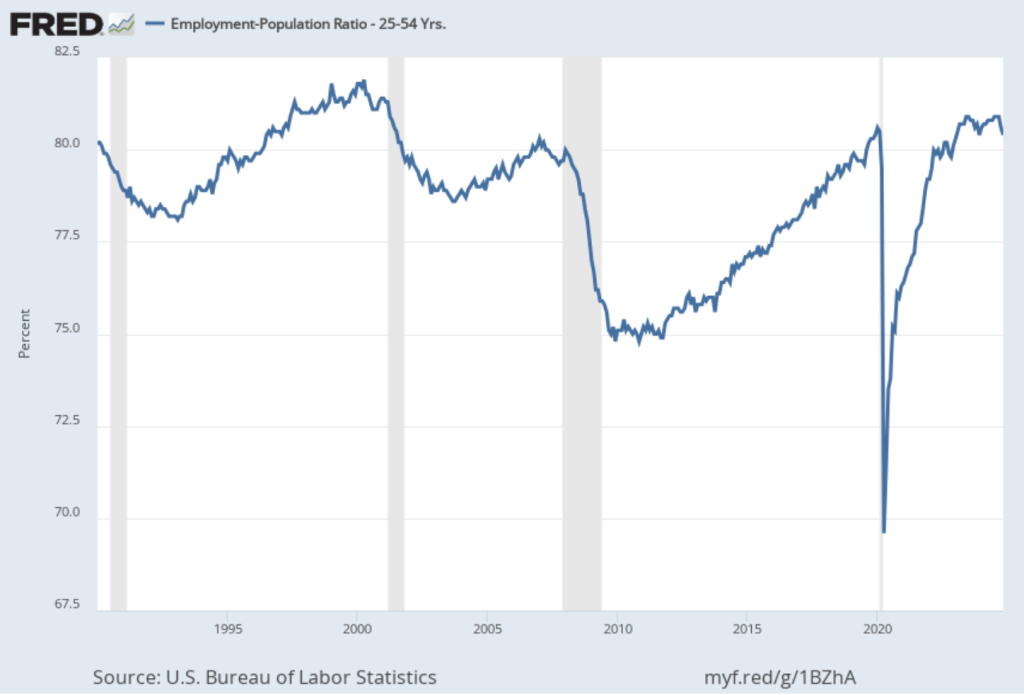
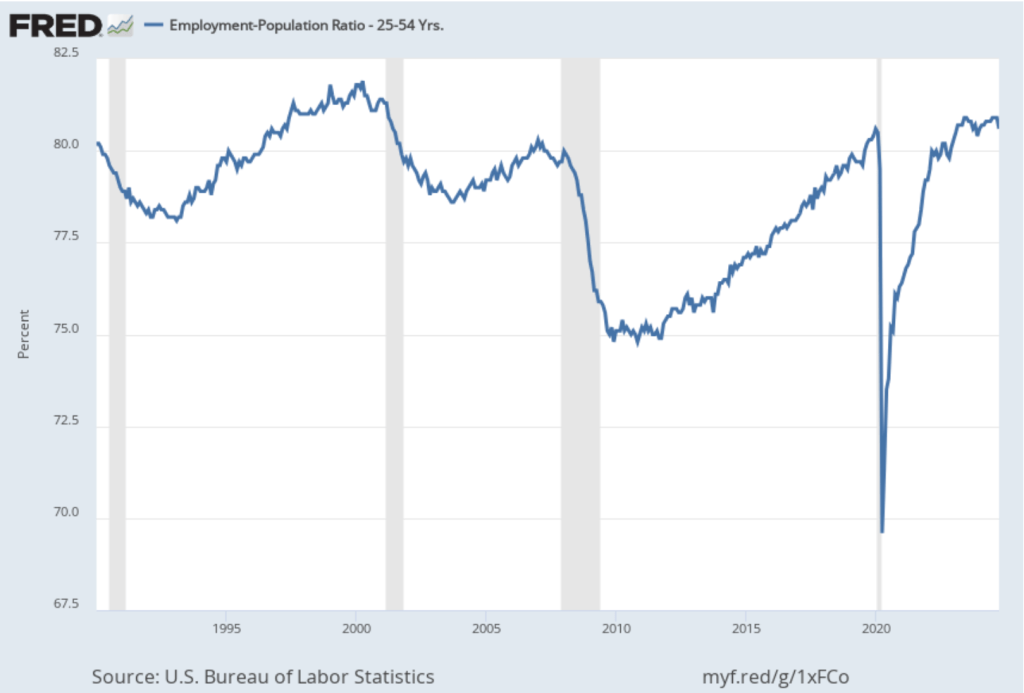
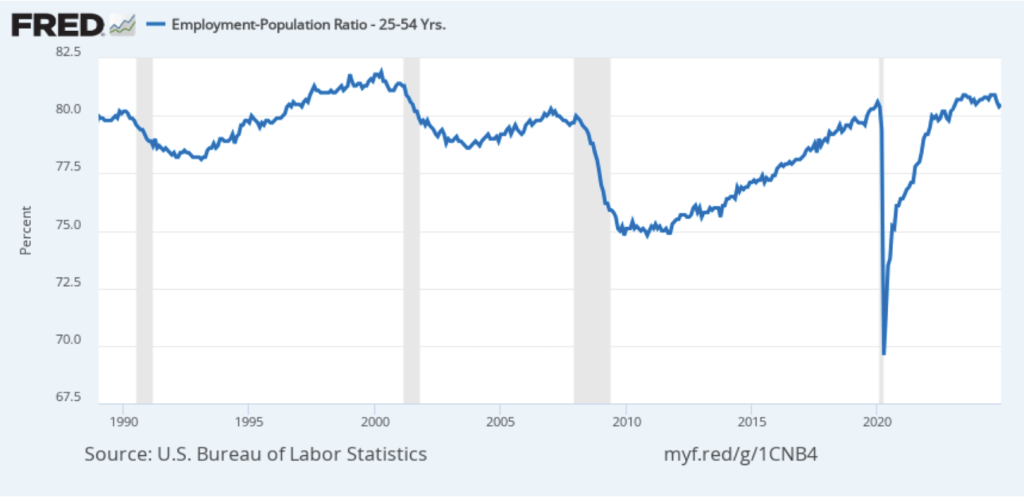
The employment-population ratio for prime age workers—those aged 25 to 54—also increased, as shown in the following figure, to 80.5 percent in December from 80.4 percent in November. Although the employment-population is below its recent high of 80.9 percent, it remains high relative to levels seen since 2001.
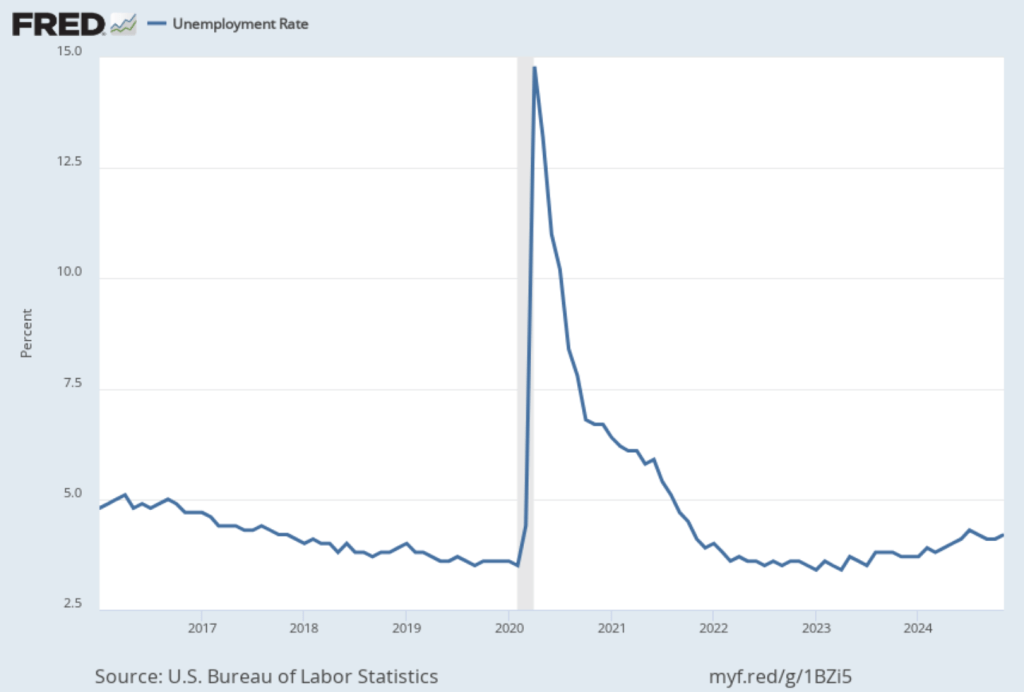
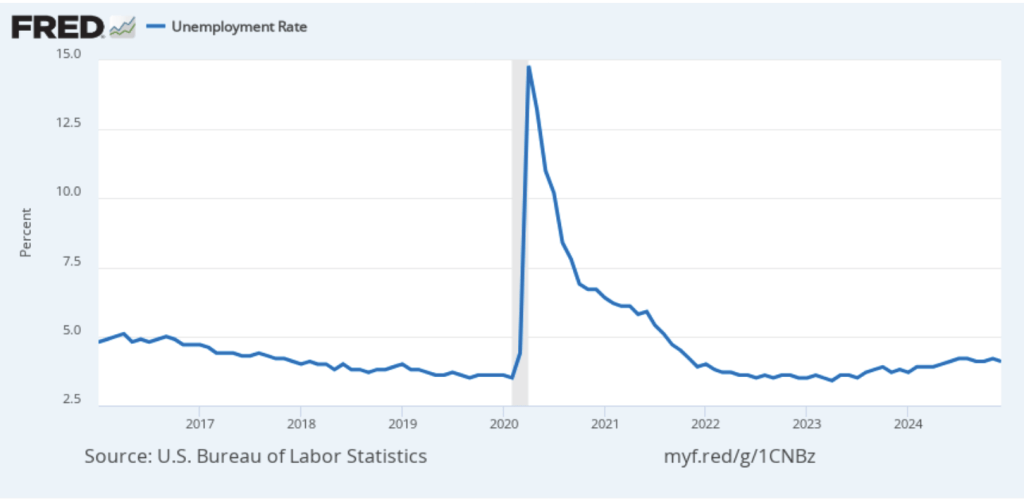
As the following figure shows, the unemployment rate, which is also reported in the household survey, decreased slightly to 4.1 percent in December from 4.2 percent in November. The unemployment rate has been remarkably stable over the past two years, varying only 0.2 percentage point above or below 4.0 percent.
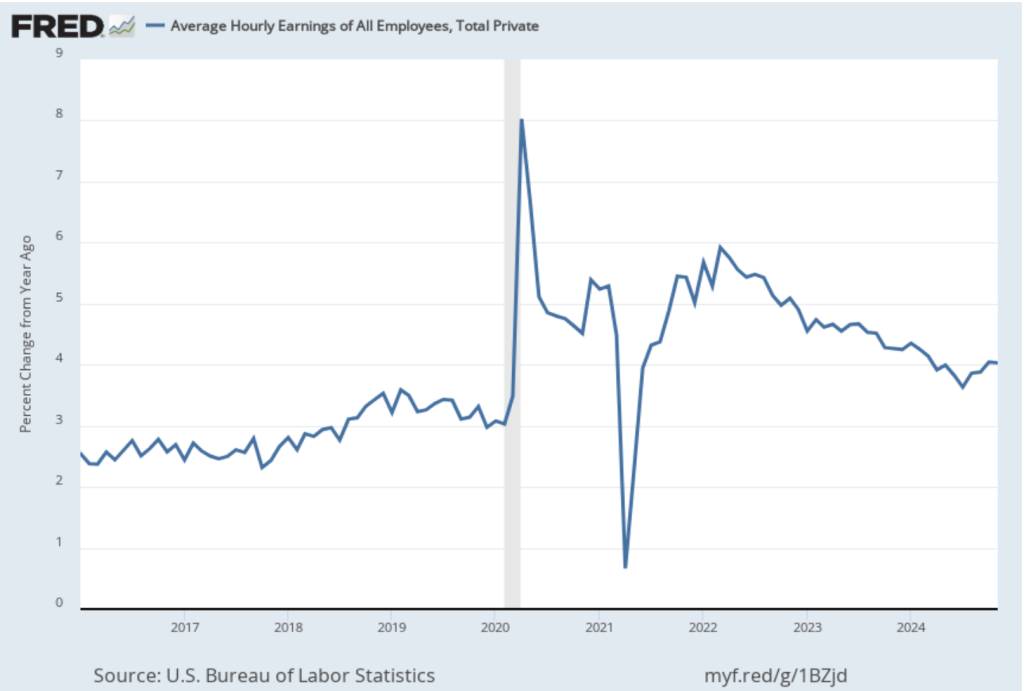
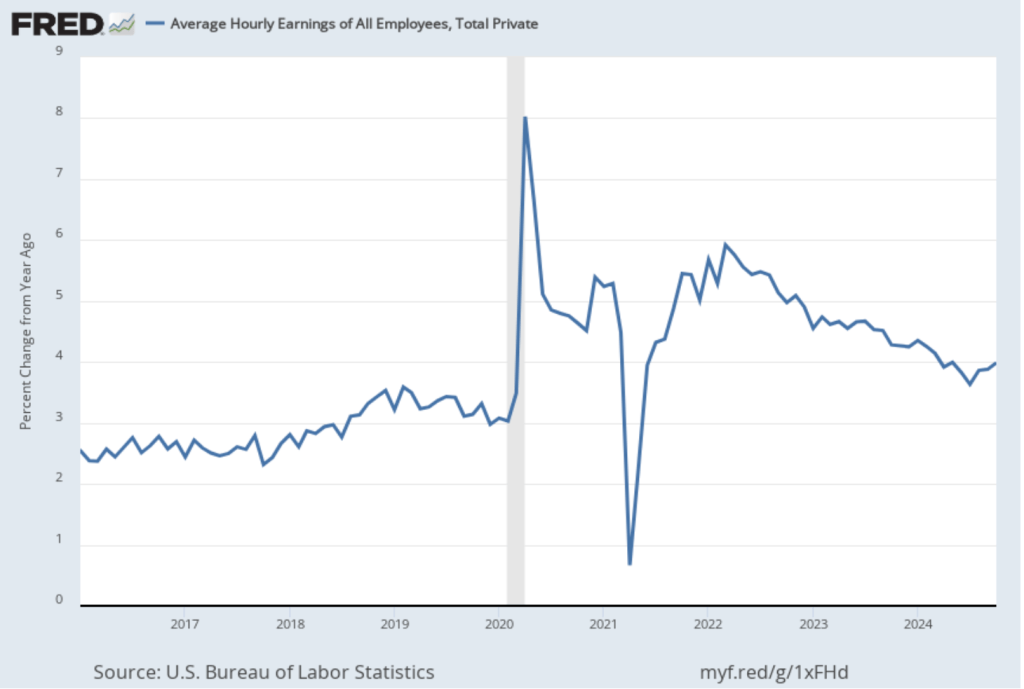
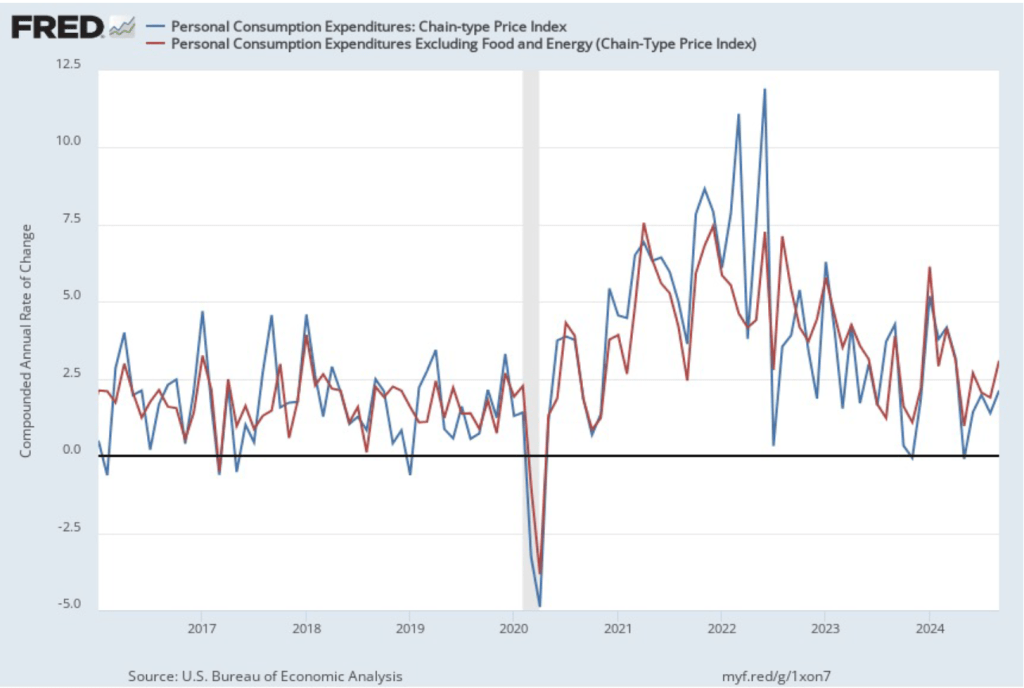
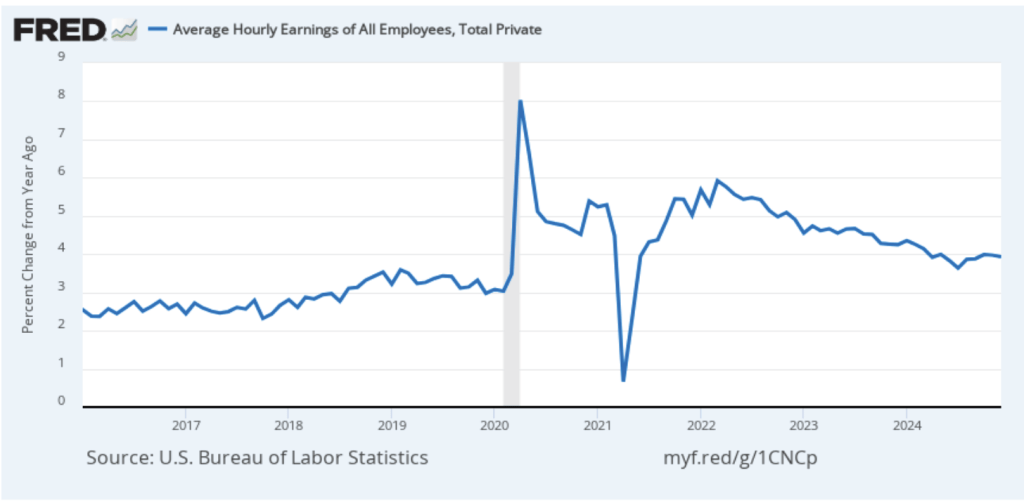
The establishment survey also includes data on average hourly earnings (AHE). As we noted in this post, many economists and policymakers believe the employment cost index (ECI) is a better measure of wage pressures in the economy than is the AHE. The AHE does have the important advantage that it is available monthly, whereas the ECI is only available quarterly. The following figure shows the percentage change in the AHE from the same month in the previous year. The AHE increased 3.9 percent in December, down slightly from 4.0 percent in November.
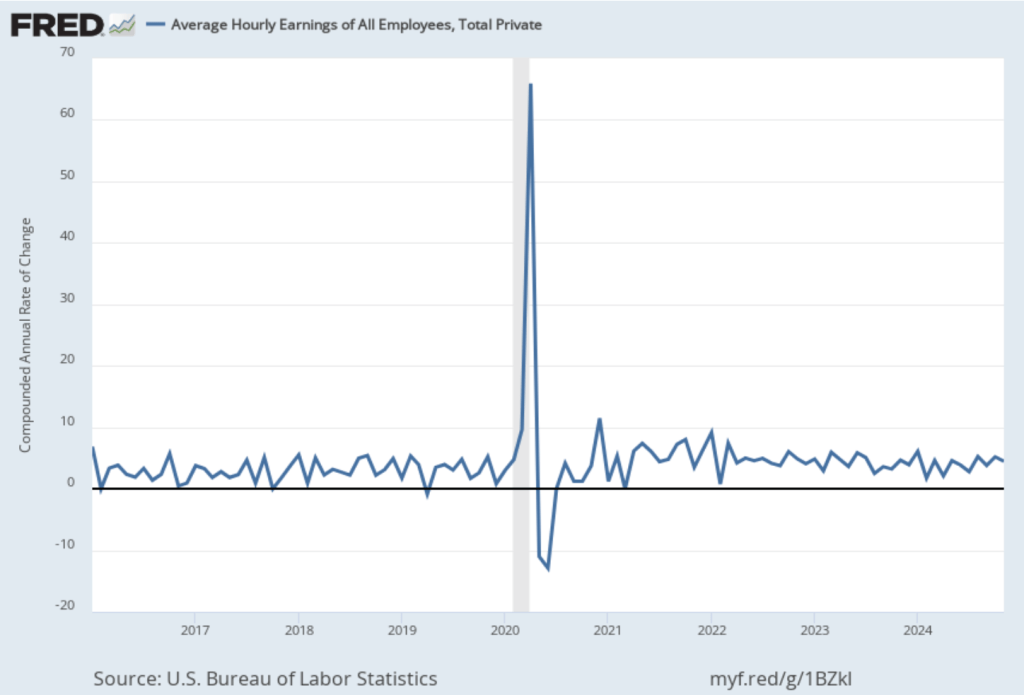
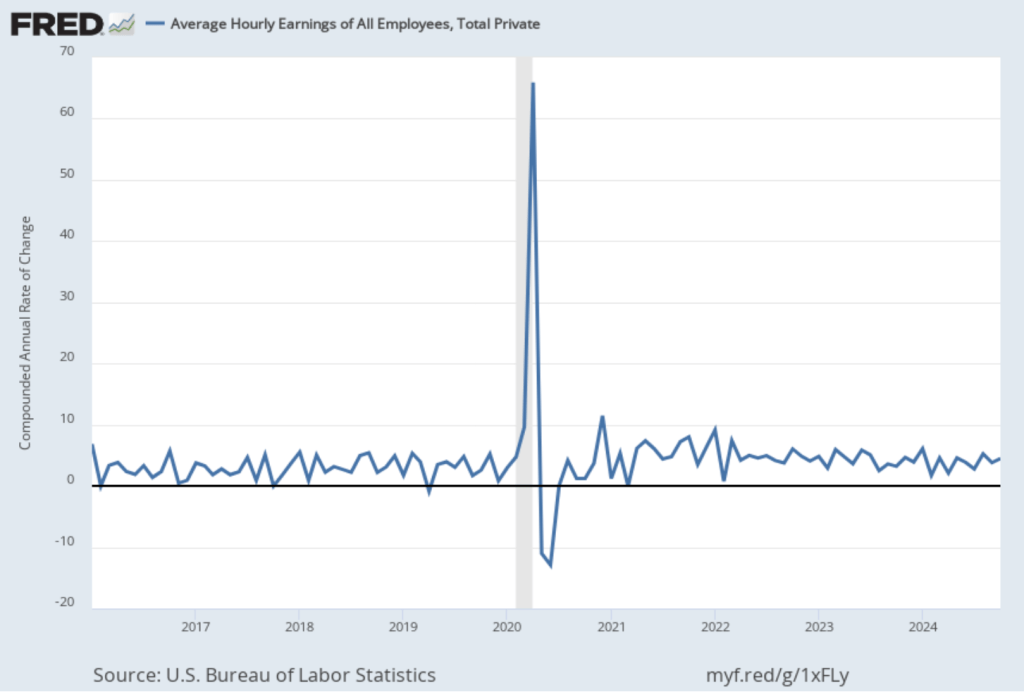
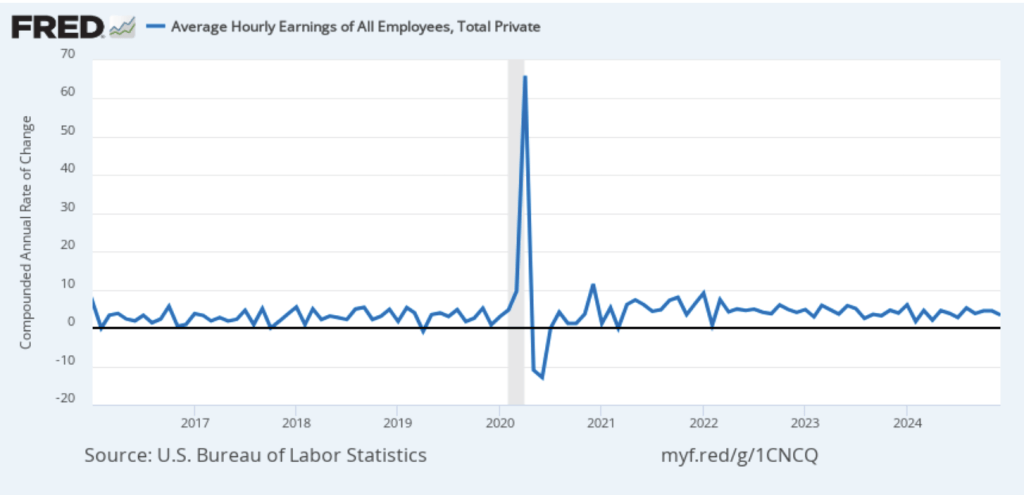
The following figure shows wage inflation calculated by compounding the current month’s rate over an entire year. (The figure above shows what is sometimes called 12-month wage inflation, whereas this figure shows 1-month wage inflation.) One-month wage inflation is much more volatile than 12-month wage inflation—note the very large swings in 1-month wage inflation in April and May 2020 during the business closures caused by the Covid pandemic. The December 1-month rate of wage inflation was 3.4 percent, a decline from the 4.9 percent rate in November. Whether measured as a 12-month increase or as a 1-month increase, AHE is still increasing somewhat more rapidly than is consistent with the Fed achieving its 2 percent target rate of price inflation.
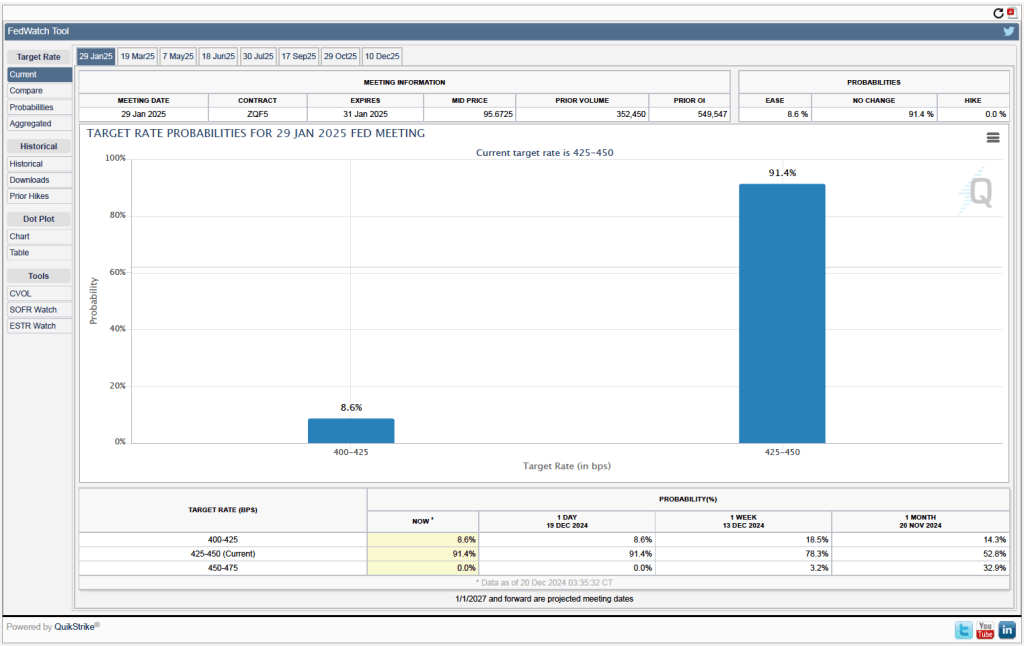
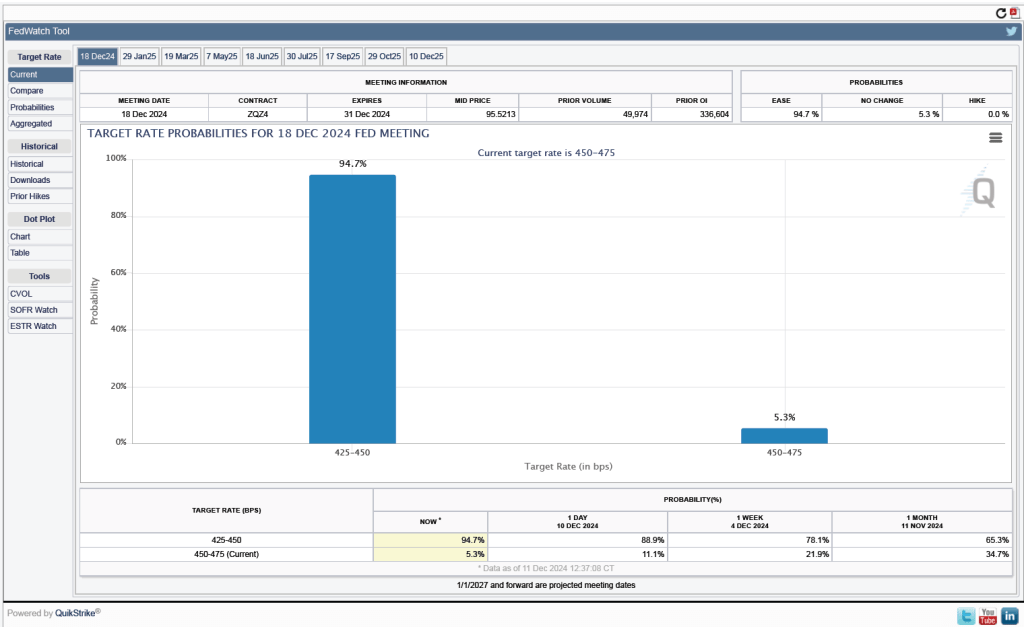
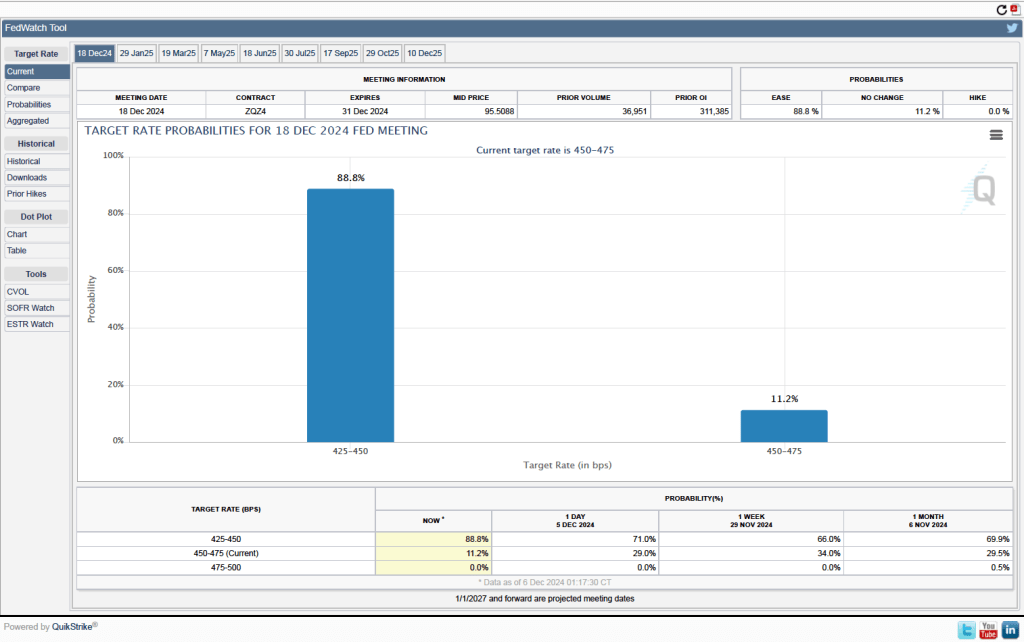
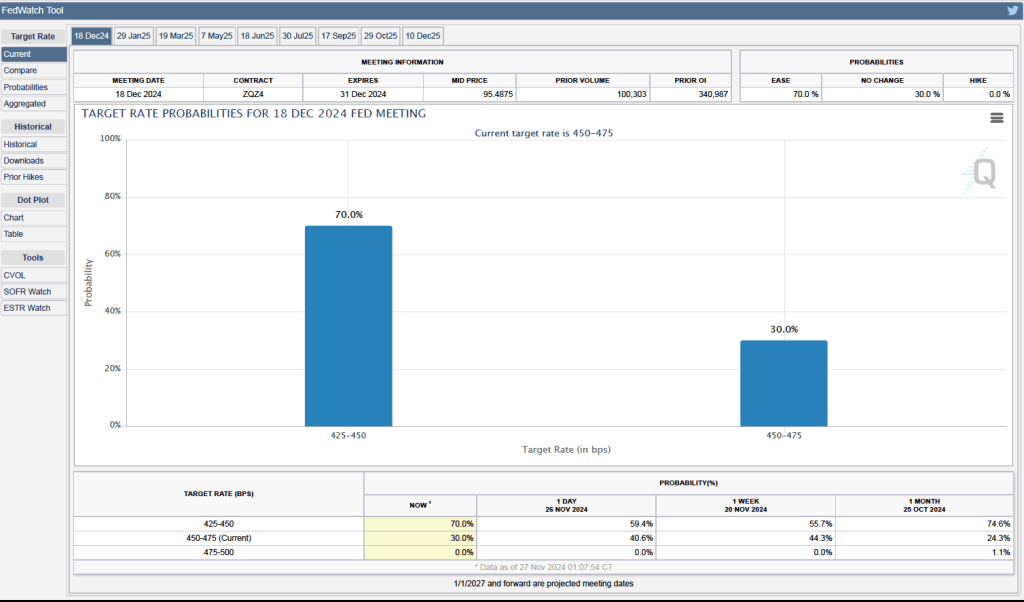
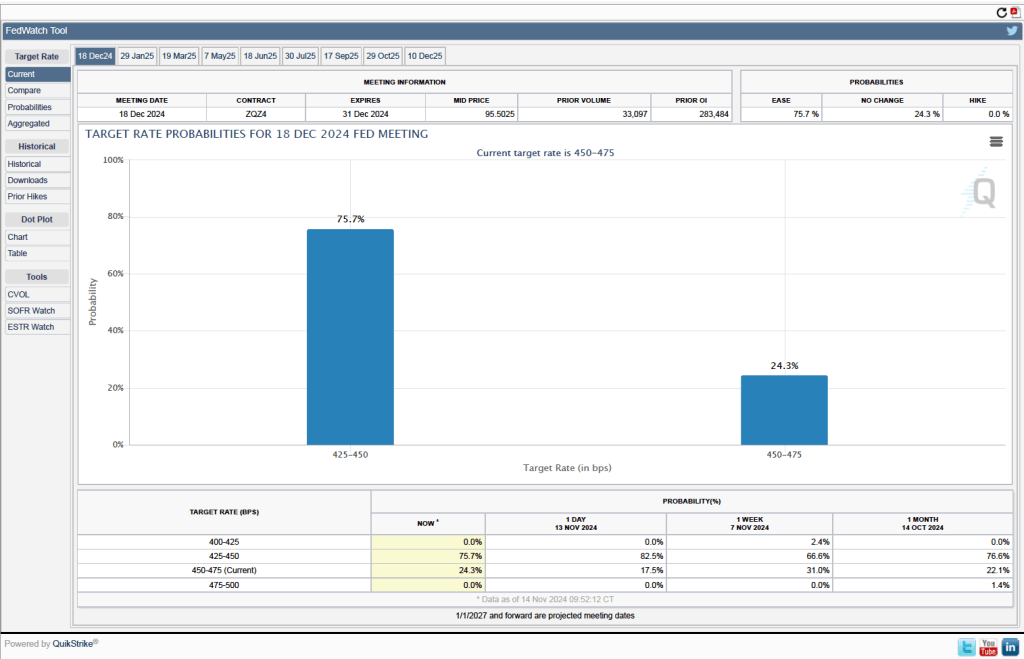
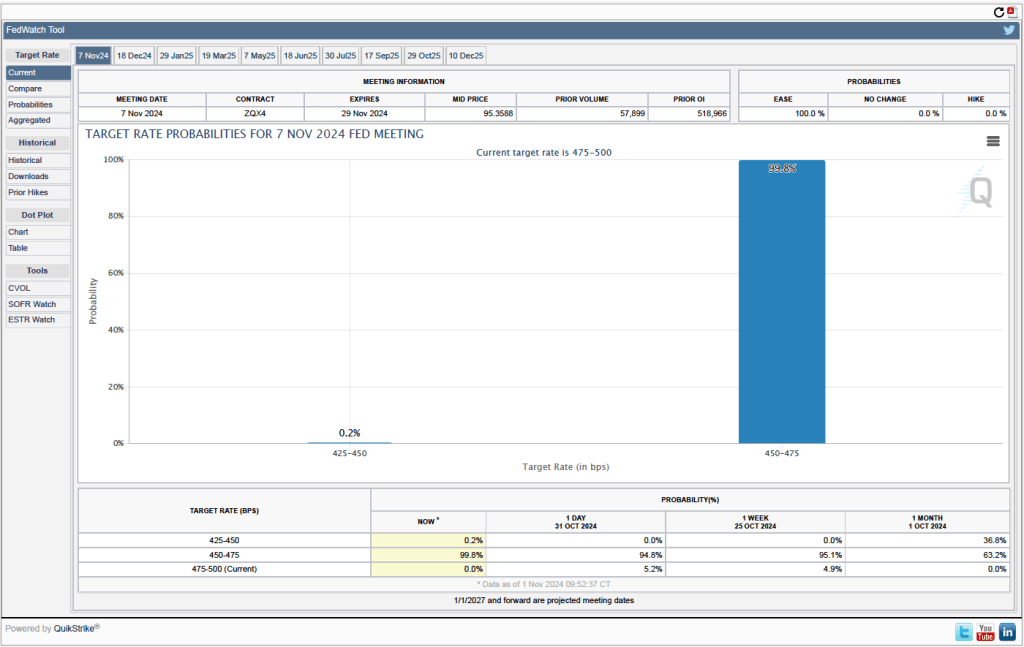
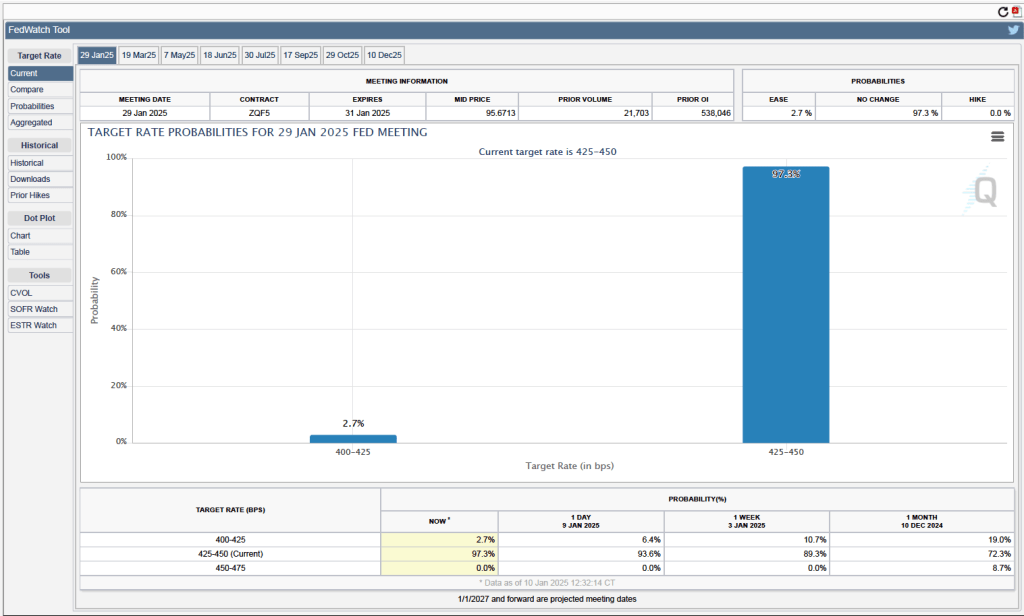
Given these data from the jobs report, it seems unlikely that the FOMC will reduce its target range for the federal funds rate at its next meeting. One indication of expectations of future rate cuts comes from investors who buy and sell federal funds futures contracts. (We discuss the futures market for federal funds in this blog post.) As shown in the following figure, today these investors assign a probability of 97.3 percent to the FOMC keeping its target range for the federal funds rate unchanged at the current range of 4.25 percent to 4.50 percent, at its next meeting. Investors assign a probability of only 2.7 percent of the committee cutting its target range by 25 basis points at that meeting.
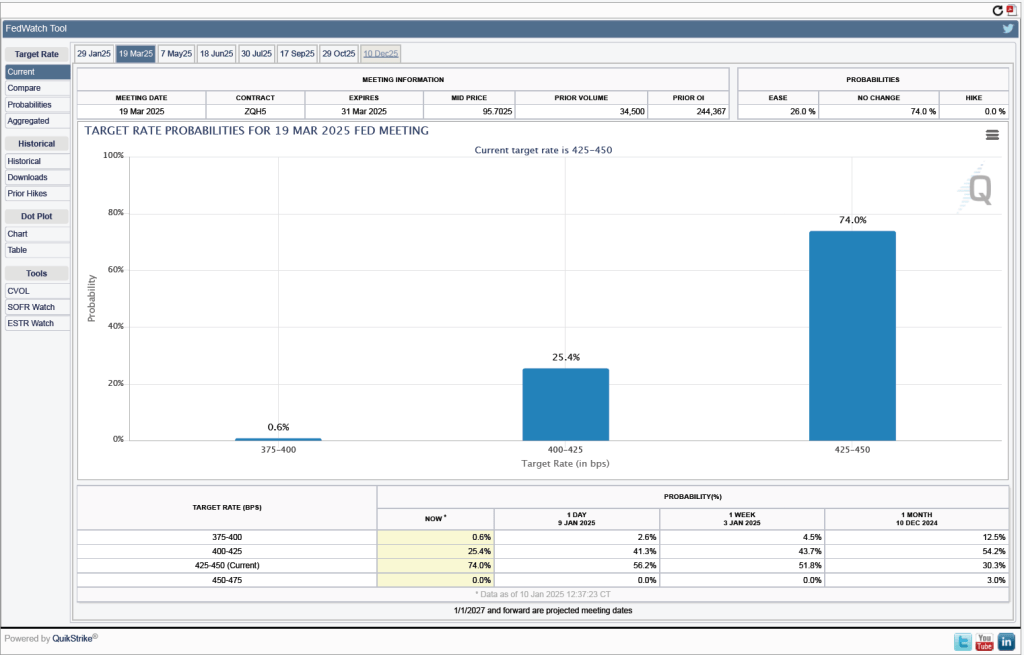
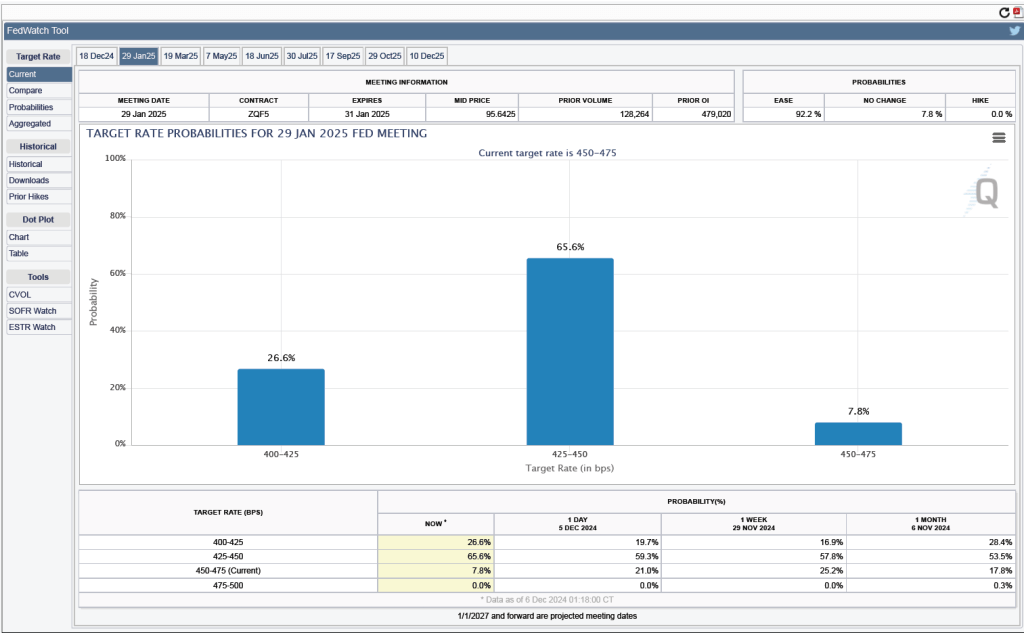
As the following figure shows, investors also expect the FOMC to keep its target range unchanged at its meeting on March 18-19, although there is greater uncertainty. Investors assign:
- A 74.0 percent probability that the FOMC keeps its target range for the federal funds rate unchanged
- A 25.4 percent probability that the committee cuts its target range by 25 basis points
- A 0.6 percent probability that the committee cuts its target range by 50 basis points