Image created by ChatGPT
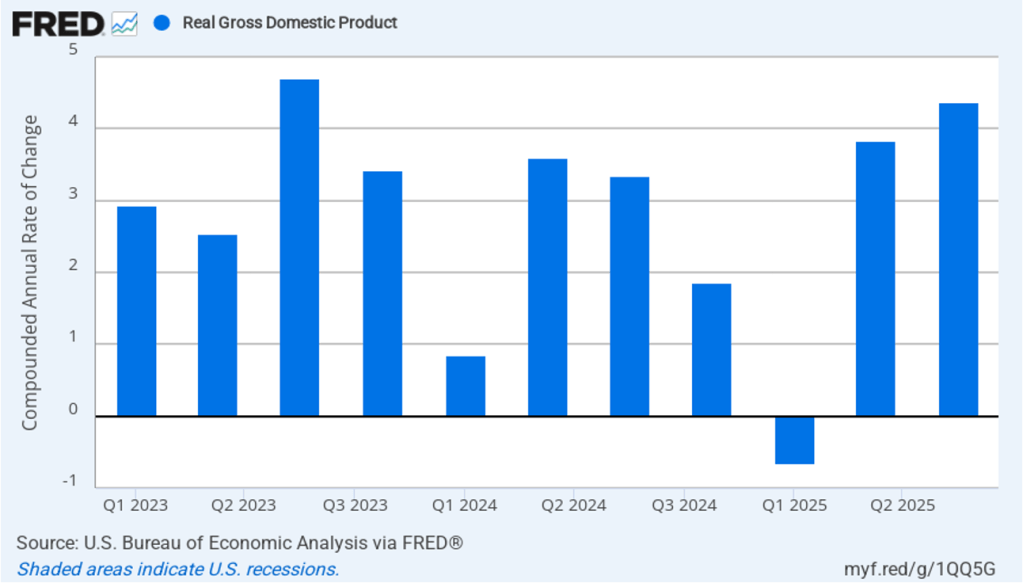
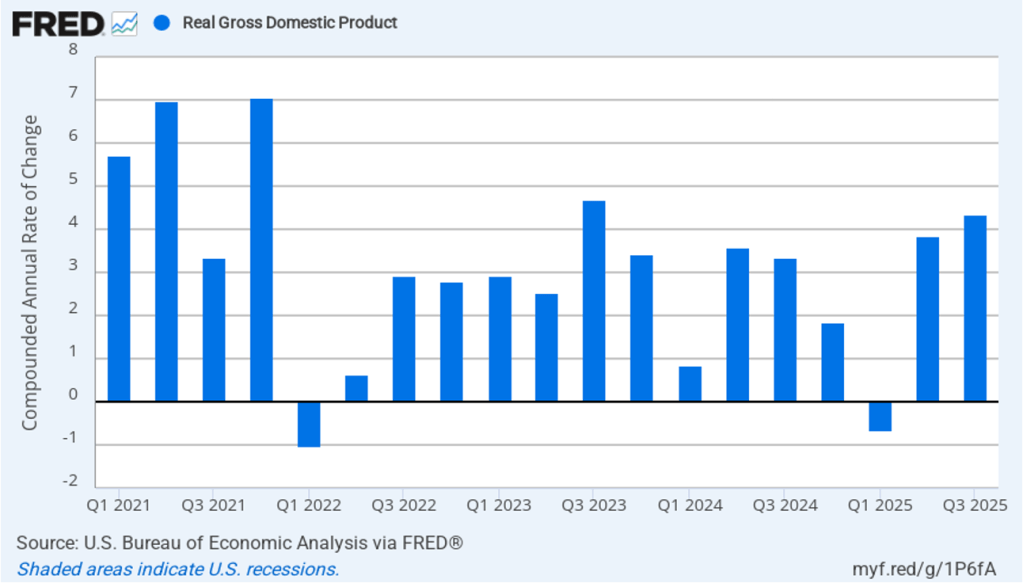
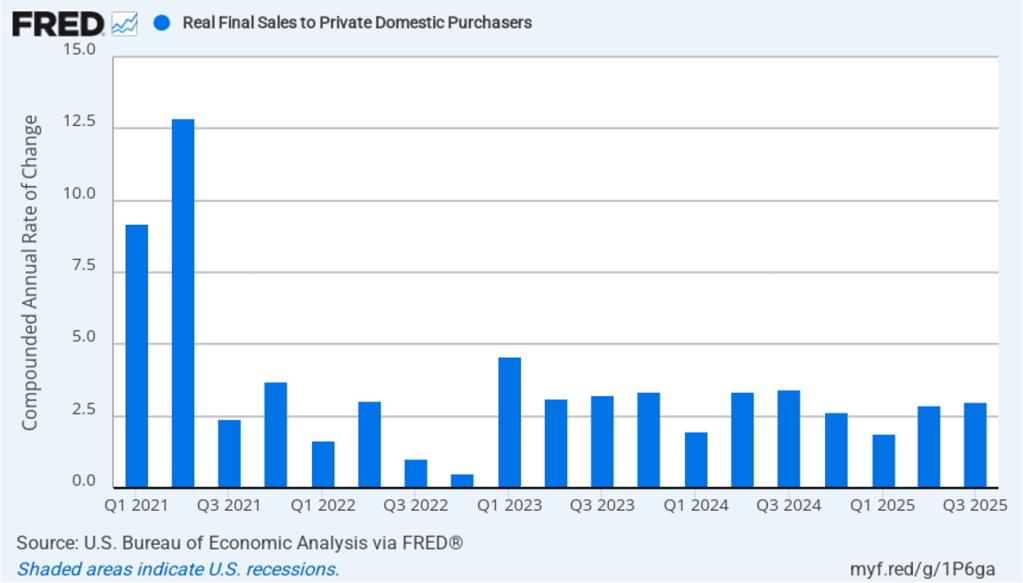
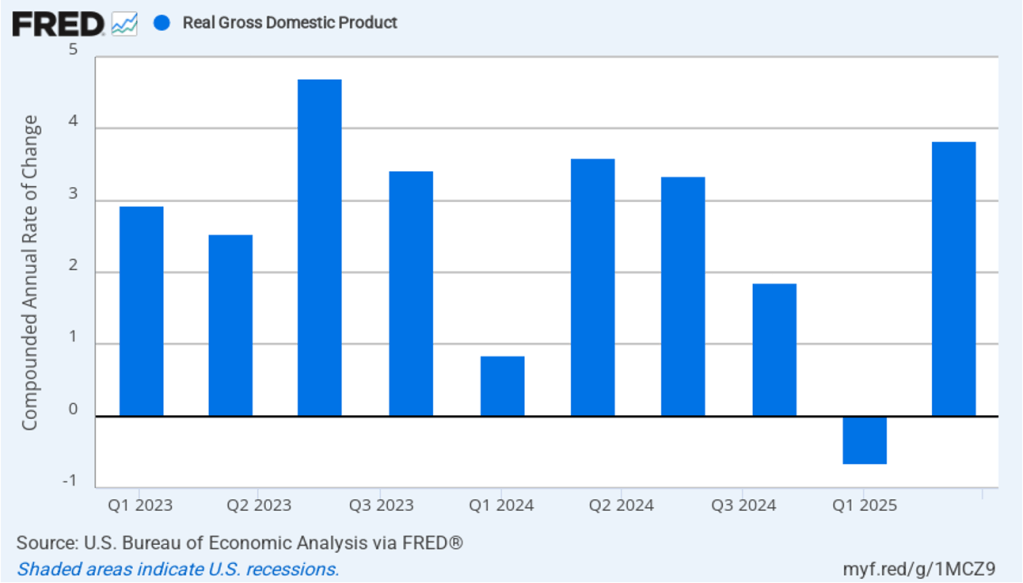
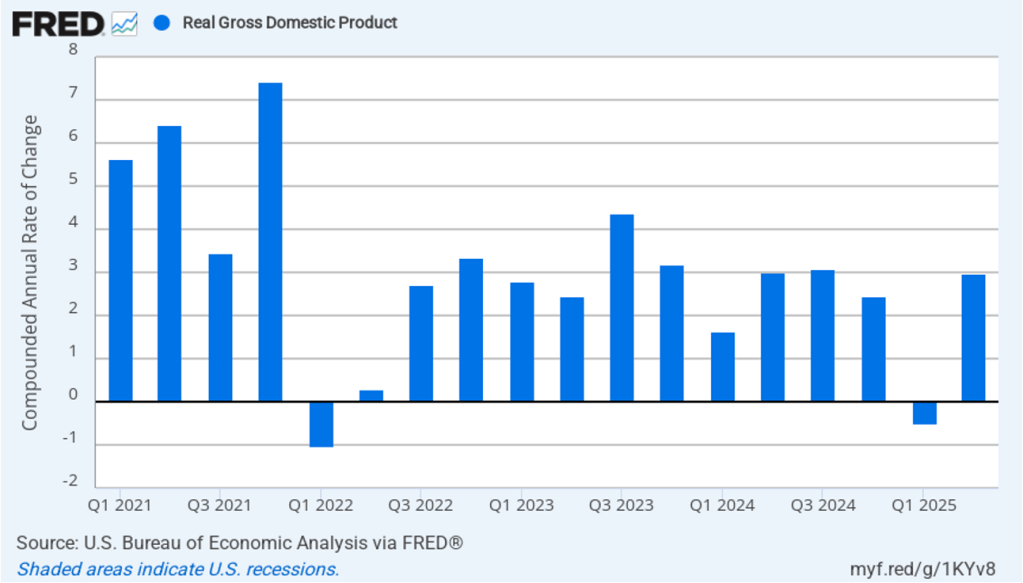
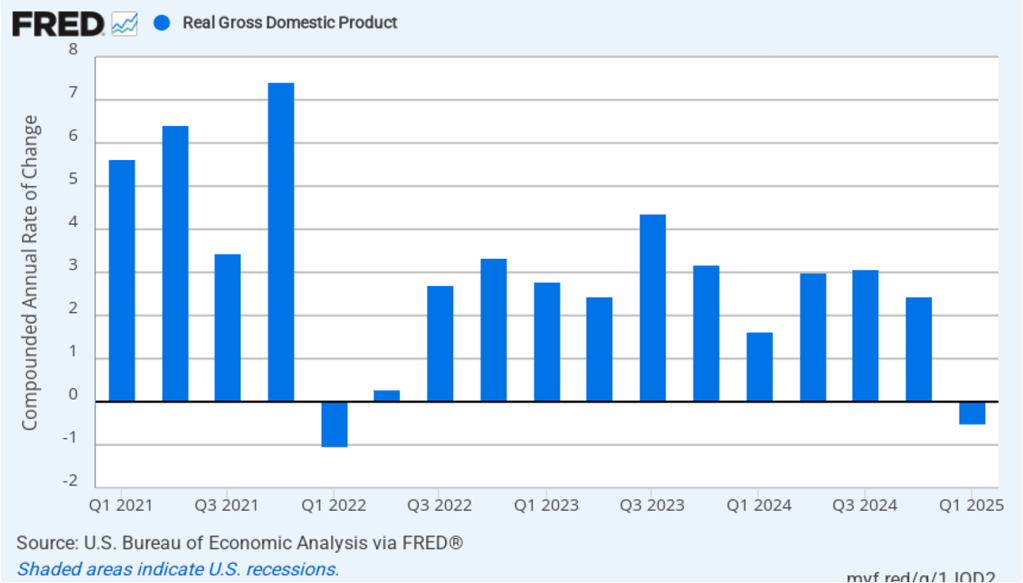
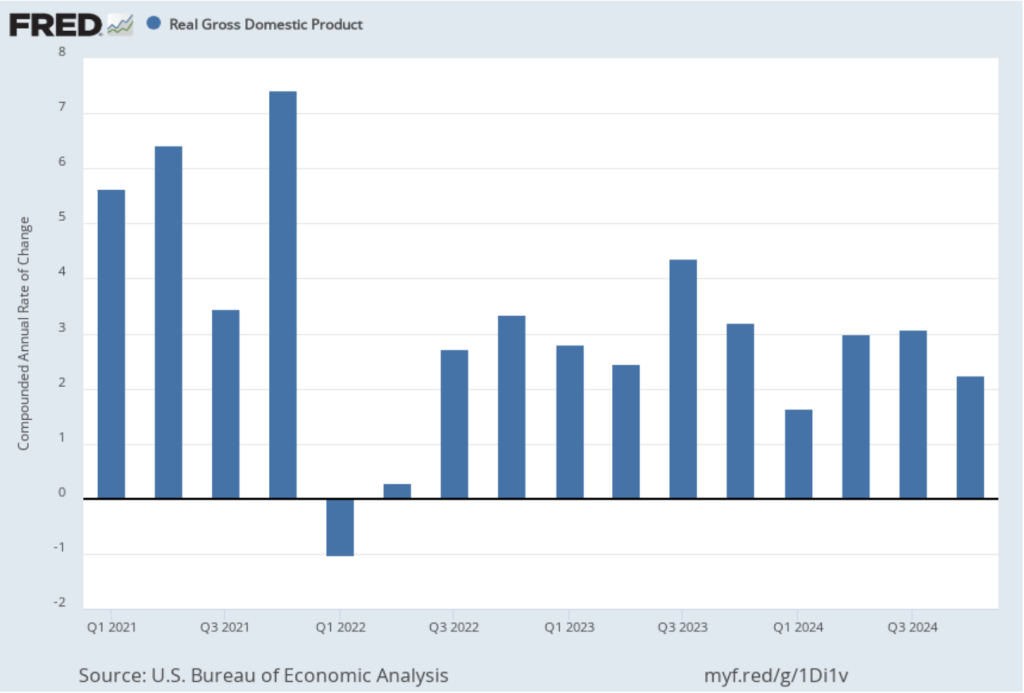
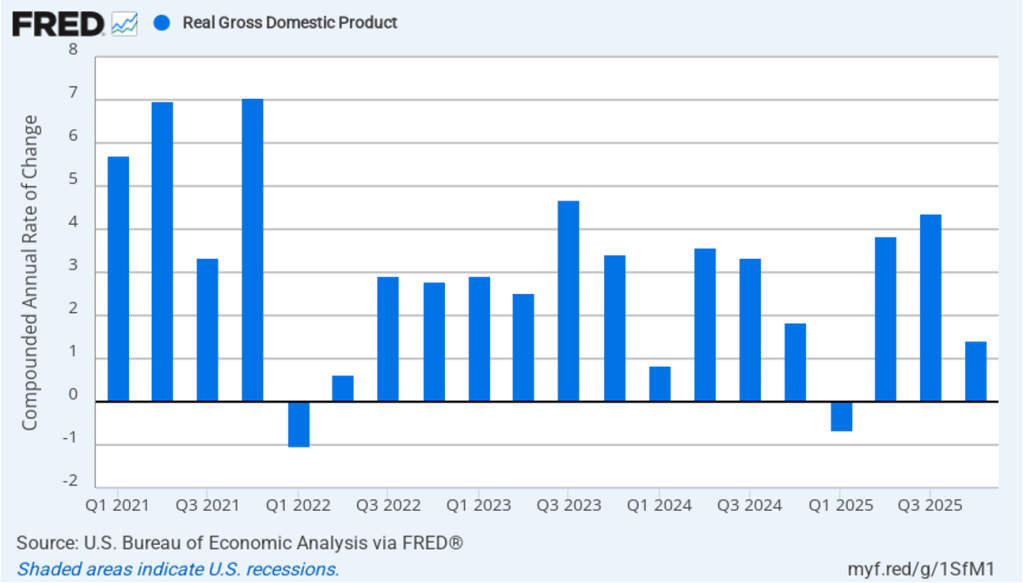
Recent macro data had been showing relatively strong growth in output and steady growth in employment. This morning’s release of the initial estimate of real GDP growth for the fourth quarter of 2025 from the Bureau of Economic Analysis (BEA) was expected to show continuing solid growth. (The report can be found here.) Instead, the BEA estimates that real GDP increased in the fourth quarter by only 1.4 percent measured at an annual rate. Growth was down sharply from the 4.4 percent increase in the third quarter of 2025. Economists surveyed by the Wall Street Journal had forecast a 2.5 percent increase. The following figure shows the estimated rates of GDP growth in each quarter beginning with the first quarter of 2021.
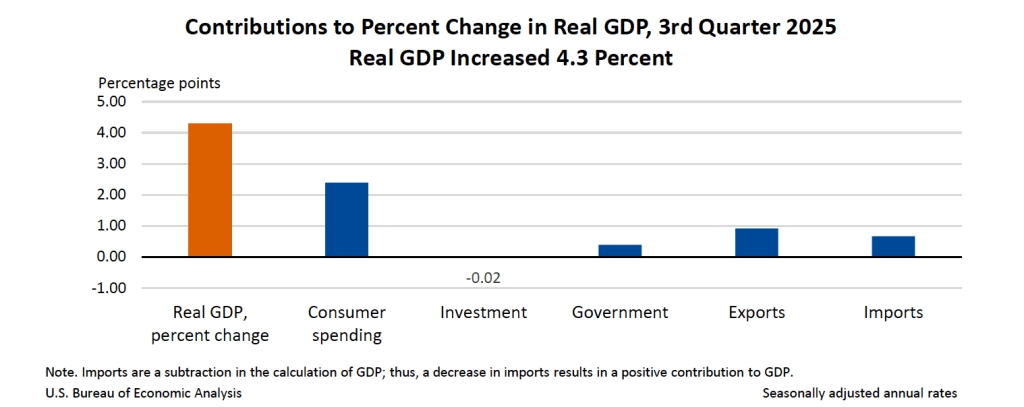
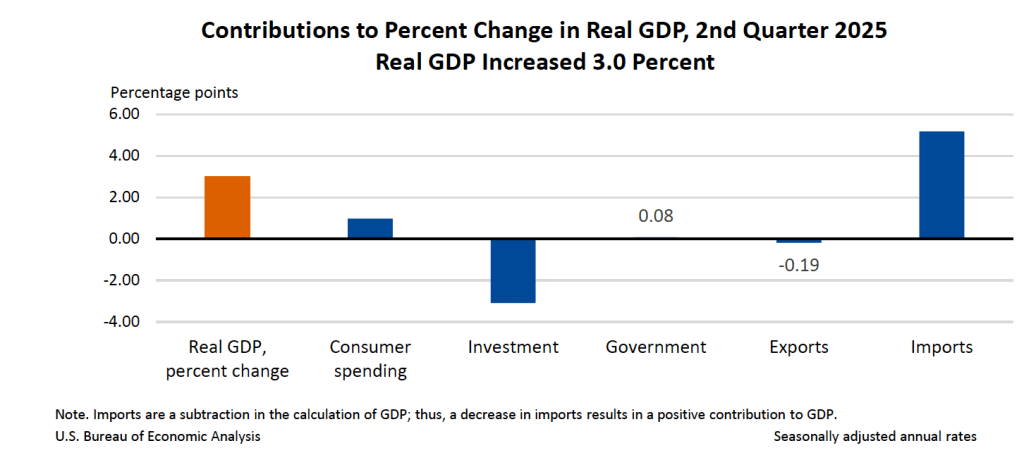
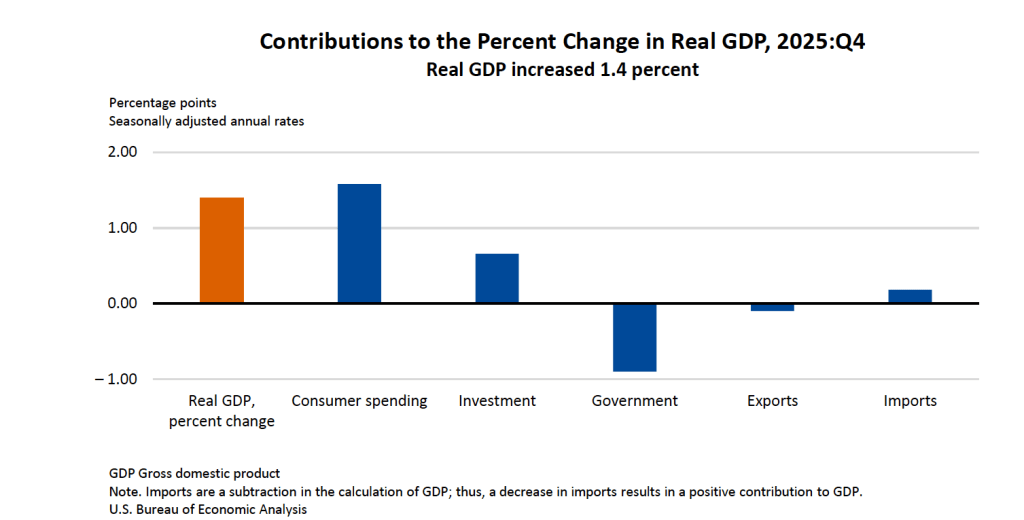
As the following figure—taken from the BEA report—shows, the decline in real government expenditures of –0.90 percent at an annual rate was the most important factor contributing to the slowing growth in real GDP during the fourth quarter. The decline in government expenditures is largely attributable to the federal government shutdown, which lasted from October 1, 2025 to November 12, 2025.
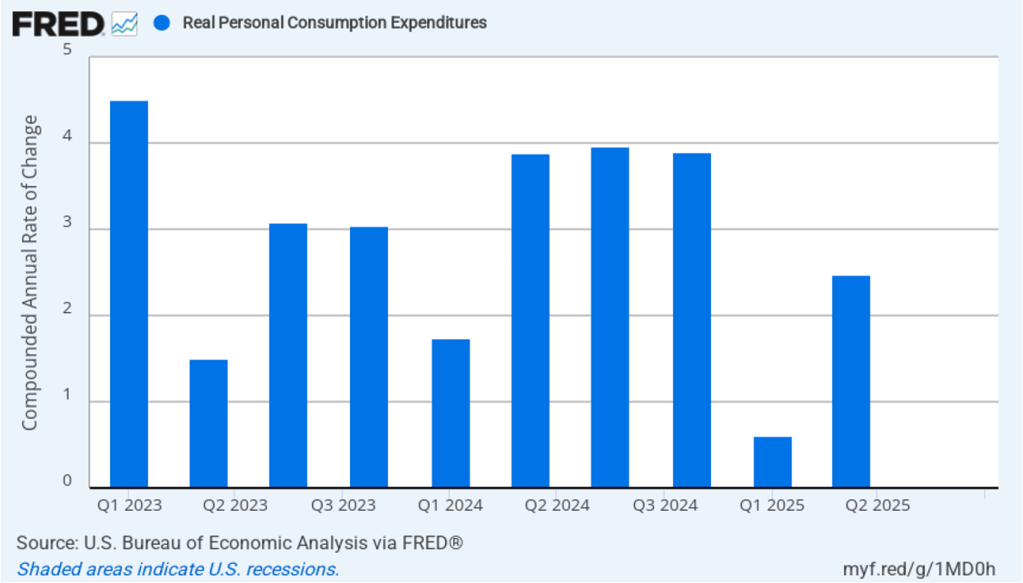
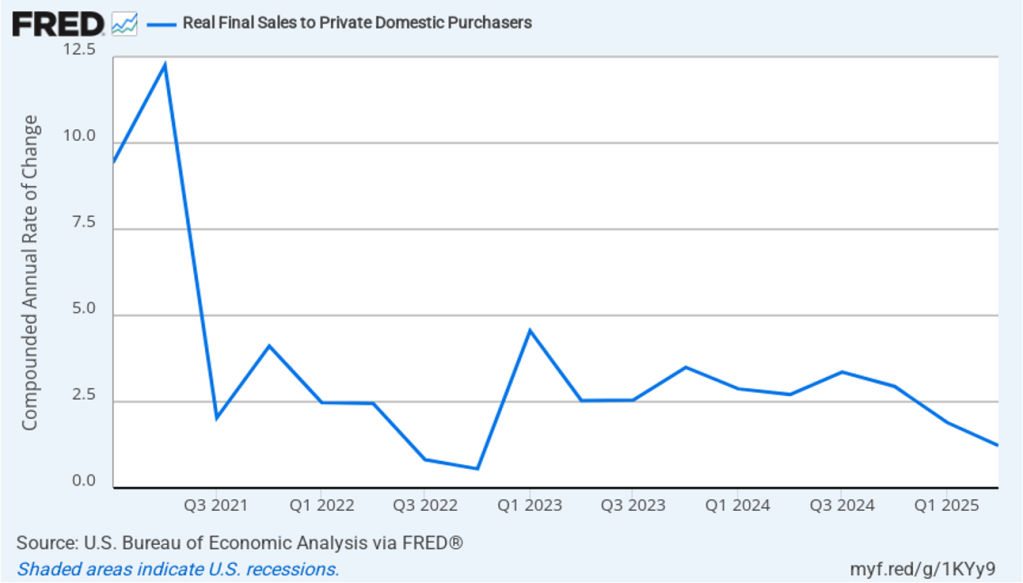
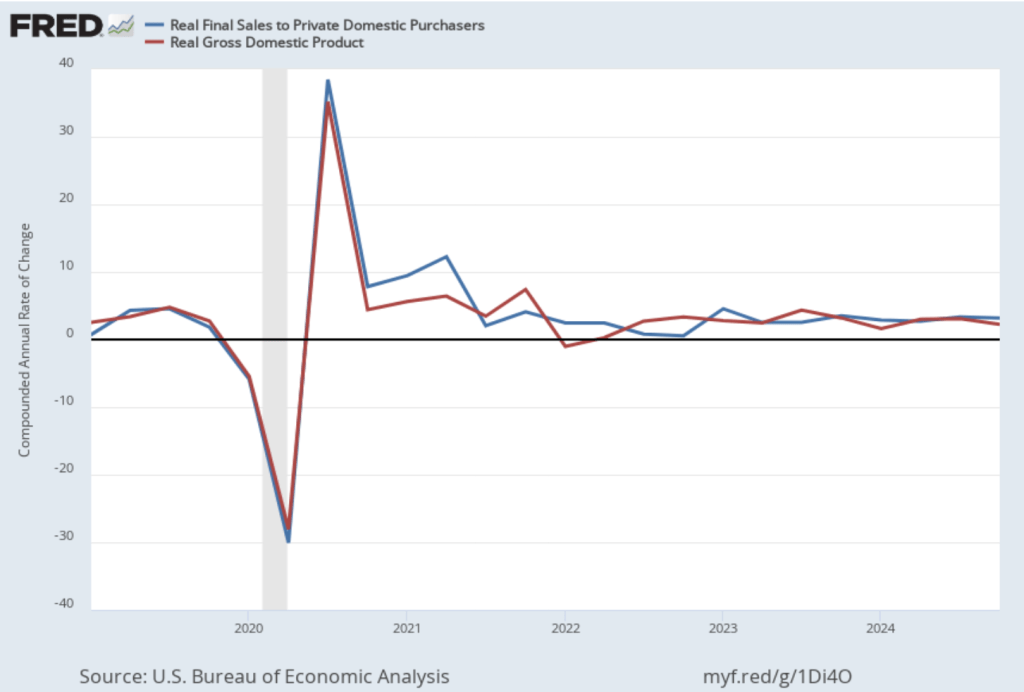
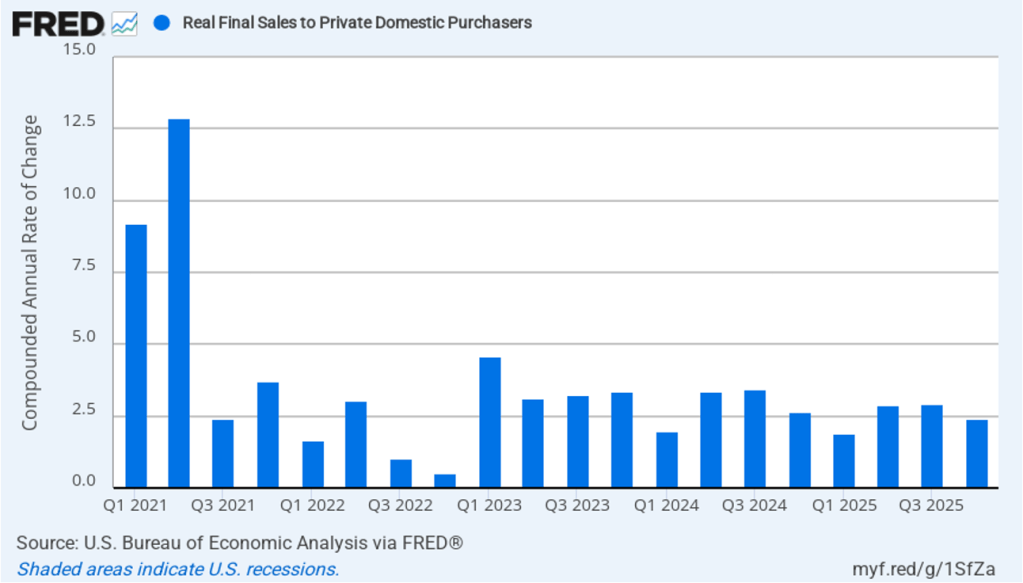
As we’ve discussed in previous blog posts, to better gauge the state of the economy, policymakers—including Fed Chair Jerome Powell—often prefer to strip out the effects of imports, inventory investment, and government expenditures—which can be volatile—by looking at real final sales to private domestic purchasers, which includes only spending by U.S. households and firms on domestic production. As the following figure shows, real final sales to domestic purchasers increased by 2.4 percent at an annual rate in the fourth quarter, which was well above the 1.4 percent increase in real GDP and also above the U.S. economy’s expected long-run annual real growth rate of 1.8 percent. Note also that real final sales to private domestic purchasers grew by 2.9 percent in the third quarter, during which real GDP grew by 4.4 percent, and by 1.9 percent in the first quarter of 2025, when real GDP declined by 0.6 percent. So this measure of output is more stable and likely is a better indicator of the underlying growth rate in the economy than is growth in real GDP.
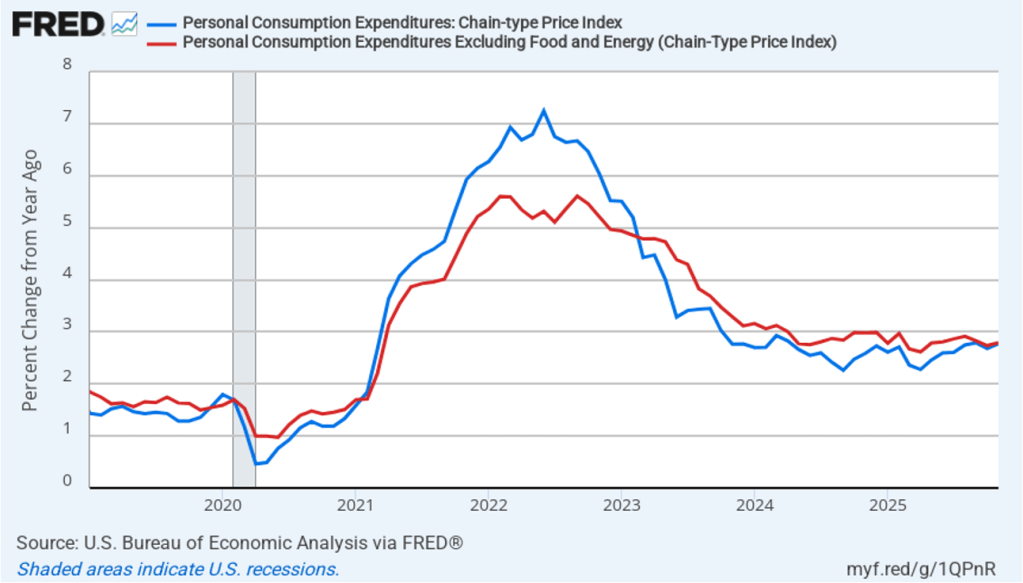
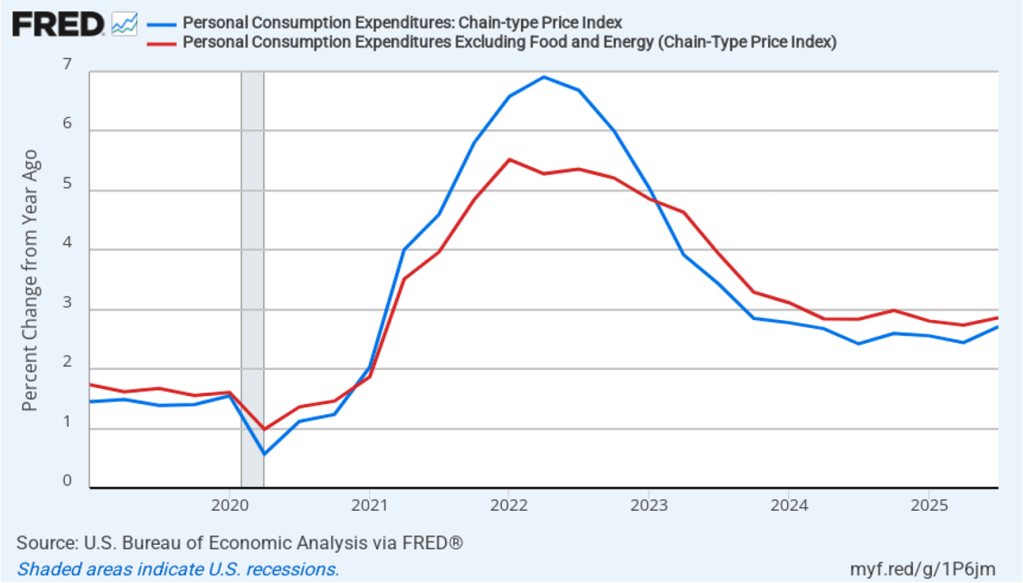
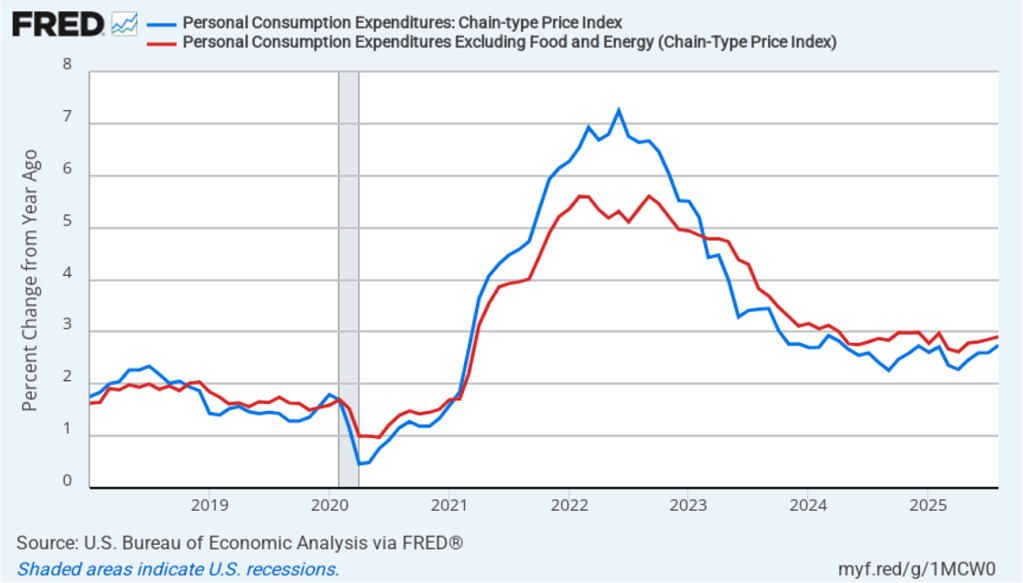
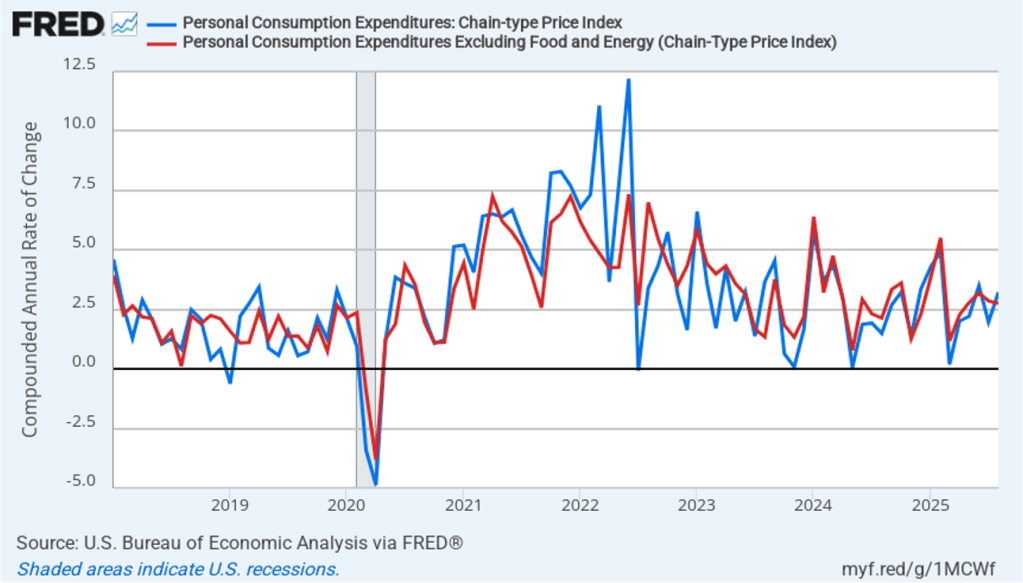
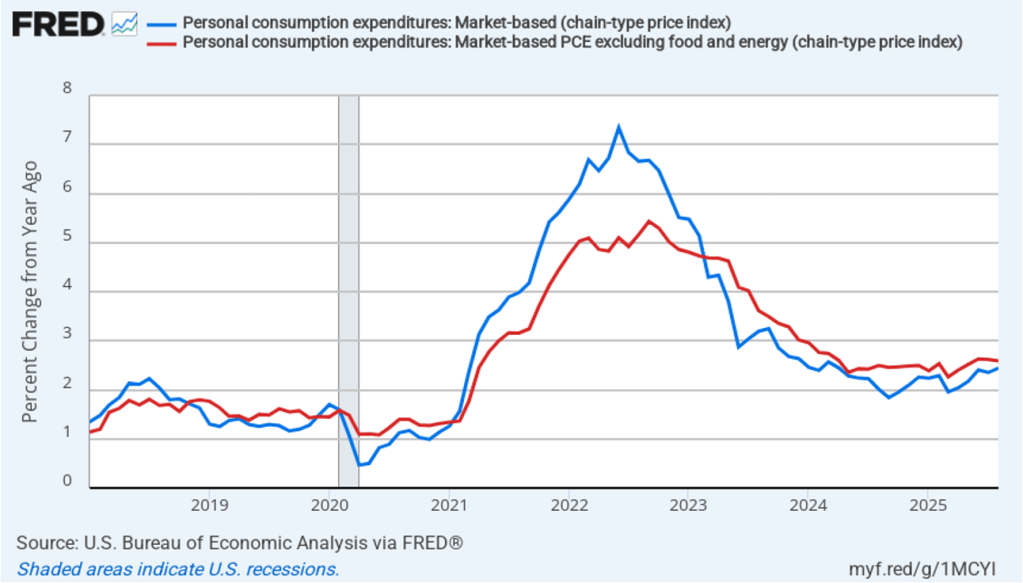
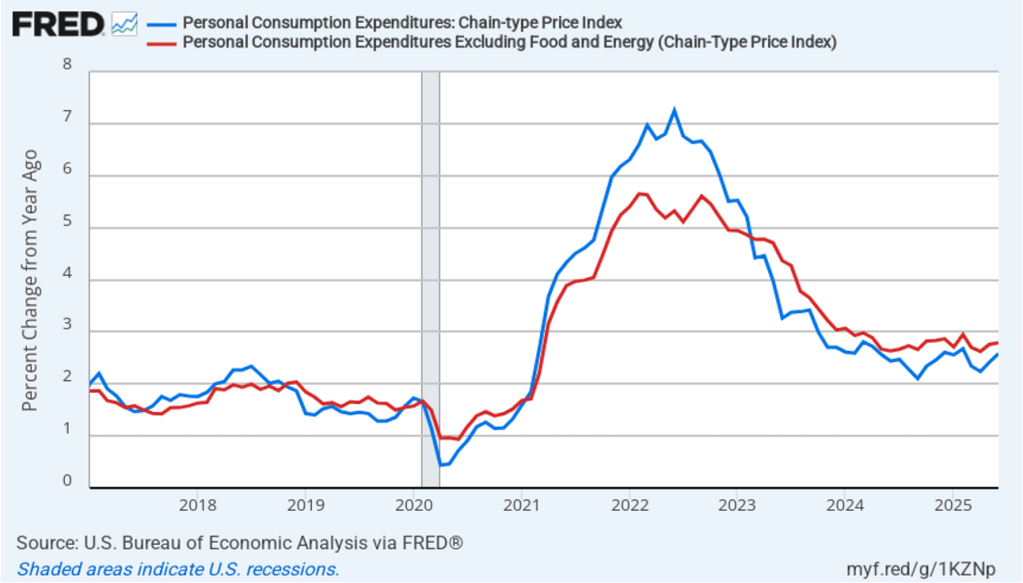
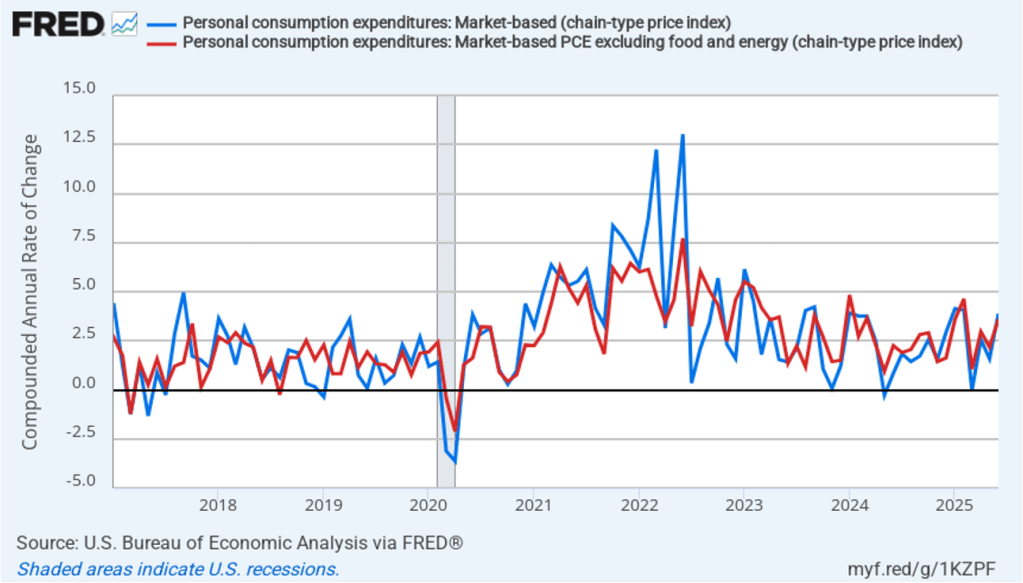
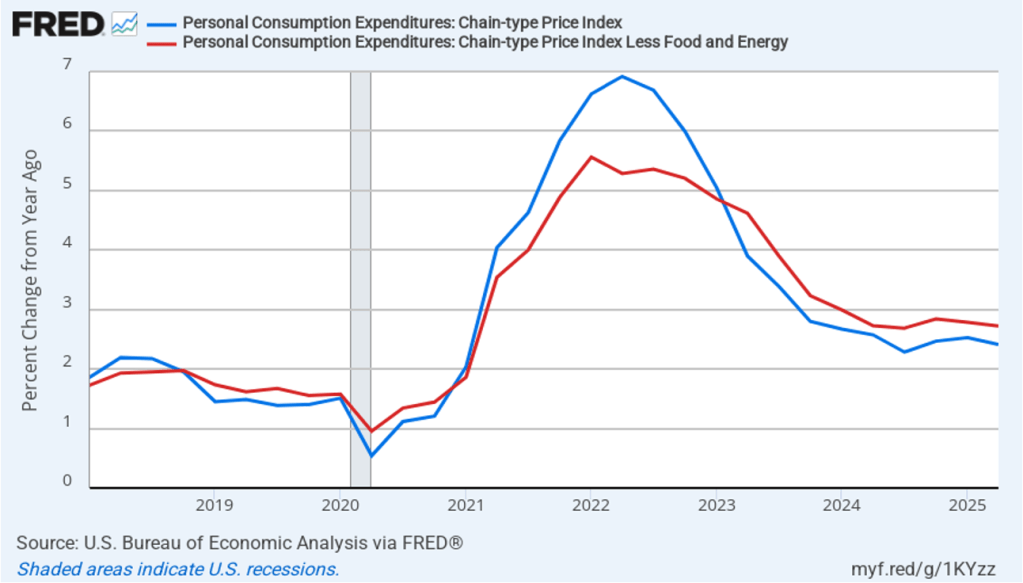
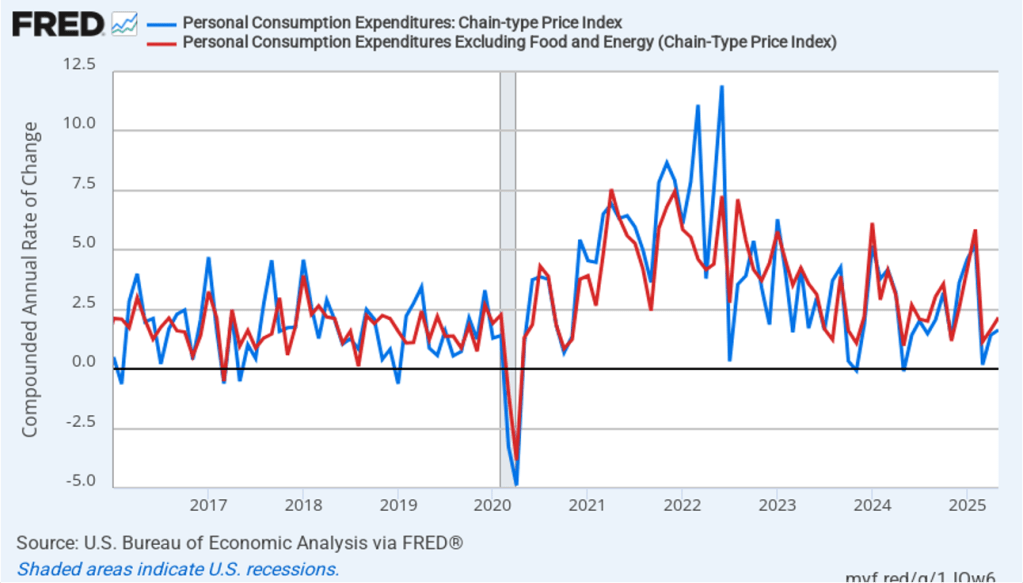
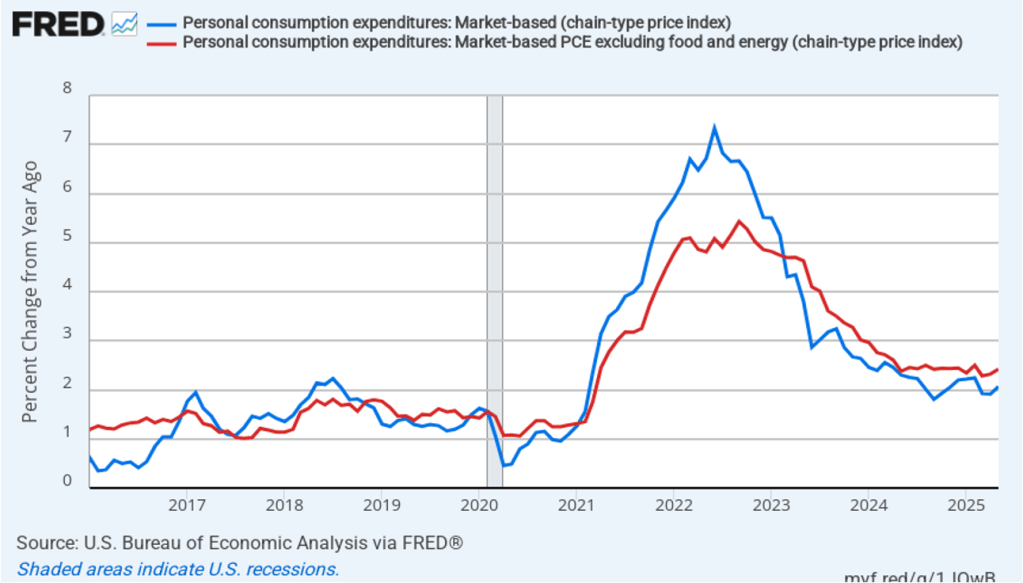
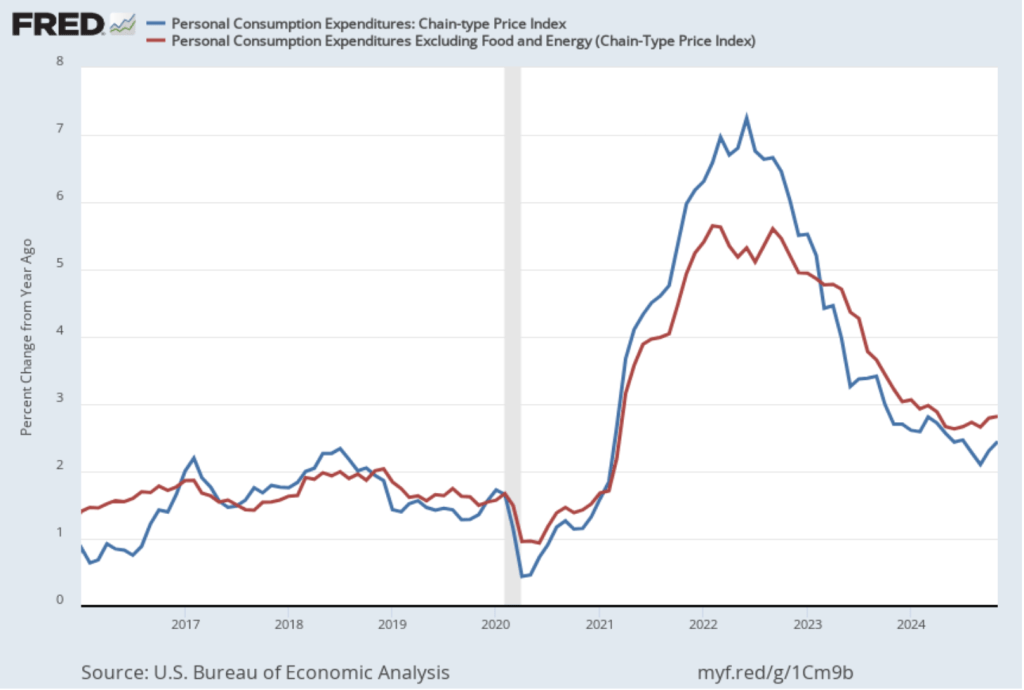
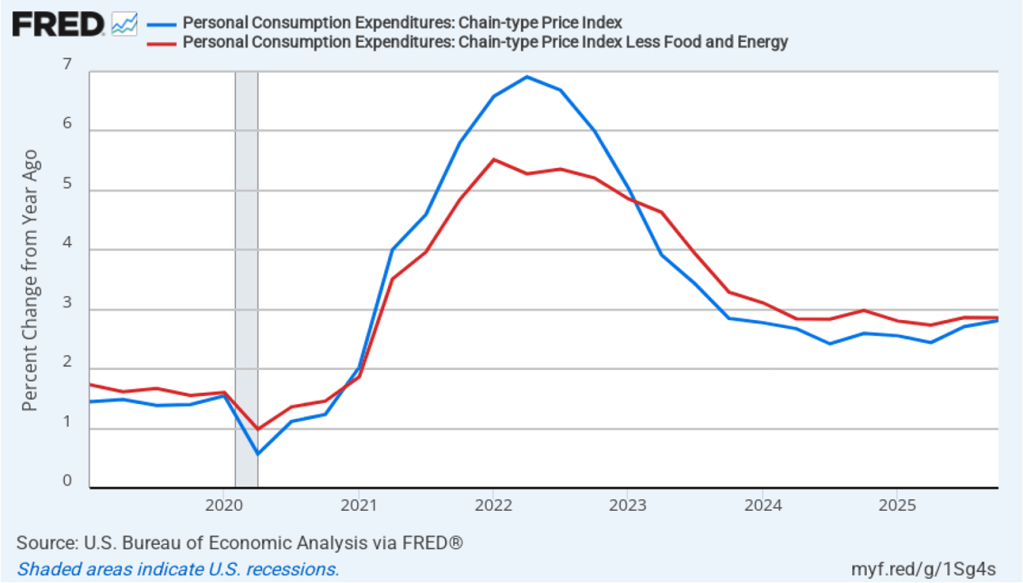
The BEA report this morning also included quarterly data on the personal consumption expenditures (PCE) price index. The Fed relies on annual changes in the PCE price index to evaluate whether it’s meeting its 2 percent annual inflation target. The following figure shows headline PCE inflation (the blue line) and core PCE inflation (the red line)—which excludes energy and food prices—for the period since the first quarter of 2019, with inflation measured as the percentage change in the PCE from the same quarter in the previous year. In the fourth quarter of 2025, headline PCE inflation was 2.8 percent, up slightly from 2.7 percent in the third quarter. Core PCE inflation in the third quarter was 2.9 percent, unchanged from the third quarter. Both headline PCE inflation and core PCE inflation remained above the Fed’s 2 percent annual inflation target.
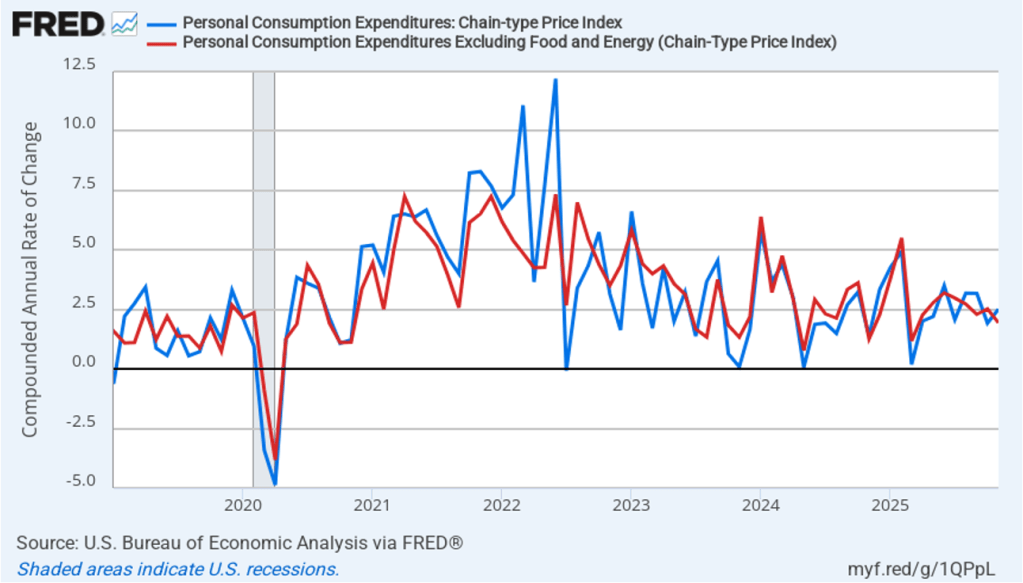
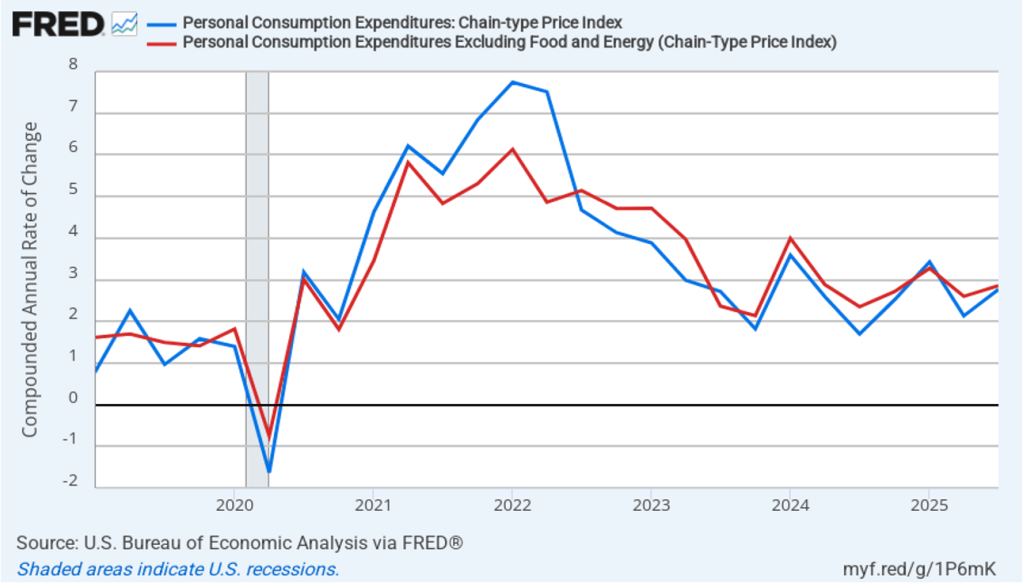
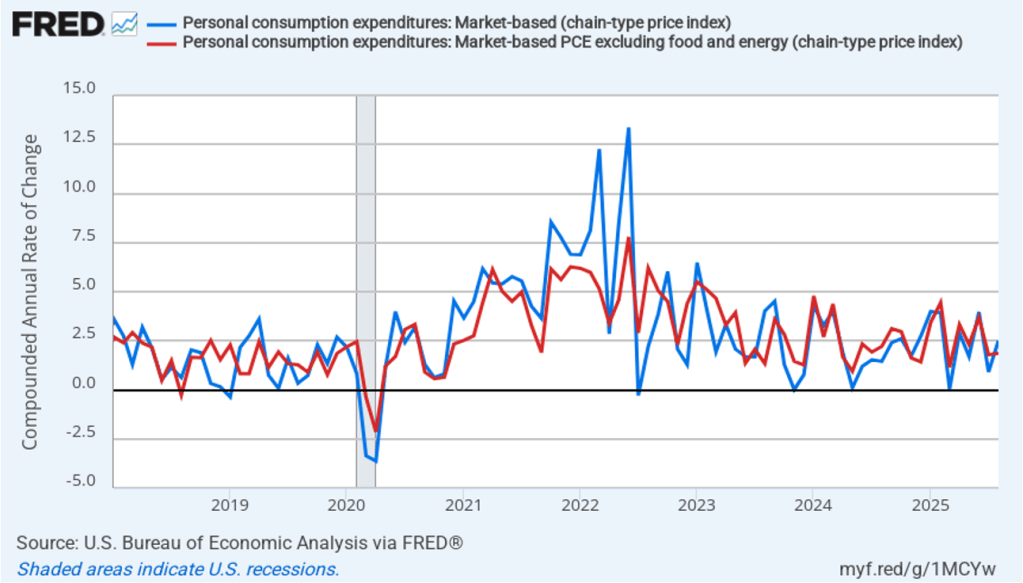
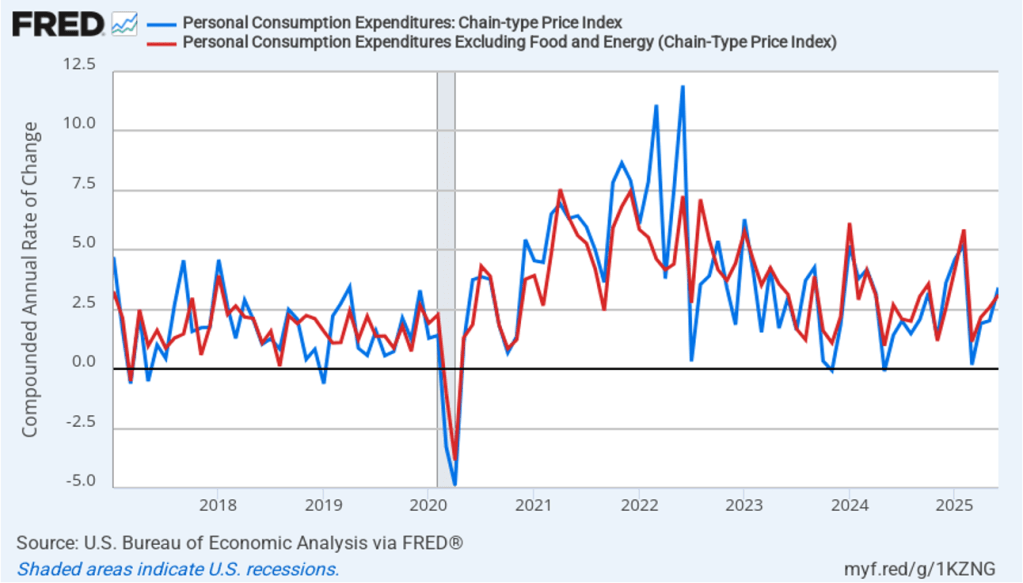
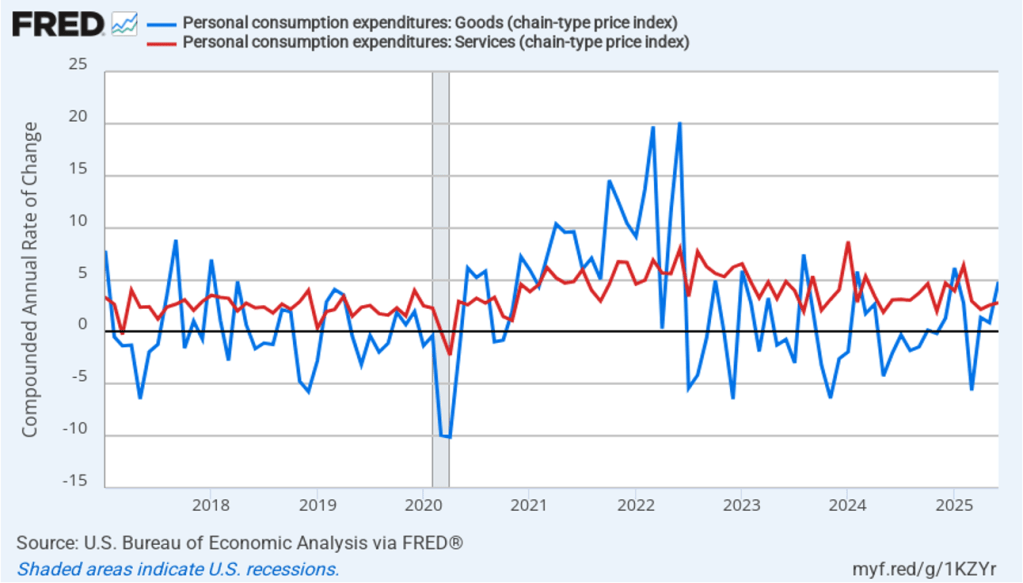
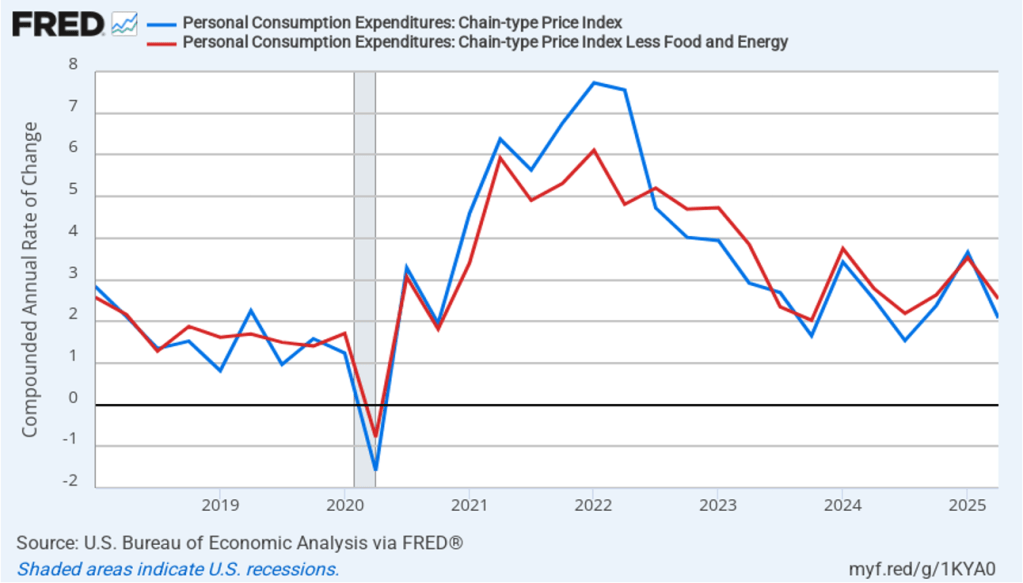
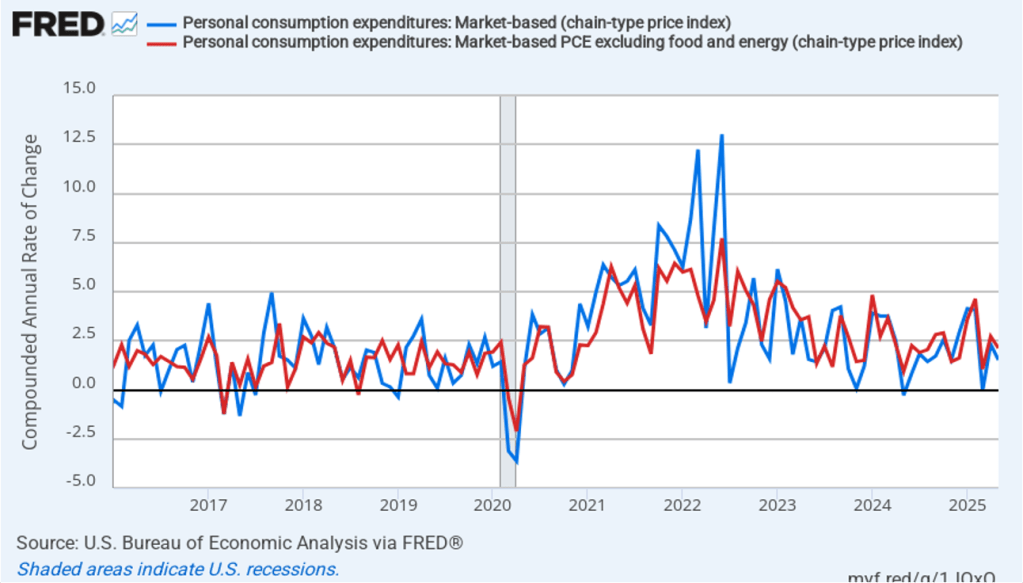
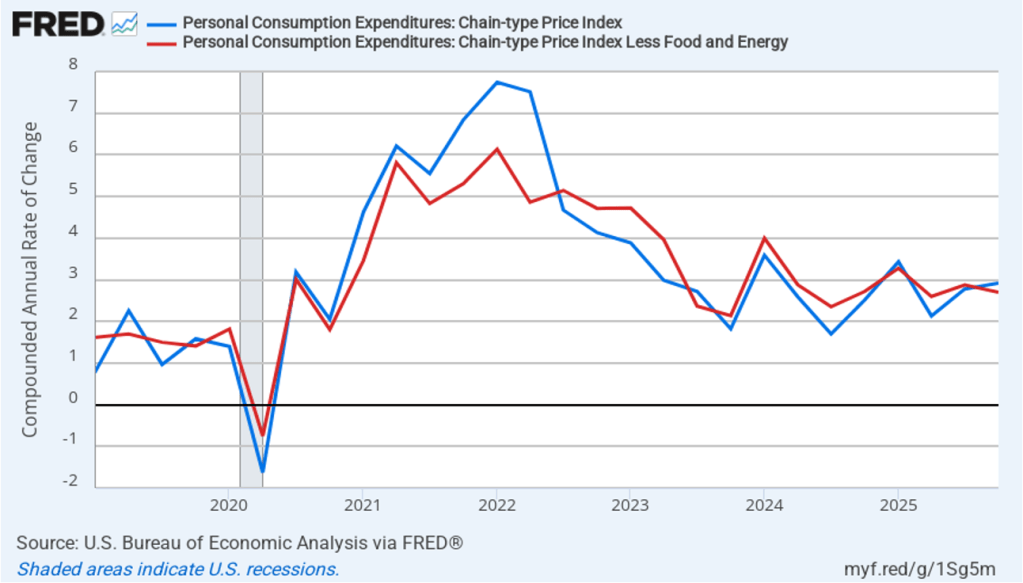
The following figure shows quarterly PCE inflation and quarterly core PCE inflation calculated by compounding the current quarter’s rate over an entire year. Measured this way, headline PCE inflation increased to 2.9 percent in the fourth quarter of 2025, up from to 2.8 percent in the third quarter. Core PCE inflation fell to 2.7 percent in the fourth quarter of 2025 from 2.9 percent in the third quarter. Measured this way, both core and headline PCE inflation were also above the Fed’s target.
Today was also notable for a decision from the U.S. Supreme Court that invalidated some of the Trump administration’s tariff increases that began to be implemented in April 2025. President Trump announced this afternoon that he would impose a new 10 percent across-the-board tariff, relying on Section 122 of the Trade Act of 1974, rather than on the International Emergency Economic Powers Act (IEEPA), which the Supreme Court ruled today did not authorize presidents to unilaterally impose tariffs.
Today’s developments appeared unlikely to have much effect on the views of the members of the Fed’s policymaking Federal Open Market Committee (FOMC). The FOMC is unlikely to lower its target for the federal funds rate at its next meeting on March 17–18. The probability that investors in the federal funds futures market assign to the FOMC keeping its target rate unchanged at that meeting increased only slightly from 94.6 percent yesterday to 96.0 percent this afternoon.