
Join authors Glenn Hubbard and Tony O’Brien as they discuss how core economic principles illuminate two of the most pressing policy debates facing the economy today: tariffs and artificial intelligence. Drawing on a recent Supreme Court decision striking down broad tariff increases, Hubbard and O’Brien explain why economists view tariffs as taxes, who ultimately bears their burden, and how trade policy uncertainty shapes business decisions, inflation, and economic growth—bringing textbook concepts like tax incidence, intermediate goods, and GDP measurement vividly to life. The conversation then turns to AI, where they cut through market hype and dire predictions to place generative AI in historical context as a general‑purpose technology, comparing it to past innovations that transformed jobs without eliminating work. Along the way, they explore how AI can both substitute for and complement labor, why fears of mass unemployment are likely overstated, and what economists can—and cannot yet—say about AI’s long‑run effects on productivity, profits, and the labor market.
Category: Ch11: Technology, Production, and Costs
NEW! 11-07-25- Podcast – Authors Glenn Hubbard & Tony O’Brien discuss Tariffs, AI, and the Economy
Glenn Hubbard and Tony O’Brien begin by examining the challenges facing the Federal Reserve due to incomplete economic data, a result of federal agency shutdowns. Despite limited information, they note that growth remains steady but inflation is above target, creating a conundrum for policymakers. The discussion turns to the upcoming appointment of a new Fed chair and the broader questions of central bank independence and the evolving role of monetary policy. They also address the uncertainty surrounding AI-driven layoffs, referencing contrasting academic views on whether artificial intelligence will complement existing jobs or lead to significant displacement. Both agree that the full impact of AI on productivity and employment will take time to materialize, drawing parallels to the slow adoption of the internet in the 1990s.
The podcast further explores the recent volatility in stock prices of AI-related firms, comparing the current environment to the dot-com bubble and questioning the sustainability of high valuations. Hubbard and O’Brien discuss the effects of tariffs, noting that price increases have been less dramatic than expected due to factors like inventory buffers and contractual delays. They highlight the tension between tariffs as tools for protection and revenue, and the broader implications for manufacturing, agriculture, and consumer prices. The episode concludes with reflections on the importance of ongoing observation and analysis as these economic trends evolve.
Pearson Economics · Hubbard OBrien Economics Podcast – 11-06-25 – Economy, AI, & Tariffs
What Will the U.S. Economy Be Like in 50 Years? Glenn Predicts!
Image generated by ChatGPT
A Stronger Safety Net
Modern industrial capitalism’s bounty has been breathtaking globally and especially in the U.S. It’s tempting, then, to look at critics in the crowd in Monty Python’s “Life of Brian” as they ask, “What have the Romans ever do for us?,” only to be confronted with a large list of contributions. But, in fact, over time, American capitalism has been saved by adapting to big economic changes.
We’re at another turning point, and the pattern of American capitalism’s keeping its innovative and disruptive core by responding, if sometimes slowly, to structural shocks will play out as follows.
The magnitude, scope and speed of technological change surrounding generative artificial intelligence will bring forth a new social insurance aimed at long-term, not just cyclical, impacts of disruption. For individuals, it will include support for work, community colleges and training, and wage insurance for older workers. For places, it will include block grants to communities and areas with high structural unemployment to stimulate new business and job opportunities. Such efforts are a needed departure from a focus on cyclical protection from short-term unemployment toward a longer-term bridge of reconnecting to a changing economy.
These ideas, like America’s historical big responses in land-grant colleges and the GI Bill, combine federal funding support with local approaches (allowing variation in responses to local business and employment opportunities), another hallmark of past U.S. economic policy.
With a stronger economic safety net, the current push toward higher tariffs and protectionism will gradually fade. Protectionism is a wall against change, but it is one that insulates us from progress, too.
A growing budget deficit and strains on public finances will lead to a reliance on consumption taxes to replace the current income tax system; continuing to raise taxes on saving and investment will arrest growth prospects. For instance, a tax on business cash flow, which places a levy on a firm’s revenue minus all expenses including investment, would replace taxes on business income. Domestic production would be enhanced by adding a border adjustment to business taxes—exports would be exempt from taxation, but companies can’t claim a deduction for the cost of imports.
That reform allows a shift from helter-skelter tariffs to tax reform that boosts investment and offers U.S. and foreign firms alike an incentive to invest in the U.S.
These ideas to retain opportunity amid creative destruction will also refresh American capitalism as the nation celebrates its 250th anniversary. They also celebrate the classical liberal ideas of Adam Smith, whose treatise “The Wealth of Nations” appeared the same year. This refresh marries competition’s role in “The Wealth of Nations” and American capitalism with the ability to compete, again a feature of turning points in capitalism in the U.S.
Decades down the road, this “Project 2026” will have preserved the bounty and mass prosperity of American capitalism.
These observations first appeared in the Wall Street Journal, along with predictions from six other economists and economic historians.
Is it 1987 for AI?
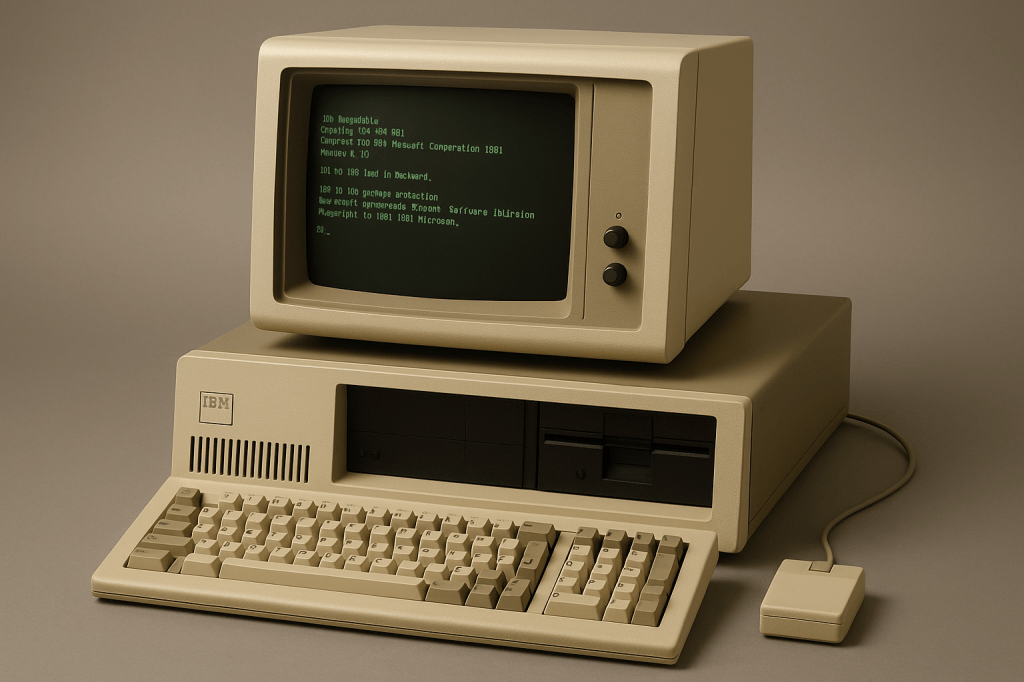
Image generated by ChatGPT 5 of a 1981 IBM personal computer.
The modern era of information technology began in the 1980s with the spread of personal computers. A key development was the introduction of the IBM personal computer in 1981. The Apple II, designed by Steve Jobs and Steve Wozniak and introduced in 1977, was the first widely used personal computer, but the IBM personal computer had several advantages over the Apple II. For decades, IBM had been the dominant firm in information technology worldwide. The IBM System/360, introduced in 1964, was by far the most successful mainframe computer in the world. Many large U.S. firms depended on IBM to meet their needs for processing payroll, general accounting services, managing inventories, and billing.
Because these firms were often reliant on IBM for installing, maintaining, and servicing their computers, they were reluctant to shift to performing key tasks with personal computers like the Apple II. This reluctance was reinforced by the fact that few managers were familiar with Apple or other early personal computer firms like Commodore or Tandy, which sold the TRS-80 through Radio Shack stores. In addition, many firms lacked the technical staffs to install, maintain, and repair personal computers. Initially, it was easier for firms to rely on IBM to perform these tasks, just as they had long been performing the same tasks for firms’ mainframe computers.
By 1983, the IBM PC had overtaken the Apple II as the best-selling personal computer in the United States. In addition, IBM had decided to rely on other firms to supply its computer chips (Intel) and operating system (Microsoft) rather than develop its own proprietary computer chips and operating system. This so-called open architecture made it possible for other firms, such as Dell and Gateway, to produce personal computers that were similar to IBM’s. The result was to give an incentive for firms to produce software that would run on both the IBM PC and the “clones” produced by other firms, rather than produce software for Apple personal computers. Key software such as the spreadsheet program Lotus 1-2-3 and word processing programs, such as WordPerfect, cemented the dominance of the IBM PC and the IBM clones over Apple, which was largely shut out of the market for business computers.
As personal computers began to be widely used in business, there was a general expectation among economists and policymakers that business productivity would increase. Productivity, measured as output per hour of work, had grown at a fairly rapid average annual rate of 2.8 percent between 1948 and 1972. As we discuss in Macroeconomics, Chapter 10 (Economics, Chapter 20 and Essentials of Economics, Chapter 14) rising productivity is the key to an economy achieving a rising standard of living. Unless output per hour worked increases over time, consumption per person will stagnate. An annual growth rate of 2.8 percent will lead to noticeable increases in the standard of living.
Economists and policymakers were concerned when productivity growth slowed beginning in 1973. From 1973 to 198o, productivity grew at an annual rate of only 1.3 percent—less than half the growth rate from 1948 to 1972. Despite the widespread adoption of personal computers by businesses, during the 1980s, the growth rate of productivity increased only to 1.5 percent. In 1987, Nobel laureate Robert Solow of MIT famously remarked: “You can see the computer age everywhere but in the productivity statistics.” Economists labeled Solow’s observation the “productivity paradox.” With hindsight, it’s now clear that it takes time for businesses to adapt to a new technology, such as personal computers. In addition, the development of the internet, increases in the computing power of personal computers, and the introduction of innovative software were necessary before a significant increase in productivity growth rates occurred in the mid-1990s.

Result when ChatGPT 5 is asked to create an image illustrating ChatGPT
The release of ChatGPT in November 2022 is likely to be seen in the future as at least as important an event in the evolution of information technology as the introduction of the IBM PC in August 1981. Just as with personal computers, many people have been predicting that generative AI programs will have a substantial effect on the labor market and on productivity.
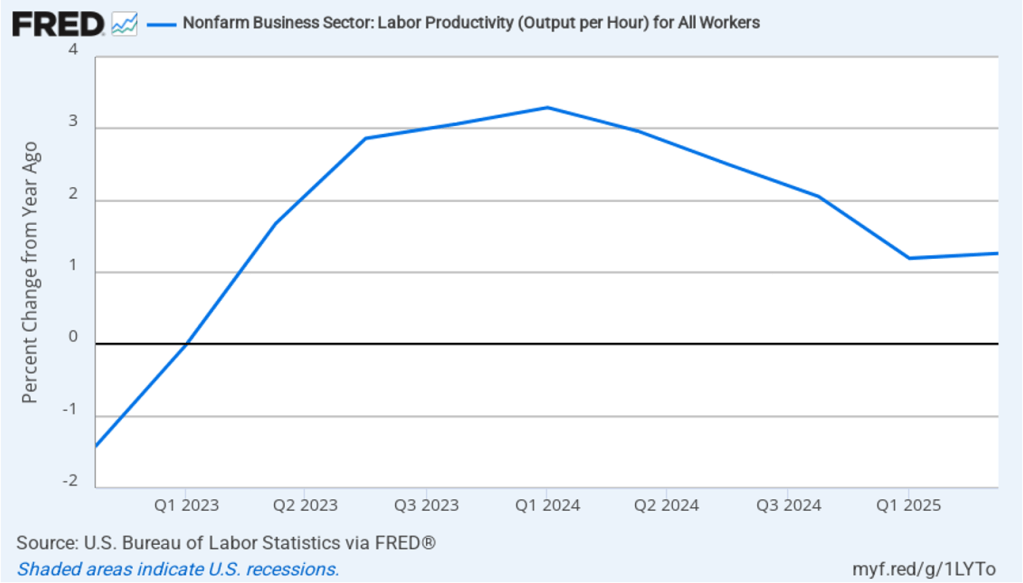
In this recent blog post, we discussed the conflicting evidence as to whether generative AI has been eliminating jobs in some occupations, such as software coding. Has AI had an effect on productivity growth? The following figure shows the rate of productivity growth in each quarter since the fourth quarter of 2022. The figure shows an acceleration in productivity growth beginning in the fourth quarter of 2023. From the fourth quarter of 2023 through the fourth quarter of 2024, productivity grew at an annual rate of 3.1 percent—higher than during the period from 1948 to 1972. Some commentators attributed this surge in productivity to the effects of AI.
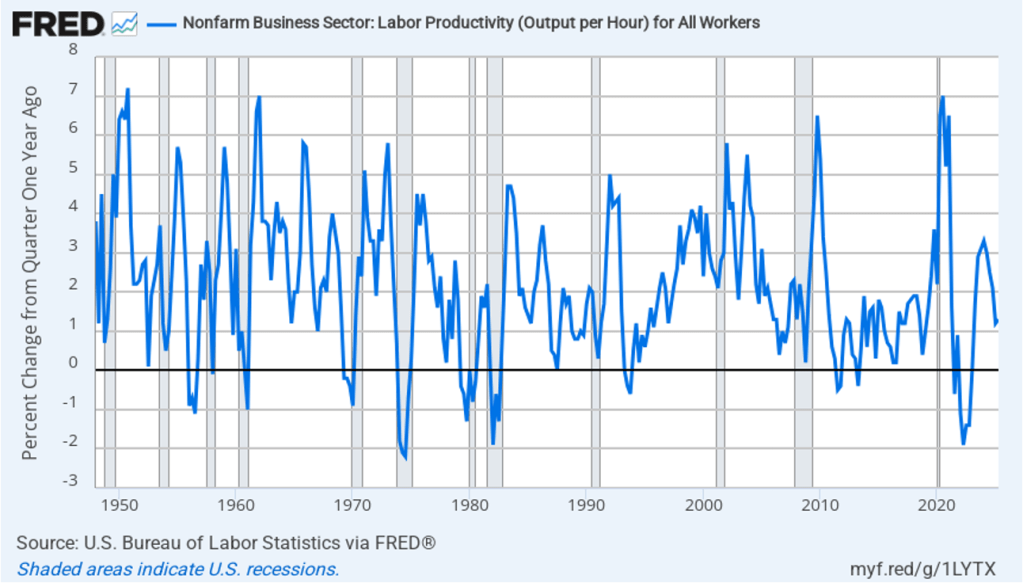
However, the increase in productivity growth wasn’t sustained, with the growth rate in the first half of 2025 being only 1.3 percent. That slowdown makes it more likely that the surge in productivity growth was attributable to the recovery from the 2020 Covid recession or was simply an example of the wide fluctuations that can occur in productivity growth. The following figure, showing the entire period since 1948, illustrates how volatile quarterly rates of productivity growth are.
How large an effect will AI ultimately have on the labor market? If many current jobs are replaced by AI is it likely that the unemployment rate will soar? That’s a prediction that has often been made in the media. For instance, Dario Amodei, the CEO of generative AI firm Anthropic, predicted during an interview on CNN that AI will wipe out half of all entry level jobs in the U.S. and cause the unemployment rate to rise to between 10% and 20%.
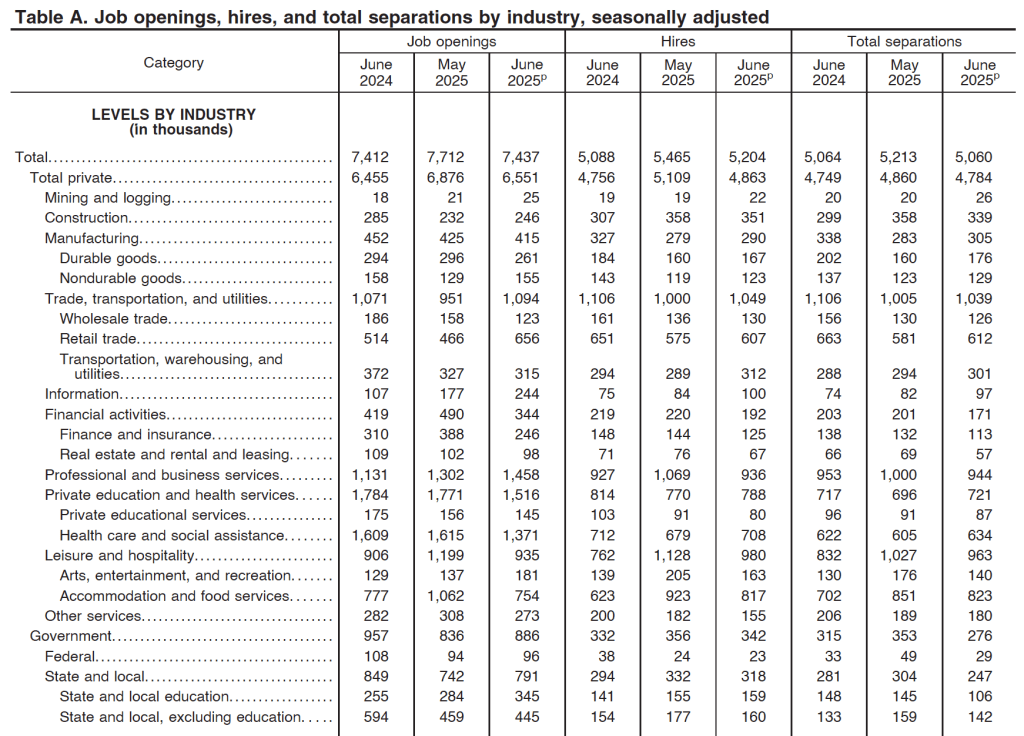
Although Amodei is likely correct that AI will wipe out many existing jobs, it’s unlikely that the result will be a large increase in the unemployment rate. As we discuss in Macroeconomics, Chapter 9 (Economics, Chapter 19 and Essentials of Economics, Chapter 13) the U.S. economy creates and destroys millions of jobs every year. Consider, for instance, the following table from the most recent “Job Openings and Labor Turnover” (JOLTS) report from the Bureau of Labor Statistics (BLS). In June 2025, 5.2 million people were hired and 5.1 million left (were “separated” from) their jobs as a result of quitting, being laid off, or being fired.
Most economists believe that one of the strengths of the U.S. economy is the flexibility of the U.S. labor market. With a few exceptions, “employment at will” holds in every state, which means that a business can lay off or fire a worker without having to provide a cause. Unionization rates are also lower in the United States than in many other countries. U.S. workers have less job security than in many other countries, but—crucially—U.S. firms are more willing to hire workers because they can more easily lay them off or fire them if they need to. (We discuss the greater flexibility of U.S. labor markets in Macroeconomics, Chapter 11 (Economics, Chapter 21).)
The flexibility of the U.S. labor market means that it has shrugged off many waves of technological change. AI will have a substantial effect on the economy and on the mix of jobs available. But will the effect be greater than that of electrification in the late nineteenth century or the effect of the automobile in the early twentieth century or the effect of the internet and personal computing in the 1980s and 1990s? The introduction of automobiles wiped out jobs in the horse-drawn vehicle industry, just as the internet has wiped out jobs in brick-and-mortar retailing. People unemployed by technology find other jobs; sometimes the jobs are better than the ones they had and sometimes the jobs are worse. But economic historians have shown that technological change has never caused a spike in the U.S. unemployment rate. It seems likely—but not certain!—that the same will be true of the effects of the AI revolution.
Which jobs will AI destroy and which new jobs will it create? Except in a rough sense, the truth is that it is very difficult to tell. Attempts to forecast technological change have a dismal history. To take one of many examples, in 1998, Paul Krugman, later to win the Nobel Prize, cast doubt on the importance of the internet: “By 2005 or so, it will become clear that the Internet’s impact on the economy has been no greater than the fax machine’s.” Krugman, Amodei and other prognosticators of the effects of technological change simply lack the knowledge to make an informed prediction because the required knowledge is spread across millions of people.
That knowledge only becomes available over time. The actions of consumers and firms interacting in markets mobilize information that is initially known only partially to any one person. In 1945, Friedrich Hayek made this argument in “The Use of Knowledge in Society,” which is one of the most influential economics articles ever written. One of Hayek’s examples is an unexpected decrease in the supply of tin. How will this development affect the economy? We find out only by observing how people adapt to a rising price of tin: “The marvel is that … without an order being issued, without more than perhaps a handful of people knowing the cause, tens of thousands of people whose identity could not be ascertained by months of investigation are made [by the increase in the price of tin] to use the material or its products more sparingly.” People adjust to changing conditions in ways that we lack sufficient information to reliably forecast. (We discuss Hayek’s view of how the market system mobilizes the knowledge of workers, consumers, and firms in Microeconomics, Chapter 2.)
It’s up to millions of engineers, workers, and managers across the economy, often through trial and error, to discover how AI can best reduce the cost of producing goods and services or improve their quality. Competition among firms drives them to make the best use of AI. In the end, AI may result in more people or fewer people being employed in any particular occupation. At this point, there is no way to know.
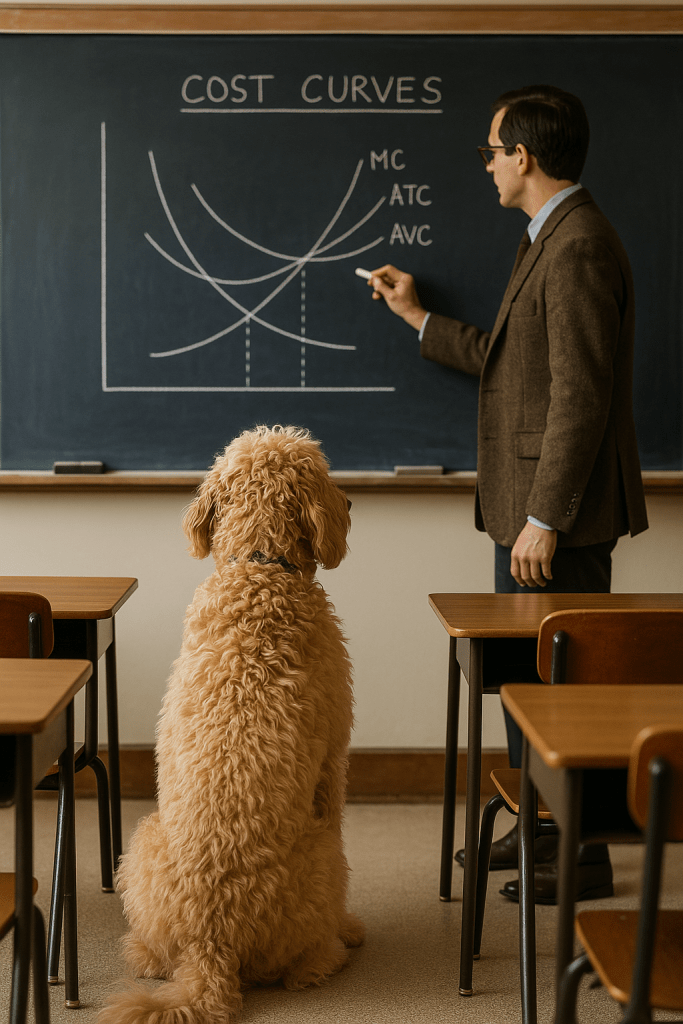
Solved Problem: Mickey v. Cost Curves
Supports: Microeconomics and Economics, Chapter 11, Section 11.5, and Essentials of Economics, Chapter 8, Section 8.5
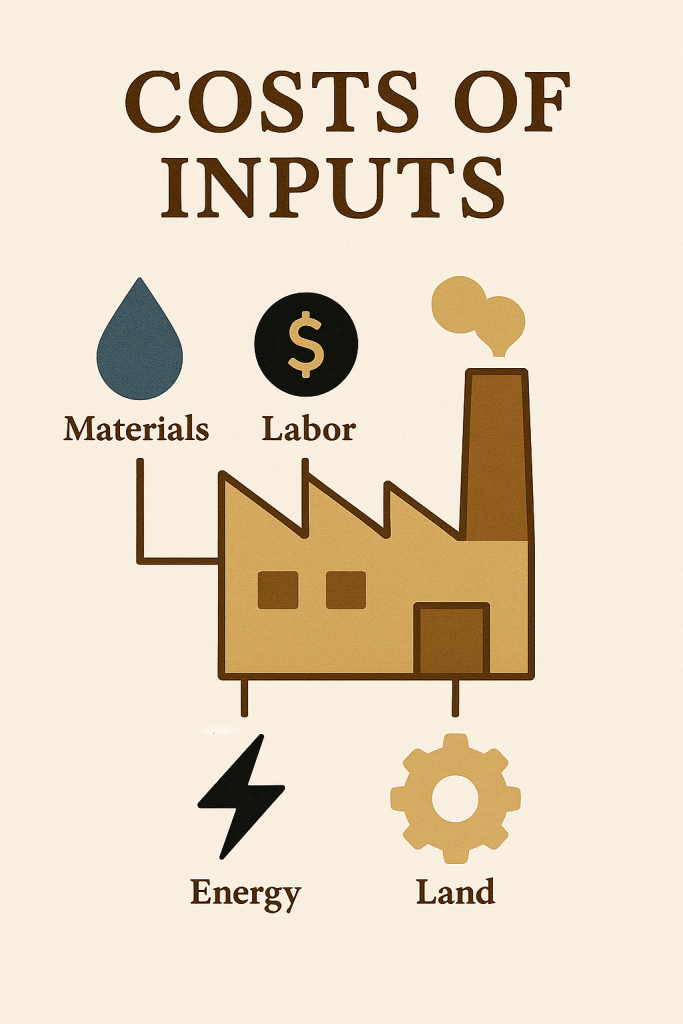
Image generated by ChatGTP-4o showing the costs of inputs to a factory.
Mickey, the Econ Pup, sometimes struggles with drawing and interpreting cost curves. Examine the cost curves shown in images a. and b. and let Mickey know if you find any errors.
a.

b.
Solving the Problem
Step 1: Review the chapter material. This problem is about drawing and interpreting cost curves, so you may want to review Chapter 11, Section 11.5, “Graphing Cost Curves.”
Step 2: Answer part a. by explaining whether there are any errors in the cost curves shown in the image in a. No wonder Mickey is confused! This figure has multiple errors:
- It’s an error to have the ATC and AVC curves cross. The unlabeled curve at the bottom is supposed to be AFC. We know that if a firm has fixed costs, then the ATC and AVC curves will get closer and closer as the quantity increases and AFC becomes smaller and smaller. But because AFC will never decline to zero, ATC and AVC can’t be equal at any quantity.
- The second error is related to the first error. We know that the MC and ATC curves should intersect at the quantity at which ATC is at a minimum. In this figure, the MC curve intersects the ATC curve at a quantity that is larger than the quantity at which ATC recaches a minimum.
- The third error is related to the first two errors. The relationship between the three average cost curves should be ATC = AVC + AFC at every quantity. In this figure the relationship doesn’t hold at any quantity.
- Finally, there is a dotted line from the point where the (unlabeled) AFC curve intersects with the MC curve down to the Q-axis. But that point has no economic significance.
Step 3: Answer part b. by explaining whether there are any errors in the cost curves shown in image b. Mickey can rest easy with these cost curve because, although the figure seems to be only partially finished, all of the cost curves are correctly drawn. The MC curve correctly intersects the AVC curve at the quantity at which the AVC curve is at a minimum. The instructor could finish the figure by labeling the bottom curve as AFC and by drawing an ATC curve above the AVC curve, with the ATC curve intersecting the MC curve at the quantity at which the ATC curve is at a minimum.
Glenn on the Importance of Research

An image generated by GTP-4o illustrating research.
This opinion column by Glenn appeared in the Financial Times on March 10.
The Trump administration has wisely emphasised raising America’s rate of economic growth. But growth doesn’t just happen. It is the byproduct of innovation both radical (think of the emergence of generative artificial intelligence) and gradual (such as improvements in manufacturing processes or transport). Many economic factors influence innovation, but research and development is key. While this can be privately or publicly funded, the latter can support basic research with spillovers to many companies and applications.
Therein lies the rub: the new administration’s growth agenda is joined by a significant effort to reduce government spending, spearheaded by the so-called Department of Government Efficiency. Some spending restraint can enhance growth by reducing interest rates or reallocating funds towards more investment-oriented activities. But cuts to R&D, as the administration is advocating at the National Institutes of Health (NIH), National Science Foundation (NSF), Department of Energy (DoE) and NASA, are counter-productive. They will limit innovation and growth.
The link between R&D and productivity growth has a long pedigree in economics and has generally been acknowledged by US policymakers. In the mid-1950s, economist Robert Solow made the Nobel Prize-winning conclusion that sustained output growth is not possible without technological progress. Decades later, former World Bank chief economist Paul Romer added another Nobel Prize-winning insight: growth reflected the intentional adoption of new ideas, so could be affected by research incentives.
It is well known that research is undervalued by private companies. Private funders of R&D don’t capture all its benefits. The social returns of R&D are two to four times higher than private returns. These high returns are enabled in the US by federal funding. For example, publicly funded research at the NIH has been found to significantly impact private development of new drugs.
In a comprehensive study, Andrew Fieldhouse and Karel Mertens classify major changes in non-defence R&D funding by the DoE, Nasa, NIH and NSF over the postwar period. They estimate implied returns of as much as 200 per cent — raising US economic output by $2 per dollar of funding. This is substantially higher than recent estimates of returns to private R&D. According to the Congressional Budget Office, the high returns to public funding are more than 10 times that on public investment in infrastructure. With the higher tax revenue generated from additional GDP, an increase in R&D funding more than pays for itself.
In aggregate, productivity gains from federal R&D funding are substantial. Indeed, Fieldhouse and Mertens estimate that government-funded R&D amounts to about one-fifth of productivity growth (measured as output growth less all input growth) in the US since the second world war.
Combined with the high social returns of government-funded R&D, it is essential that policymakers in the current administration acknowledge the risks of underfunding R&D. Spending cuts are clearly harmful to productivity and even budget outcomes.
A shift towards government-financed R&D does not imply that policy in these areas should be beyond review. Some economists have questioned whether current R&D projects take sufficiently high scientific risks, particularly on the ideas of younger scholars. And policymakers can certainly investigate whether indirect cost subsidies to universities and laboratories—in addition to the direct costs of research—are set at the appropriate levels. But, if growth is the objective, the presumption must be that additional public spending on R&D is worthwhile.
Federal support for growth-oriented R&D can extend beyond research grants. Publicly supported applied research centres around the country offer a mechanism to collaborate with local universities and business networks to disseminate ideas to practice. This builds upon the agricultural and manufacturing extension services instituted by 19th-century land-grant colleges that enhanced productivity.
The Trump administration is right to promote growth as a public objective. Spending restraint and fiscal discipline can be growth-enhancing. But all spending is equal. Government-funded R&D is vitally important for innovation and productivity growth. The case is clear.
DeepSeek, Nvidia, and the Effect of New Information on Stock Prices

At the close of stock trading on Friday, January 24 at 4 pm EST, Nvidia’s stock had a price of $142.62 per share. When trading reopened at 9:30 am on Monday, January 27, Nvidia’s stock price plunged to $127.51. The total value of all Nvidia’s stock (the firm’s market capitalization or market cap) dropped by $589 billion—the largest one day drop in market cap in history. The following figure from the Wall Street Journal shows movements in Nvidia’s stock price over the past six months.

What happened to cause should a dramatic decline in Nvidia’s stock price? As we discuss in Macroeconomics, Chapter 6 (Economics, Chapter 8, and Money, Banking, and the Financial System, Chapter 6), Nividia’s price of $142.62 at the close of trading on January 24—like the price of any publicly traded stock—reflected all the information available to investors about the company. For the company’s stock to have declined so sharply at the beginning of the next trading day, important new information must have become available—which is exactly what happened.
As we discussed in this blog post from last October, Nvidia has been very successful in producing state-of-the-art computer chips that power the most advanced generative artificial intelligence (AI) software. Even after Monday’s plunge in the value of its stock, Nvidia still had a market cap of nearly $3.5 trillion at the end of the day. It wasn’t news that DeepSeek, a Chinese AI company had produced AI software called R1 that was similar to ChatGTP and other AI software produced by U.S. companies. The news was that R1—the latest version of the software is called V3—appeared to be comparable in many ways to the AI software produced by U.S. firms, but had been produced by DeepSeek despite not using the state-of-the-art Nvidia chips used in those AI programs.
The Biden administration had barred export to China of the newest Navidia chips to keep Chinese firms from surging ahead of U.S. firms in developing AI. DeepSeek claimed to have developed its software using less advanced chips and have trained its software at a much lower cost than U.S. firms have been incurring to train their software. (“Training” refers to the process by which engineers teach software to be able to accurately solve problems and answer questions.) Because DeepSeek’s costs are lower, the company charges less than U.S. AI firms do to use its computer infrastructure to handle business tasks like responding to consumer inquiries.
If the claims regarding DeepSeek’s software are accurate, then AI firms may no longer require the latest Nvidia chips and may be forced to reduce the prices they can charge firms for licensing their software. The demand for electricity generation may also decline if it turns out that the demand for AI data centers, which use very large amounts of power, will be lower than expected.
But on Monday it wasn’t yet clear whether the claims being made about DeepSeek’s software were accurate. Some industry observers speculated that, despite the U.S. prohibition on exporting the latest Nvidia chips to China, DeepSeek had managed to obtain them but was reluctant to admit that it had. There were also questions about whether DeepSeek had actually spent as little as it claimed in training its software.
What happens to the price of Nvidia’s stock during the rest of the week will indicate how investors are evaluating the claims DeepSeek made about its AI software.
The Amazing Rise of Nvidia
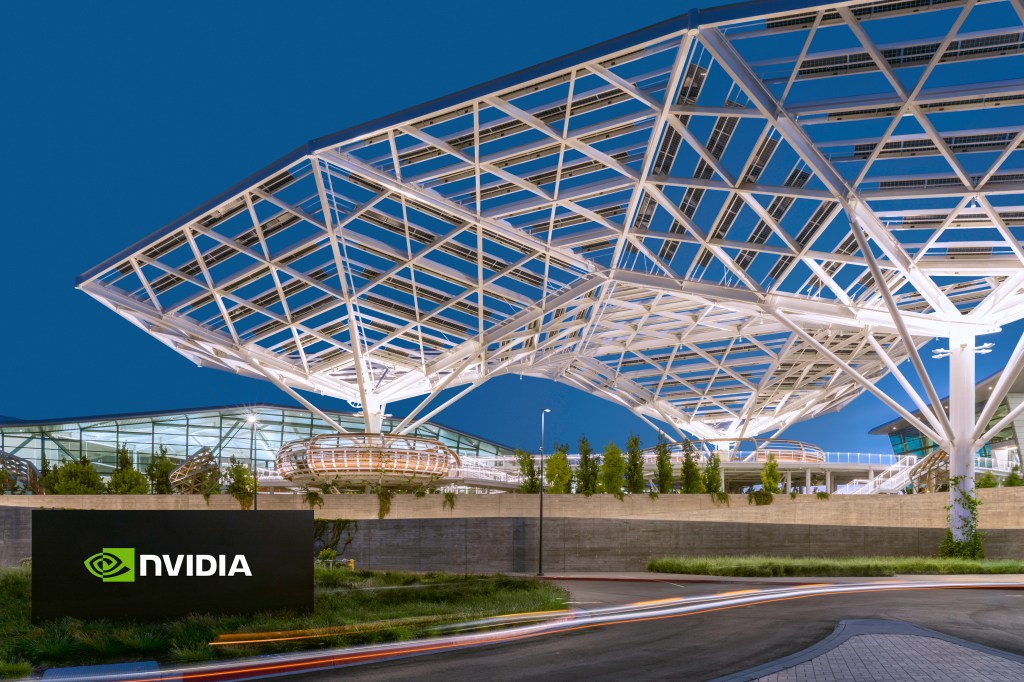
Nvidia’s headquarters in Santa Clara, California. (Photo from nvidia.com)
Nvidia was founded in 1993 by Jensen Huang, Chris Malachowsky, and Curtis Priem, electrical engineers who started the company with the goal of designing computer chips that would increase the realism of images in video games. The firm achieved a key breakthrough in 1999 when it invented the graphics processing unit, or GPU, which it marketed under the name GeForce256. In 2001, Microsoft used a Nvidia chip in its new Xbox video game console, helping Nvidia to become the dominant firm in the market for GPUs.
The technology behind GPUs has turned out to be usable not just for gaming, but also for powering AI—artificial intelligence—software. The market for Nvidia’s chips exploded witth technology giants Google, Microsoft, Facebook and Amazon, as well as many startups ordering large quantites of Nvidia’s chips.
By 2016, Nvidia CEO Jen-Hsun Huang could state in an interview that: “At no time in the history of our company have we been at the center of such large markets. This can be attributed to the fact that we do one thing incredibly well—it’s called GPU computing.” Earlier this year, an article in the Economist noted that: “Access to GPUs, and in particular those made by Nvidia, the leading supplier, is vital for any company that wants to be taken seriously in artificial intelligence (AI).”
Nvidia’s success has been reflected in its stock price. When Nvidia became a public company in 1999 by undertaking an initial public offering (IPO) of stock, a share of the firm’s stock had a price of $0.04, adjusted for later stock splits. The large profits Nvidia has been earning in recent years have caused its stock price to rise to more than $140 dollars a share.
(With a stock split, a firm reduces the price per share of its stock by giving shareholders additional shares while holding the total value of the shares constant. For example, in June of this year Nvidia carried out a 10 for 1 stock split, which gave shareholders nine shares of stock for each share they owned. The total value of the shares was the same, but each share now had a price that was 10 percent of its price before the split. We discuss the stock market in Microeconomics, Chapter 8, Section 8.2, Macroeconomics, Chapter 6, Section 6.2, and Economics, Chapter 8, Section 8.2.)
The following figure from the Wall Street Journal shows the sharp increase in Nvidia’s stock price over the past three years as AI has become an increasingly important part of the economy.
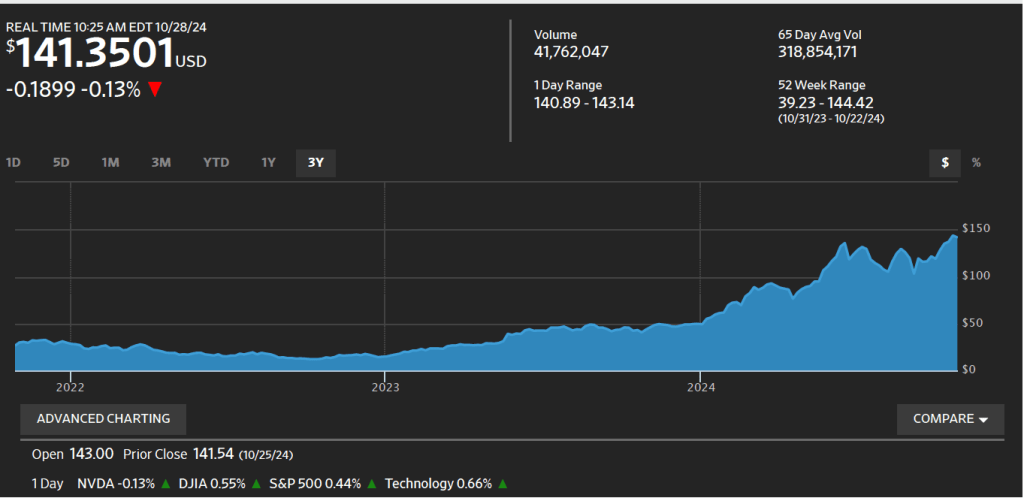
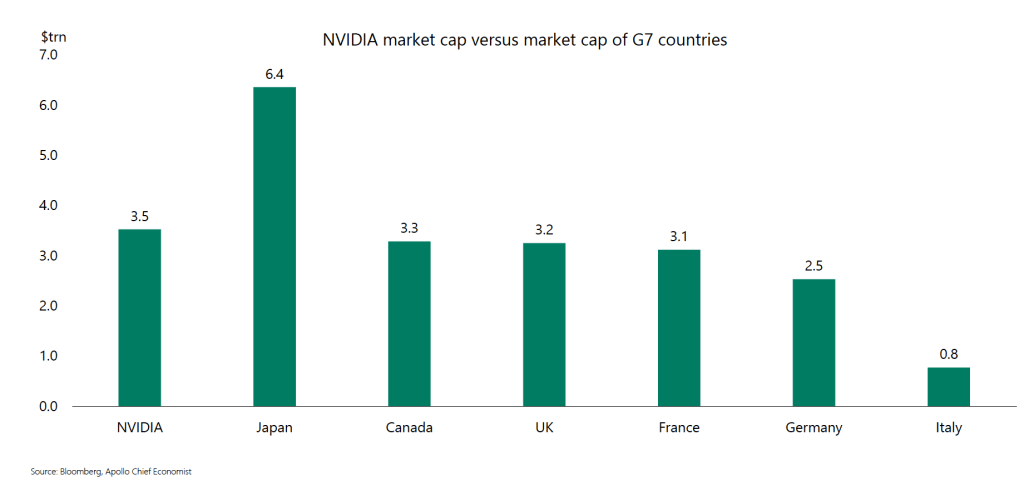
Nvidia’s market capitalization (or market cap)—the total value of all of its outstanding shares of stock—is $3.5 trillion. How large is that? Torsten Sløk, the chief economist at Apollo, an asset management firm, has noted that, as shown in the following figure, Nvidia’s market cap is larger than the total market caps—the total value of all the publicly traded firms—in five large economies.
Can Nvidia’s great success continue? Will it be able to indefinitely dominate the market for AI chips? As we noted in Apply the Concept “Do Large Firms Live Forever?” in Microeconomics Chapter 14, in the long run, even the most successful firms eventually have their positions undermined by competition. That Nvidia has a larger stock market value than the total value of all the public companies in Germany or the United Kingdom is extraordinary and seems impossible to sustain. It may indicate that investors have bid up the price of Nvidia’s stock above the value that can be justified by a reasonable forecast of its future profits.
There are already some significant threats to Nvidia’s dominant position in the market for AI chips. GPUs were originally designed to improve computer displays of graphics rather than to power AI software. So, one way of competing with Nvidia that some startups are trying to exploit is to design chips specifically for use in AI. It’s also possible that larger chips may make it possible to use fewer chips than when using GPUs, possibly reducing the total cost of the chips necessary to run sophisticated AI software. In addition, existing large technology firms, such as Amazon and Microsoft, have been developing chips that may be able to compete with Nvidia.
As with any firm, Nvidia’s continued success requires it to innovate sufficiently to stay ahead of the many competitors that would like to cut into the firm’s colossal profits.
The Economics of Apple’s Vision Pro

Photo from apple.com.
On Friday, February 2, Apple released Vision Pro, its long-awaited, much discussed virtual reality (VR) headset. The Vision Pro headset allows users to experience either VR, in which the user sees only virtual objects, as for instance when the user sees only images from a video game; or augmented reality (AR), in which the user sees virtual objects, such as icon apps or web pages superimposed on the real world (as in the two photos below). Apple refers to people using the headsets as being engaged in “spatial computing” and sometimes refers to the headsets as “face computers.”

Photo from Apple via the Wall Street Journal.

Photo from Apple via the Wall Street Journal.
Vision Pro has a price of $3,499, which can increase to more than $4,000 when including the cost of the insert necessary for anyone who wears prescription eyeglasses or contact lenses and who chooses to buy additional storage capacity. The price is much higher than Meta’s Quest Pro VR headset (shown in the photo below), which has a price of $999.

Photo from meta.com.
In this post, we can briefly discuss some of the economic issues raised by the Vision Pro. First, why would Apple charge such a high price? In her review of the Vision Pro in the Wall Street Journal, Joanna Stern, the site’s personal technology writer, speculated that: “You’re probably not going to buy the $3,500 Apple Vision Pro. Unless you’re an app developer or an Apple die-hard ….”
There are several reasons why Apple may believe that a price of $3,499 is profit maximizing. But we should bear in mind that pricing any new product is difficult because firms lack good data on the demand curve and are unsure how consumers will respond to changes in price. In our new ninth edition of Economics and Microeconomics, in Chapter 6 on price elasticity we discuss how Elon Musk and managers at Tesla experimented with the cutting the price of the Model 3 car as they attempted to discover the effect on price changes on the quantity demanded. Managers at Apple are in similar situation of lacking good data on how many headsets they are likely to sell at $3,499.
If Apple lacks good data on how consumers are likely to respond to different prices, why pick a price four times as high as Meta is charging for its Quest Pro VR headsets?
First, Apple expects to be able to clearly differentiate its headset from Meta’s headset. If consumers considered the two headsets to be close substitutes, the large price difference would make it unlikely that Apple would sell many headsets. Apple has several marketing advantages over Meta that make it likely that Apple can convince many consumers that the Meta headset is not a close substitute for the Vision Pro:
- Apple has a history of selling popular electronic products, such as the iPhone, iPad, Air Pods, and the Apple Watch. It also owns the most popular app store. Apple has succeeded in seamlessly integrating these electronic products with each other and with use of the app store. As a result, a significant number of consumers have a strong preference for Apple products over competitors. Meta has a much more limited history of selling popular electronic products. For instance, it doesn’t produce its own smartphone.
- Apple has an extensive network of retail stores inside and outside of the United States. The stores have been successful in giving consumers a chance to try a new electronic product before buying it and to receive help at the stores’ Genius Bars with setting up the device or dealing with any later problems. Meta operates few retail stores, relying instead on selling through other retailers, such as Best Buy, or through its online site. For some consumers Meta’s approach is less desirable than Apple’s.
Second, as we discuss in Economics and Microeconomics, Chapter 15, Section 15.5, charging a high price for a new electronic product is common, partly because doing so allows firms to price discriminate across time. With this strategy, firms charge a higher price for a product when it is first introduced and a lower price later. Some consumers are early adopters who will pay a high price to be among the first to own certain new products. Early adopers are a particularly large segment of buyers of Apple products, with long lines often forming at Apple stores on the days when a new product is released. That firms price discriminate over time helps explain why products such as Blu-ray players and 4K televisions sold for very high prices when they were first introduced. After the demand of the early adopters was satisfied, the companies reduced prices to attract more price-sensitive customers. For example, the price of Blu-ray players dropped by 95 percent within five years of their introduction. Similarly, we can expect that Apple will cut the price of Vision Pro significantly over time.
Third, because Apple is initially producing a relatively small number of units, it is likely experiencing a high average cost of producing the Vision Pro. The production of the components of the headset and the final assembly are likely to be subject to large economies of scale. (We discuss economies of scale in Economics and Microeconomics, Chapter 11, Section 11.6.) Apple hasn’t released information on how many units of the headset it intends to produce during 2024, but estimates are that it will be fewer than 400,000 and perhaps as few as 180,000. (Estimates can be found here, here, and here.) Compare that number to the 235 million iPhones Apple sold during 2023. We would expect as Apple’s suppliers increase their production runs, the average cost of production will decline as Apple moves down its long-run average cost curve. As a result, over time Apple is likely to cut the price.
In addition, when producing a new good, firms often experience learning as managers better understand the most efficient way to produce and assemble the new good. For example, the best method of assembling iPhones may not be the best method of assembling headsets, but this fact may only become clear after assembling several thousand headsets. Apple is likely to experience a learning curve with the average cost of producing headsets declining as the total number of headsets produced increases. While economies of scale involve a movement down a static long-run average cost curve, learning results in the long-run average cost curve shifting down. This second reason why Apple’s average cost of producing headsets will decline contributes to the liklihood that Apple will cut the price of the Vision Pro over time.
Finally, we can discuss a key factor that will determine how successful Apple is in selling headsets. In Chapter 11 of the new ninth edition of Economics and Microeconomics, we have a new Apply the Concept, “Mark Zuckerberg … Alone in the Metaverse?” In that feature, we note that Meta CEO Mark Zuckerberg has invested heavily in the metaverse, a word that typically means software programs that allow people to access either AR or VR images and information. Zuckerberg believed so strongly in the importance of the metaverse that he changed the name of the company from Facebook to Meta. The metaverse, which is accessed using headsets likes Meta’s Quest Pro or Apple’s Vision Pro, is subject to large network externalities—the usefulness of the headsets increases with the number of consumers who use them. The network externalities arise because many software applications, such as Meta’s Horizon World, depend on interactions among users and so are not very useful when there aren’t many users.
Meta hasn’t sold as many headsets as they expected because they have had difficulty attracting enough users to make their existing software useful and the failure to have enough users has reduced the incentive for other firms to develop apps for Meta’s headsets. Initially, some reviewers made similar comments about Apple’s Vision Pro. For instance, even though streaming films in 3D is one of the uses that Apple promotes, some streaming services, including Netflix and YouTube, have not yet released apps for Vision Pro. Some important business related apps, such as FaceTime and Zoom, aren’t yet available. There are also currently no workout apps. As one reviewer put it “there are few great apps” for Vision Pro. Another reviewer wondered whether the lack of compelling software and apps might result in the Vision Pro headset suffering the fate of “every headset I test [which] ends up in my closet collecting dust.”
So, a key to the success of the Vision Pro will be the ability of Apple to attract enough users to exploit the network externalities that exist with VR/AR headsets. If successful, the Vision Pro may represent an important development in the transition to spatial computing.
The Effect on a Firm’s Costs of Using a Generative AI Program
Supports: Microeconomics, Chapter 11, Section 11.5; Economics, Chapter 11, Section 11.5; and Essentials of Economics, Chapter 8, Section 8.5

Photo from the Wall Street Journal.
Imani owns a firm that sells payroll services to companies in the Atlanta area. Her largest cost is for labor. She employs workers who use software to prepare payroll reports and to handle texts and calls from client firms. She decides to begin using a generative AI program, like ChatGPT, which is capable of quickly composing thorough answers to many questions and write computer code. She will use the program to write the additional computer code needed to adapt the payroll software to individual client’s needs and to respond to clients seeking advice on payroll questions. Once the AI program is in place, she will need only half as many workers. The number of additional workers she needs to hire for every 20 additional firms that buy her service will fall from 5 to 1. She will have to pay a flat monthly licensing fee for the AI program; the fee will not change with the number of firms she sells her services to. Imani determines that making these changes will reduce her total cost of providing services to her current 2,000 clients from $2,000,000 per month to $1,600,000 per month
In answering the following questions, assume that, apart from the number of workers, none of the other inputs—such as the size of her firm’s office, the number of computers, or other software—change as a result of her leasing the AI program.
a. Briefly explain whether each of the following statements about the cost situation at Imani’s firm after she begins using the AI program is correct or incorrect.
- Her firm’s average total cost, average variable cost, and average fixed cost curves will shift down, while her firm’s marginal cost curve will shift up.
- Her firm’s average total cost, average variable cost, average fixed cost and marginal cost curves will all shift up.
- Her firm’s average total cost, average variable cost, and marginal cost curves will shift down, while her average fixed cost curve will shift up.
- Her firm’s average total cost, average variable cost, average fixed cost, and marginal cost curves will all shift down.
- Her firm’s average fixed cost curve will shift up, but her other cost curves will be unchanged.
b. Draw a graph illustrating your answer to part a. Be sure to show the original average total cost, average variable cost, average fixed cost, and marginal cost curves. Also show the shifts—if any—in the curves after Imani begins using the AI program.
Solving the Problem
Step 1: Review the chapter material. This problem requires you to understand definitions of costs, so you may want to review the sections “The Difference between Fixed Costs and Variable Costs,” “Marginal Costs,” and “Graphing Cost Curves”
Step 2: Answer part (a) by explaining whether each of the five listed statements is correct or incorrect. The cost of the AI program is fixed because it doesn’t change with the quantity of her services that Imani sells. Her firm will have greater fixed costs after licensing the AI program but she will have lower variable costs because she is able to produce the same level of output with fewer workers. Her marginal cost will also decline because she needs to hire fewer workers as the quantity of services she sells increases. We know that the average total cost per month of providing her service to 2,000 clients has decreased because we are given the information that it changed from ($2,000,000/2,000) = $1,000 to ($1,600,000/2,000) = $800.
- This statement is incorrect because her average fixed cost curve will shift up as a result of her total fixed cost having increased by the amount of the AI program license and because her marginal cost curve will shift down, not up.
- This statement is incorrect because all of her cost curves, except for average fixed cost, will shift down, not up.
- This statement is correct because it describes the actual shifts in her cost curves.
- This statement is incorrect because her average fixed cost curve will shift up, not down.
- This statement is incorrect because her rather than being unaffected, her average total cost, average variable cost, and marginal cost curves will shift down.
Step 3: Answer part (b) by drawing the cost curves for Imani’s firm before and after she begins using the AI program. Your graph should look like the following, where the curves representing the firm’s costs before Imani begins leasing the AI program are in blue and the costs after leasing the program are in red.

