Latest Wage Data Another Indication of the Persistence of Inflation

Photo courtesy of Lena Buonanno.

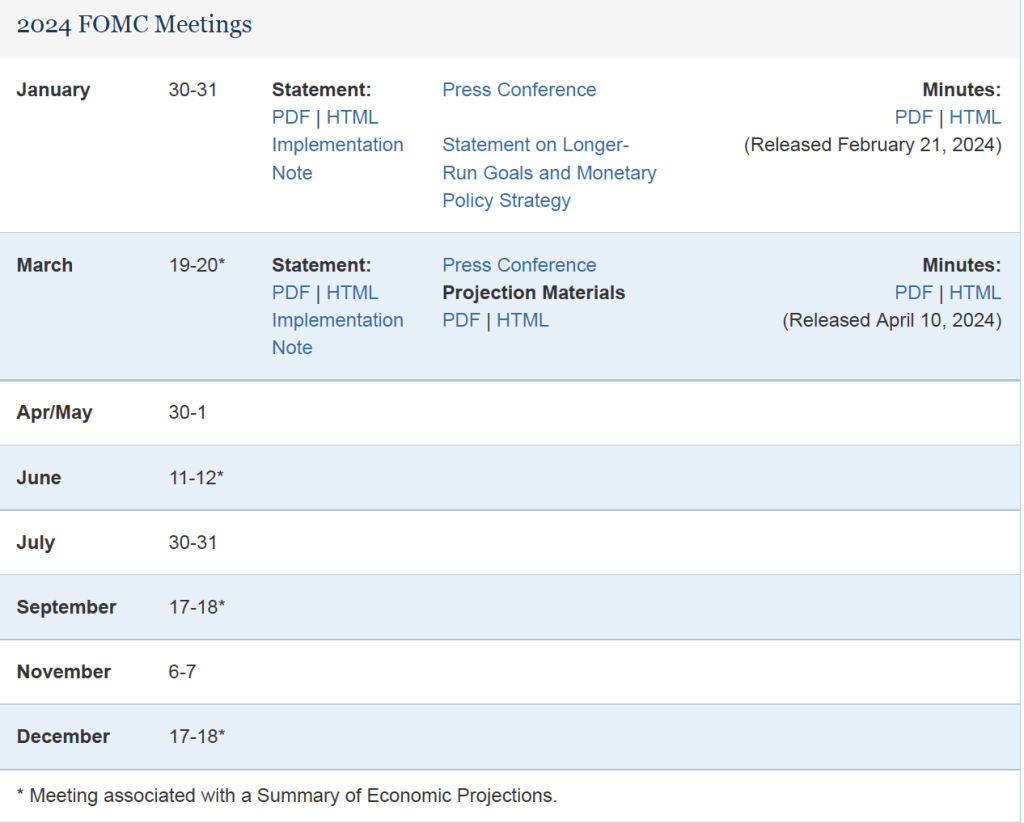
The latest significant piece of macroeconomic data that will be available to the Federal Reserve’s policy-making Federal Open Market Committee (FOMC) before it concludes its meeting tomorrow is the report on the Employment Cost Index (ECI), released this morning by the Bureau of Labor Statistics (BLS). As we’ve noted in earlier posts, as a measure of the rate of increase in labor costs, the FOMC prefers the ECI to average hourly earnings (AHE) .

The AHE is calculated by adding all of the wages and salaries workers are paid—including overtime and bonus pay—and dividing by the total number of hours worked. As a measure of how wages are increasing or decreasing during a particular period, AHE can suffer from composition effects because AHE data aren’t adjusted for changes in the mix of occupations workers are employed in. For example, during a period in which there is a decline in the number of people working in occupations with higher-than-average wages, perhaps because of a downturn in some technology industries, AHE may show wages falling even though the wages of workers who are still employed have risen. In contrast, the ECI holds constant the mix of occupations in which people are employed. The ECI does have the drawback, that it is only available quarterly whereas the AHE is available monthly.

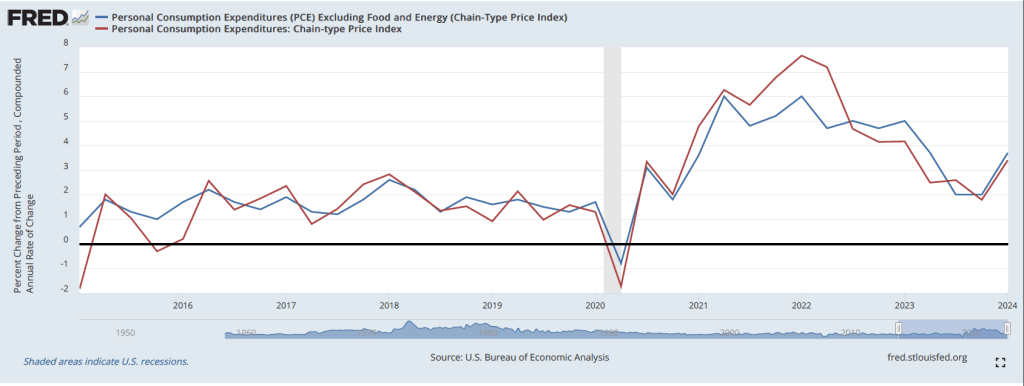
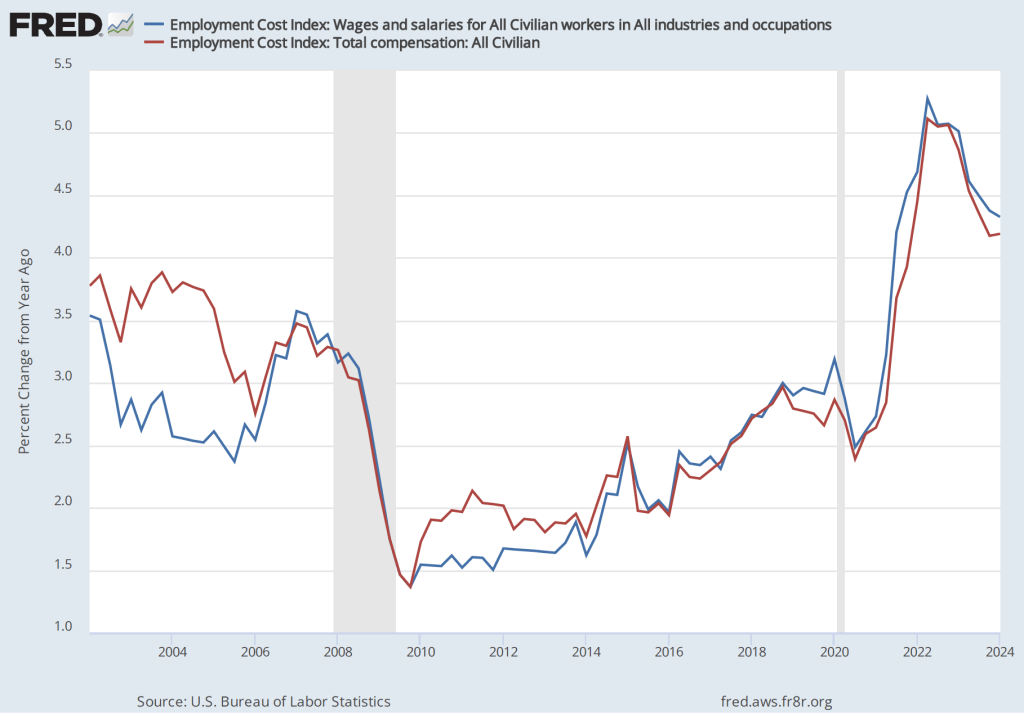
The data released this morning indicate that labor costs continue to increase at a rate that is higher than the rate that is likely needed for the Fed to hit its 2 percent price inflation target. The following figure shows the percentage change in the employment cost index for all civilian workers from the same quarter in 2023. The blue line looks only at wages and salaries while the red line is for total compensation, including non-wage benefits like employer contributions to health insurance. The rate of increase in the wage and salary measure decreased slightly from 4.4 percent in the fourth quarter of 2023 to 4.3 percent in the first quarter of 2024. The rate of increase in compensation was unchanged at 4.2 percent in both quarters.

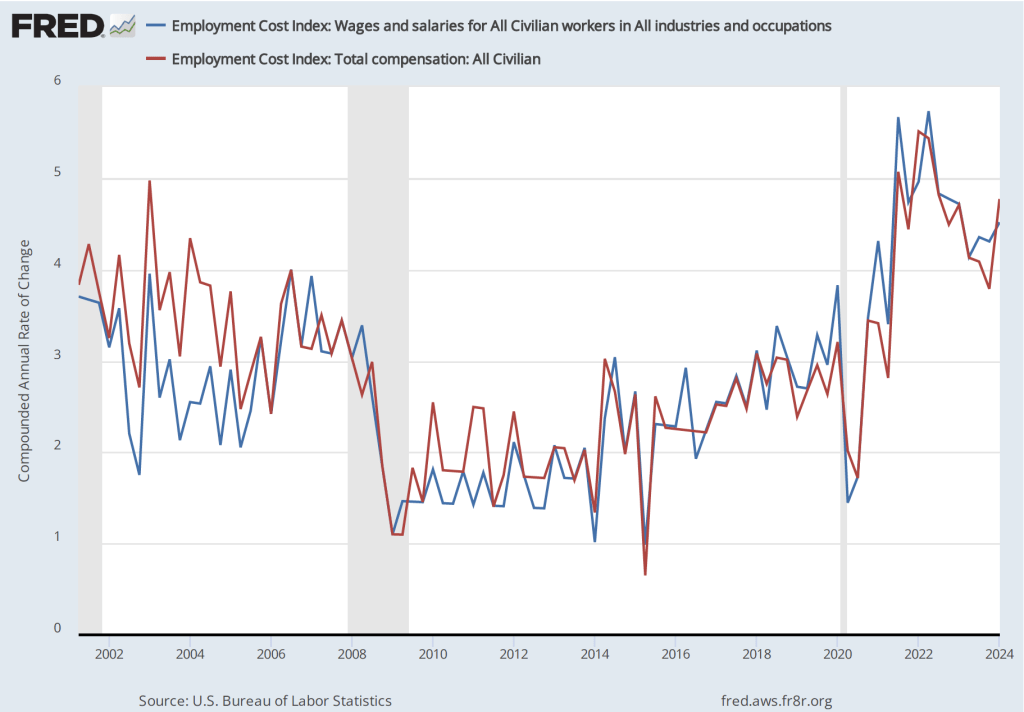
If we look at the compound annual growth rate of the ECI—the annual rate of increase assuming that the rate of growth in the quarter continued for an entire year—we find that the rate of increase in wages and salaries increased from 4.3 percent in the fourth quarter of 2023 to 4.5 percent in the first quarter of 2024. Similarly, the rate of increase in compensation increased from 3.8 percent in the third quarter of 2023 to 4.5 percent in the first quarter of 2024.

Some economists and policymakers prefer to look at the rate of increase in ECI for private industry workers rather than for all civilian workers because the wages of government workers are less likely to respond to inflationary pressure in the labor market. The first of the following figures shows the rate of increase of wages and salaries and in total compensation for private industry workers measured as the percentage increase from the same quarter in the previous year. The second figure shows the rate of increase calculated as a compound growth rate.

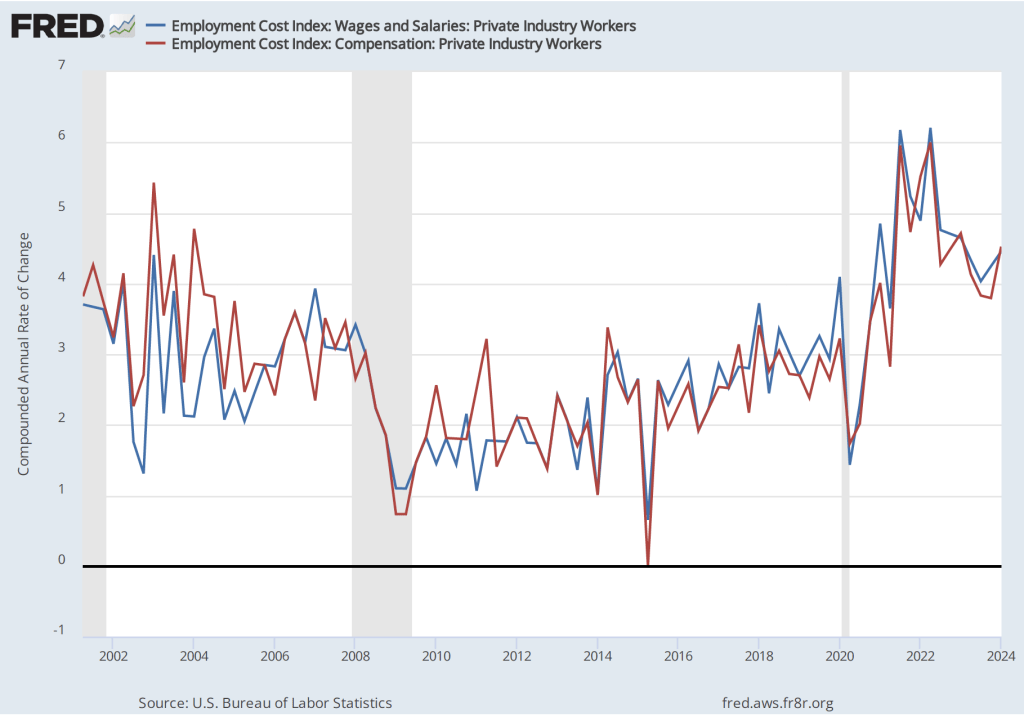
The first figure shows a slight decrease in the rate of growth of labor costs from the fourth quarter of 2023 to the first quarter of 2024, while the second figure shows a fairly sharp increase in the rate of growth.

Taken together, these four figures indicate that there is little sign that the rate of increase in employment costs is falling to a level consistent with a 2 percent inflation rate. At his press conference tomorrow afternoon, following the conclusion of the FOMC’s meeting, Fed Chair Jerome Powell will give his thoughts on the implications for future monetary policy 0f recent macroeconomic data.

Solved Problem: Is a Weak Yen Good or Bad for the Japanese Economy?

Supports: Macroeconomics, Chapter 18, Economics, Chapter 28, and Essentials of Economics, Chapter 19.

In a recent post, economics blogger Noah Smith discussed the effects on the Japanese economy of a “weaker yen”: “A weaker yen is making Japanese people feel suddenly poorer ….” But “let’s remember that a ‘weaker’ exchange rate isn’t always a bad thing.”  

  1. When the yen becomes weaker, does one yen exchange for more or fewer U.S. dollars?
  2. Why might a weaker yen make Japanese people feel poorer?
  3. Are there any ways that a weaker yen might help the Japanese economy? Briefly explain.
  4. Considering your answers to parts b. and c., can you determine whether a weak yen is good or bad for the Japanese economy? Briefly explain.

Solving the Problem

Step 1:  Review the chapter material. This problem is about the effect of changes in a country’s exchange rate on the country’s economy, so you may want to review Macroeconomics, Chapter 18, Section 18.2, “The Foreign Exchange Market and Exchange Rates,” (Economics, Chapter 28, Section 18.2, and Essentials of Economics, Chapter 19, Section 19.6.

Step 2: Answer part a. by explaining what a “weaker” yen means. A weaker yen will exchange for fewer U.S. dollars (or other currencies), or, equivalently, more yen will be required in exchange for a U.S. dollar. (This situation is illustrated in the figure at the top of this post, which shows the substantial weakening of yen against the dollar in the period since the end of the 2020 recession.)

Step 3: Answer part b. by explaining why a weaker yen might make people in Japan feel poorer. A weaker yen raises the yen price of imported goods. For example at an exchange rate of ¥100 = $1, a $1 Hershey candy bar imported from the United States will sell in Japan for ¥100. But if the yen becomes weaker and the exchange rate moves to ¥120 = $1, then the imported candy bar will have increased in price to ¥120. (Note that this discussion is simplified because a change in the exchange rate won’t necessarily be fully passed through to the prices of imported goods, particularly in the short run. But we would still expect that a weaker yen will result in higher yen prices of imports.)  A weaker yen will require people in Japan to pay more for imports, leaving them with less to spend on other goods. Because they will be able to consume less, people in Japan will feel poorer. (As we note in Section 18.3, many goods traded internally are priced in U.S. dollars—oil being an important example. Because Japan imports nearly all of its oil and more than half of its food, a decline in the value of the yen in exchange for the dollar will increase the yen price of key consumer goods.)

Step 4: Answer part c. by explaining how a weaker yen might help the Japanese economy. A weaker yen increases the yen price of Japanese imports but it also decreases the foreign currency price of Japanese exports. This effect would be the main way in which a weaker yen might help the Japanese economy but we can also note that Japanese businesses that compete with foreign imports will also be helped by the increase in import prices.

Step 5: Answer part d. by explaining that a weaker yen isn’t all bad or all good for the Japanese economy. As the answers to parts b. and c. indicate, a weaker yen creates both winners and losers in the Japanese economy. Japanese consumers lose as a result of a weaker yen but Japanese firms that export or that compete against foreign imports will be helped.  

Kooba Cola: The Worst Business Strategy Ever?

One of the key lessons of economics is that competition serves to push firms toward serving the interests of consumers. When existing firms in an industry are making an economic profit, new firms will enter the industry, which increases the quantity of the good produced and lowers the good’s price. Entry is the essential mechanism that drives a competitive market economy towards achieving allocative efficiency—with the mix of goods and services produced matching consumer preferences—and productive efficiency—with goods and services being produced at the lowest possible cost. (We discuss allocative efficiency and productive efficiency in Chapter 1, Section 1.2.)

For entry to occur requires the efforts of entrepreneurs, who constantly search for opportunities to make a profit. (We discuss the role of entrepreneurs in a market economy in Chapter 2, Section 2.3.)  Although, not well remembered today, Victor S. Fox was one of the more flamboyant entrepreneurs in U.S. business history. Fox was born in England in 1893 and moved with his family to Massachusetts three years later. As a young man, he started a firm to manufacture women’s clothing. In 1917, with the entry of the United States into World War I, Fox’s firm switched to producing military uniforms. In 1920, after the end of the war, Fox founded Consolidated Maritime Lines to buy from the U.S. government confiscated German and Austrian cargo ships. Fox also purchased a coal mine in Virginia to provide fuel for the ships. This effort ended in bankruptcy.

In 1929, Fox founded Allied Capital Corporation to invest in the stock market. This firm also failed amid accusations that Fox had broken securities laws. (Most of the information on Fox’s early career is from this site, which relies primarily on mentions of Fox in newspapers.) In 1936, Fox founded Fox Feature Syndicate to produce magazines. At that point, very few comic books were being published. That changed in April 1938, when National Allied Publications released Action Comics, featuring Superman—generally considered the first superhero to appear in comic books.  Sales of Superman comic books soared and Fox responded by entering the comic book industry, publishing a comic book starring Wonder Man. Wonder Man was an obvious copy of Superman, which led Superman’s publisher to file a lawsuit against Fox for copyright infringement. Fox agreed to stop publishing Wonder Man, but continued to publish comic books starring superheroes who weren’t such obvious copies of Superman.

As this summary of Fox’s career indicates, he was an entrepreneur who was willing to enter a new industry whenever he saw a profit opportunity, even if he lacked previous experience in the industry. In 1941, the continuing success of Coca-Cola and Pepsi-Cola led Fox to attempt to enter the cola industry in what was his most audacious entrepreneurial effort.  The high sales of his comic books gave Fox a platform to advertise his new soft drink —Kooba cola.  The following are some of Fox’s advertisements for Kooba cola.

Fox also advertised Kooba on a radio program featurning the Blue Beetle, one of his comic book superheroes. In the print advertisements for Kooba, Fox seems to have focused on two points in an attempt to differentiate his cola from existing colas, particularly Coke and Pepsi. (We discuss the role product differentiation plays in competition among firms in Microeconomics and Economics, Chapter 13.) First, to help overcome the belief among some consumers that colas were an unhealthy drink, Fox emphasized that Kooba cola would contain vitamin B1. In 1941, vitamin B1 had only recently become available and was the subject of newspaper stories. Second, at 12 ounces, bottles of Kooba were nearly twice as large as the standard 6.5 ounce Coke bottle but would sell for the same 5 cent price. One of the advertisements above notes that a six-pack of Kooba had a price of only 25 cents.

How was Fox able to sell his new cola for about half the price per ounce of Coke or Pepsi? That’s unclear because—amazingly—at the time Fox was running these advertisements, not only was Kooba not “available everywhere,” as the advertisements claimed, it wasn’t available anywhere. Fox was heavily advertising a product that didn’t actually exist.

How did Fox hope to earn a profit selling a nonexistent product? Fox’s strategy was apparently to begin by heavily advertising Kooba in the hopes of sparking a demand for it. He seems to have believed that if enough people were inspired by his advertisements to ask for the cola at grocery stores and newsstands, he could approach an existing soft drink company and offer to license the Kooba name. He seems never to have intended to actually manufacture the cola, relying instead on royalties paid by the soft drink company he hoped to license the name to.

Perhaps unsurprisingly, Fox’s strategy failed. To capitalize on Fox’s advertising, a firm licensing the Kooba name would have had to find a way to make a profit despite selling the cola at a price about half the price charged by competitors. Because Fox had no experience in manufacturing colas, he presumably had no advice to give on how production costs could be reduced sufficiently to allow Kooba to be sold at a profit.

Fox engaged in other entrepreneurial efforts before passing away in 1957. Over the years, Fox pursued a number of business strategies, some of which were successful, at least for a time. But his attempt to make a profit by promoting a nonexistent cola ranks among the the most dubious strategies in U.S. business history. A strategy that likely left some consumers puzzled that a cola that appeared in advertisements was never available in store.

Latest Monthly Report on PCE Inflation Confirms Inflation Remains Stubbornly High

Federal Reserve Chair Jerome Powell (Photo from federalreserve.gov)

In a post yesterday, we noted that the quarterly data on the personal consumption expenditures (PCE) price index in the latest GDP report released by the Bureau of Economic Analysis (BEA) indicated that inflation was running higher than expected. Today (April 26), the BEA released its “Personal Income and Outlays” report for March, which includes monthly data on the PCE. The monthly data are consistent with the quarterly data in showing that PCE inflation remains higher than the Federal Reserve’s 2 percent annual inflation target. (A reminder that PCE inflation is particularly important because it’s the inflation measure the Fed uses to gauge whether it’s hitting its inflation target.)

The following figure shows PCE inflation (blue line) and core PCE inflation (red line)—which excludes energy and food prices—with inflation measured as the percentage change in the PCE from the same month in the previous year. Many economists believe that core inflation gives a better gauge of the underlying inflation rate. Measured this way, PCE inflation increased from 2.5 percent in February to 2.7 percent in March. Core PCE inflation remained unchanged at 2.8 percent.

The following figure shows PCE inflation and core PCE inflation calculated by compounding the current month’s rate over an entire year. (The figure above shows what is sometimes called 12-month inflation, while this figure shows 1-month inflation.) Measured this way, PCE inflation declined from 4.1 percent in February to 3.9 percent in March. Core PCE inflation increased from 3.2 percent in February to 3.9 in March. So, March was another month in which both PCE inflation and core PCE inflation remained well above the Fed’s 2 percent inflation target.


The following figure shows other ways of gauging inflation by including the 12-month inflation rate in the PCE (the same as shown in the figure above—although note that PCE inflation is now the red line rather than the blue line), inflation as measured using only the prices of the services included in the PCE (the green line), and the rate of inflation (the blue line) excluding the prices of housing, food, and energy. Fed Chair Jerome Powell has said that he is particularly concerned by elevated rates of inflation in services. Some economists believe that the price of housing isn’t accurately measured in the PCE, which makes it interesting to see if excluding the price of housing makes much difference in calculating the inflation rate. All three measures of inflation increased from February to March, with inflation in services remaining well above overall inflation and inflation excluding the prices of housing, food, and energy being somewhat lower than overall inflation.

The following figure uses the same three inflation measures as the figure above, but shows the 1-month inflation rate rather than the 12-month inflation rate. Measured this way, inflation in services increased sharply from 3.2 percent in February to 5.0 percent in March. Inflation excluding the prices of housing, food, and energy doubled from 2.0 percent in February to 4.1 percent in March.

Overall, the data in this report indicate that the decline in inflation during the second half of 2023 hasn’t continued in the first three months of 2024. In fact, the inflation rate may be slightly increasing. As a result, it no longer seems clear that the Fed’s policy-making Federal Open Market Committee (FOMC) will cut its target for the federal funds rate this year. (We discuss the possibility that the FOMC will keep its target unchanged through the end of the year in this blog post.) At the press conference following the FOMC’s next meeting on April 30-May 1, Fed Chair Jerome Powell may explain what effect the most recent data have had on the FOMC’s planned actions during the remainder of the year.

Does the Latest GDP Report Indicate the U.S. Economy Is Entering a Period of Stagflation?

Arthur Burns was Fed chair during the stagflation of the 1970s. (Photo from the Wall Street Journal)

This morning, Thursday April 25, the Bureau of Economic Analysis (BEA) released its advance estimate of real GDP growth during the first quarter of 2024. The two most striking points in the report are, first, that real GDP increased in the first quarter at an annual rate of only 1.6 percent—well below the 2.5 percent increase expected in a survey of economists and the 2.7 percent increase indicated by the Federal Reserve Bank of Atlanta’s GDPNow forecast. As the following figure shows, the growth rate of real GDP has declined in each of the last two quarters from the very strong growth rate of 4.9 percent during the third quarter of 2023.  

The second striking point in the report was an unexpected increase in inflation, as measured using the personal consumption expenditures (PCE) price index. As the following figure shows, PCE inflation (the red line), measured as a compound annual rate of change, increased from 1.8 percent in the fourth quarter of 2023 to 3.4 percent in the first quarter of 2024. Core PCE inflation (the blue line), which excludes food and energy prices, increased from 2.0 percent in the fourth quarter of 2023 to 3.7 percent in the first quarter of 2024. These data indicate that inflation in the first quarter of 2024 was running well above the Federal Reserve’s 2.0 percent target.

A combination of weak economic growth and above-target inflation poses a policy dilemma for the Fed. As we discuss in Macroeconomics, Chapter 13, Section 13.3 (Economics, Chapter 23, Section 23.3), the combination of slow growth and inflation is called stagflation. During the 1970s, when the U.S. economy suffered from stagflation, Fed Chair Arthur Burns (whose photo appears at the beginning of this post) was heavily criticized by members of Congress for his inability to deal with the problem. Stagflation poses a dilemma for the Fed because using an expansionary monetary policy to deal with slow economic growth may cause the inflation rate to rise. Using a contractionary monetary policy to deal with high inflation can cause growth to slow further, possibly pushing the economy into a recession.

Is Fed Chair Jerome Powell in as difficult a situation as Arthur Burns was in the 1970s? Not yet, at least. First, Burns faced a period of recession—declining real GDP and rising unemployment—whereas currently, although economic growth seems to be slowing, real GDP is still rising and the unemployment rate is still below 4 percent. In addition, the inflation rate in these data are below 4 percent, far less than the 10 percent inflation rates during the 1970s.

Second, it’s always hazardous to draw conclusions on the basis of a single quarter’s data. The BEA’s real GDP estimates are revised several times, so that the value for the first quarter of 2024 may well be revised significantly higher (or lower) in coming months.

Third, the slow rate of growth of real GDP in the first quarter is accounted for largely by a surge in imports—which are subtracted from GDP—and a sharp decline in inventory investment. Key components of aggregate demand remained strong: Consumption expenditures increased at annual rate of 2.5 per cent and business investment increased at an annual rate of 3.2 percent. Residential investment was particularly strong, growing at an annual rate 0f 13.2 percent—despite the effects of rising mortgage interest rates. One way to strip out the effects of net exports, inventory investment, and government purchases—which can also be volatile—is to look at final sales to domestic purchasers, which includes only spending by U.S. households and firms on domestic production. As the following figure shows, real final sales to domestic purchasers declined only modertately from 3.3 percent in the fourth quarter of 2023 to 3.1 percent in the first quarter of 2024.

Looking at these details of the GDP report indicate that growth may have slowed less during the first quarter than the growth rate of real GDP seems to indicate. Investors on Wall Street may have come to this same conclusion. As shown by this figure from the Wall Street Journal, shows that stock prices fell sharply when trading opened at 9:30 am, but by 2 pm has recovered some of their losses as investors considered further the implications of the GDP report. (As we discuss in Macroeconomics, Chapter 6, Section 6.2 and Economics, Chapter 8, Section 8.2, movements in stock price indexes can provide some insight into investors’ expectations of future movements in corporate profits, which, in turn, depend in part on future movements in economic growth.)

Finally, we may get more insight into the rate of inflation tomorrow morning when the BEA releases its report on “Personal Income and Outlays,” which will include data on PCE inflation during March. The monthly PCE data provide more current information than do the quarterly data in the GDP report.

In short, today’s report wasn’t good news, but may not have been as bad as it appeared at first glance. We are far from being able to conclude that the U.S. economy is entering into a period of stagflation.

Where Did Dark Age English Kings Obtain the Metal for Their Coins?

Silver pennies used in England during the 600s. (Image from Jane Kershaw, et al.)

As economies move from subsistence agriculture towards specialization and trade, the inefficiency of barter exchange pushes them toward developing money. Any commodity that is widely accepted in payment for goods and services—that is, any commodity that can function as a medium of exchange—can be used as money. As we discuss in a recent blog post, in frontier America animal hides were used as money. In a World War II German prisoner of war camp, the British prisoners used cigarettes as money.  Most economies made a transition from using commodities like animal skins to using coins made of precious metals, such as copper, silver, and gold. (We discuss the development of money in Macroeconomics, Chapter 14, Section 14.1, Economics, Chapter 24, Section 24.1, and Essentials of Economics, Chapter 16, Section 16.1.)

Coins were typically minted by kings, local warlords, bishops, or other people with control over a sufficient sized territory to make minting coins worthwhile. Where did they get the metal needed to mint coins? During the height of the gold standard in the 1800s and early 1900s, governments could rely on supplies of precious metals from domestic mines or from trade with other countries. In earlier periods, access to sufficient supplies of precious metals could be more difficult.

A recent academic paper by Jane Kershaw, of the University of Oxford; Stephen W. Merkel and Paolo D’Imporzano, of Vrije Universiteit Amsterdam; and Rory Naismith the University of Cambridge, examined the case of coins minted by kings of England during the year 660 to 820. During the time from the year 43 to the year 409, most of modern England and Wales was part of the Roman Empire. (A non-technical summary of the paper, with a video, is here. A timeline of Roman Britain is here.) During that time, the Roman province of Britannia used the same gold, silver, and copper coins used throughout the empire. After the withdrawal of the last Roman legions, England experienced waves of invasions from Saxons, Angles, and other Germanic tribes that destroyed most of Roman civilization on the island. Very few written records have survived from 409 through the end of the 500s. But it’s likely that few, if any, coins were minted during this period.

As trade within England began to revive in the second half of the 600s, the demand for coins increased. Given the inefficiency of barter, the absence of a sufficient supply of coins would have hobbled the growth of trade. With more than 200 years having passed since the end of Roman rule, Roman coins were no longer available in significant quantities. The increased demand for coins was met by silver pennies, like those shown in the photo at the top of this post.

Where did the rulers of the various English kingdoms get the silver to mint pennies, given that there were no known silver mines operating during this period? Searching for clues, Jane Kershaw and her colleagues analyzed the composition of the silver used in the pennies. Surprisingly, the silver turned out to have the same composition as silver used in the Byzantine Empire in the eastern Mediterranean. Because in this period there was little to no trade between England and the Byzantine Empire, Kershaw and colleagues believe that the silver was likely obtained from melting silver objects, like the plate shown above, obtained from trade with the Byzantine Empire in earlier periods.

The work of these researchers has provided insight into an historical example of governments supplying the money needed to facilitate the transition away from barter.

Glenn’s Op-Ed on the Need for Pro-Growth Policies

(Photo from the New York Times.)

This op-ed orginally appeared in the Wall Street Journal.

Put Growth Back on the Political Agenda

In a campaign season dominated by the past, a central economic topic is missing: growth. Rapid productivity growth raises living standards and incomes. Resources from those higher incomes can boost support for public goods such as national defense and education, or can reconfigure supply chains or shore up social insurance programs. A society without growth requires someone to be worse off for you to be better off. Growth breaks that zero-sum link, making it a political big deal.

So why is the emphasis on growth fading? More than economics is at play. While progress from technological advances and trade generally is popular, the disruption that inevitably accompanies growth and hits individuals, firms and communities has many politicians wary. Such concerns can lead to excessive meddling via industrial policy.

As we approach the next election, the stakes for growth are high. Regaining the faster productivity that prevailed before the global financial crisis requires action. The nonpartisan Congressional Budget Office estimates  potential gross domestic product growth of 1.8% over the coming decade, and somewhat lower after that. Those figures are roughly 1 percentage point lower than the growth rate over the three decades before the pandemic. Many economists believe productivity gains from generative artificial intelligence can raise growth in coming decades. But achieving those gains requires an openness to change that is rare in a political climate stuck in past grievances about disruption—the perennial partner of growth.

Traditionally, economic policy toward growth emphasized support for innovation through basic research. Growth also was fostered by reducing tax burdens on investment, streamlining regulation (which has proliferated during the Biden administration) and expanding markets. These important actions have flagged in recent years. But such attention, while valuable, masks inattention to adverse effects on some individuals and communities, raising concerns about whether open markets advance broad prosperity.

This opened a lane for backward-looking protectionism and industrial policy from Democrats and Republicans alike. Absent strong national-defense arguments (which wouldn’t include tariffs on Canadian steel or objections to Japanese ownership of a U.S. steel company), protectionism limits growth. According to polls by the Chicago Council on Global Affairs, roughly three-fourths of Americans say international trade is good for the economy. Finally, protectionism belies ways in which gains from openness may be preserved, such as by simultaneously offering support for training and work for communities of individuals buffeted by trade and technological change.

On industrial policy, it is true that markets can’t solve every allocation problem. But such concerns underpin arguments for greater federal support of research for new technologies in defense, climate-change mitigation, and private activity, not micromanaged subsidies to firms and industries. If a specific defense activity merits assistance, it could be subsidized. These alternatives mitigate the problems in conventional industrial policy of “winner picking” and, just as important, the failure to abandon losers. It is policymakers’ hyperattention to those buffeted by change that hampers policy effectiveness and, worse, invites rent-seeking behavior and costly regulatory micromanagement.

Examples abound. Appending child-care requirements to the Chips Act and the inaptly named Inflation Reduction Act has little to do with those laws’ industrial policy purpose. The Biden administration’s opposition to Nippon Steel’s acquisition of U.S. Steel raises questions amid the current wave of industrial policy. How is a strong American ally’s efficient operation of an American steel company with U.S. workers an industrial-policy problem? Flip-flops on banning TikTok fuel uncertainty about business operations in the name of industrial policy.

The wrongly focused hyperattention is supposedly grounded in putting American workers first. But it raises three problems. First, the interventions raise the cost of investments, and the jobs they are to create or protect, by using mandates and generating policy uncertainty. Second, they contradict the economic freedom in market economies of voluntary transactions. Absent a strong national-security foundation, why is public policy directing investment in or ownership of assets? Such policies threaten the nation’s long-term prosperity by discouraging investment and invite rent-seeking in a way that voluntary market transactions don’t. Both problems hamstring growth. 

Third, and perhaps most important, such micromanagement misses the economic and political mark of actually helping individuals and communities disrupted by growth-enhancing openness. A more serious agenda would focus on training suited to current markets (through, for example, more assistance to community colleges), on work (through expanding the Earned Income Tax Credit), and on aid to communities hit by prolonged employment loss (through services that enhance business formation and job creation). The federal government could also establish research centers around the country to disseminate ideas for businesses. 

Growth matters—for individual livelihoods, business opportunities and public finances. Pro-growth policies that account for disruption’s effects while encouraging innovation, saving, capital formation, skill development and limited regulation must return to the economic agenda. A shift to prospective, visionary thinking would reorient the bipartisan, backward-looking protectionism and industrial policy that weaken growth and fail to address disruption.

Another Effect of Inflation in the Long Run—People Are Throwing Their Coins in the Trash

Should you just throw these away?

It’s not surprising that waste management firms often recycle metals that have either been separated by households and firms in recycling bins or have been thrown away mixed in with other trash. But according to a recent article in the Wall Street Journal, Reworld, a nationwide waste management firm headquartered in Morristown, New Jersey, has been recovering metal that you wouldn’t ordinarily expect to find in garbage: U.S. coins. Are these coins that people have accidentally thrown in the garbage? Some of the coins were probably mistakenly included in garbage but the article indicates that most were likely intentionally thrown away:

“Coins are as good as junk for many Americans…. [Many people believe that] change is often more trouble than it is worth to carry around.”

Why would people throw coins—things of obvious value—into the garbarge? As we discuss in Macroeconomics, Chapter 14, Section 14.1 (Economics, Chapter 24, Sextion 24.1 and Essentials of Economics, Chapter 16, Section 16.1), consumers have been buying things using paper money and coins much less frequently in recent years. People have relied more on making purchases or transferring funds using credit and debit cards, Apple Pay and Google Pay, or smartphones apps like Venmo.

Even if people use cash to buy things, they are more likely to use paper currency rather than coins. As prices increase, the amount of goods or services you can buy with a coin of a given face value decreases. For instance, the following figure shows that with a quarter you could have bought 25 cents worth of goods and services in 1980 but, because of inflation, only 7 cents worth of goods and services in 2023.

In other words, coins have become less useful both because more convenient means of payment, such as Apple Pay or Venmo, have become more widely and available and because inflation has eroded the purchasing power of coins. In addition, for decades, drinks, snacks, and other products sold from vending machines could only be purchased using coins. But in recent years, most vending machines have been modified to accept credit cards. Because fewer people use coins to buy things, if they receive coins in change after paying with paper currency, they are likely to just accumulate the coins in a jar or other container or, as Reworld has discovered, throw the coins in the garbage.

If an increasing number of coins are being thrown away, should the government stop minting them? It’s unlikely that the U.S. Mint will stop producing all coins, but there have been serious proposals to at least stop producing the penny and, perhaps, also the nickel. Governments make a profit from issuing money because it is usually produced using paper or low-value metals that cost far less than the face value of the money. The government’s profit from issuing money is called seigniorage.

As the following figure shows (cents are measured on the vertical axis), in recent decades, the penny and the nickel have cost more to produce than their face value. In other words, the federal government has experienced negative seigniorage in minting pennies and nickels, paying more to produce them than they are worth. For instance, in 2023, as the blue line shows, it cost 3.1 cents to produce a penny and distribute it to Federal Reserve Banks (which, in turn, distribute coins to local commercial banks). Similarly, each nickel (the orange line) cost 11.5 cents to produce and distribute. The penny is made from copper and zinc and the other coins are made from copper and nickel. As the market prices of these metals change, so does the cost to the Mint of producing the coins, as shown in the figure.

Data in the figure were compiled from the U.S. Mint’s biennial reports to Congress.

François Velde, an economist at the Federal Reserve Bank of Chicago, has come up with a possible solution to the problem of the penny: The federal government would simply declare that Lincoln pennies are now worth five cents. There would then be two five-cent coins in circulation—the current Jefferson nickels and the current Lincoln pennies—and no one-cent coins. In the future, only the Lincoln coins—now worth five cents—would be minted. This would solve the problem of consumers and retail stores having to deal with pennies, it would make the face value of the Lincoln five-cent coin greater than its cost of production, and it would also deal with the problem that the current Jefferson nickel costs more than five cents to produce.

With some consumers valuing coins so little that they throw them out in the trash and with the U.S. Mint spending more than their face value to produce pennies and nickels, it seems likely that at some point Congress will make changes to U.S. coinage.

Will the Fed Not Cut Rates at All this Year?

Federal Reserve Vice Chair Philip Jefferson (photo from the Federal Reserve)

Federal Reserve Chair Jerome Powell (photo from the Federal Reserve)

At the beginning of 2024, investors were expecting that during the year the Fed’s policy-making Federal Open Market Committee (FOMC) would cut its target range for the federal funds rate six or seven times. At its meeting on March 19-20 the economic projections of the members of the FOMC indicated that they were expecting to cut the target range three times from its current 5.25 percent to 5.50 percent. But, as we noted in this recent post and in this podcast, macroeconomic data during the first three months of this year indicated that the U.S. economy was growing more rapidly than the Fed had expected and the reductions in inflation that occurred during the second half of 2023 had not persisted into the beginning of 2024.

The unexpected strength of the economy and the persistence of inflation above the Fed’s 2 percent target have raised the issue of whether the FOMC will cut its target range for the federal funds rate at all this year. Earlier this month, Neel Kashkari, president of the Federal Reserve Bank of Minneapolis raised the possibility that the FOMC would not cut its target range this year.

Today (April 16) both Fed Vice Chair Philip Jefferson and Fed Chair Jerome Powell addressed the issue of monetary policy. They gave what appeared to be somewhat different signals about the likely path of the federal funds target during the remainder of this year—bearing in mind that Fed officials never commit to any specific policy when making a speech. Adressing the International Research Forum on Monetary Policy, Vice Chair Jefferson stated that:

“My baseline outlook continues to be that inflation will decline further, with the policy rate held steady at its current level, and that the labor market will remain strong, with labor demand and supply continuing to rebalance. Of course, the outlook is still quite uncertain, and if incoming data suggest that inflation is more persistent than I currently expect it to be, it will be appropriate to hold in place the current restrictive stance of policy for longer.”

One interpretation of his point here is that he is still expecting that the FOMC will cut its target for the federal funds rate sometime this year unless inflation remains persistently higher than the Fed’s target—which he doesn’t expect.

Chair Powell, speaking at a panel discussion at the Wilson Center in Washington, D.C., seemed to indicate that he believed it was less likely that the FOMC would reduce its federal funds rate target in the near future. The Wall Street Journal summarized his remarks this way:

“Federal Reserve Chair Jerome Powell said firm inflation during the first quarter had introduced new uncertainty over whether the central bank would be able to lower interest rates this year without signs of an economic slowdown. His remarks indicated a clear shift in the Fed’s outlook following a third consecutive month of stronger-than-anticipated inflation readings ….”

An article on bloomberg.com had a similar interpretation of Powell’s remarks: “Federal Reserve Chair Jerome Powell signaled policymakers will wait longer than previously anticipated to cut interest rates following a series of surprisingly high inflation readings.”

Politics may also play a role in the FOMC’s decisions. As we discuss in Macroeconomics, Chapter 17, Section 17.4 (Economics, Chapter 27, Section 27.4), the Federal Reserve Act, which Congress passed in 1913 and has amended several times since, puts the Federal Reserve in an unusal position in the federal government. Although the members of the Board of Governors are appointed by the president and confirmed by the Senate, the Fed was intended to act independently of Congress and the president. Over the years, Fed Chairs have protected that independence by, for the most part, avoiding taking actions beyond the narrow responsibilites Congress has given to the Fed by Congress and by avoiding actions that could be interpreted as political.

This year is, of course, a presidential election year. The following table from the Fed’s web site lists the FOMC meetings this year. The presidential election will occur on November 5. There are four scheduled FOMC meetings before then. Given that inflation has been running well above the Fed’s target during the first three months of the year, it would likely take at least two months of lower inflation data—or a weakening of the economy as indicated by a rising unemployment rate—before the FOMC would consider lowering its federal funds rate target. If so, the meeting on July 30-31 might be the first meeting at which a rate reduction would occur. If the FOMC doesn’t act at its July meeting, it might be reluctant to cut its target at the September 17-18 meeting because acting close to the election might be interpreted as an attempt to aid President Joe Biden’s reelection.

Although we don’t know whether avoiding the appearance of intervening in politics is an important consideration for the members of the FOMC, some discussion in the business press raises the possibility. For instance, a recent article in the Wall Street Journal noted that:

“The longer that officials wait, the less likely there will be cuts this year, some analysts said. That is because officials will likely resist starting to lower rates in the midst of this year’s presidential election campaign to avoid political entanglements.”

These are clearly not the easiest times to be a Fed policymaker!

Solved Problem: Will Investors in Japan and Europe Buy the Increased Quantity of U.S. Treasury Bonds?

Supports: Macroeconomics, Chapter 18, Section 18.2;  Economics, Chapter 28, Section 28.2; and Essentials of Economics, Chapter 19, Section 19.6.

As the figure above shows, federal government debt, sometimes called the national debt, has been increasing rapidly in the years since the 2020 Covid pandemic. (The figure show federal government debt held by the public, which excludes debt held by federal government trust funds, such as the Social Security trusts funds.) The debt grows each year the federal government runs a budget deficit—that is, whenever federal government expenditures exceed federal government revenues. The Congressional Budget Office (CBO) forecasts large federal budget deficits over the next 30 years, so unless Congress and the president increase taxes or cut expenditures, the size of the federal debt will continue to increase rapidly. (The CBO’s latest forecast can be found here. We discuss the long-run deficit and debt situation in this earlier blog post.)

When the federal government runs a budget deficit, the U.S. Treasury must sell Treasury bills, notes, and bonds to raise the funds necessary to bridge the gap between revenues and expenditures. (Treasury bills have a maturity—the time until the debt is paid off by the Treasury—of 1 year or less; Treasury notes have a maturity of 2 years to 10 years; and Treasury bonds have a maturity of greater than 10 years. For convenience, we will refer to all of these securities as “bonds.”) A recent article in the Wall Street Journal discussed the concern among some investors about the ability of the bond market to easily absorb the large amounts of bonds that Treasury will have to sell. (The article can be found here. A subscription may be required.)

According to the article, one source of demand is likely to be European and Japanese investors.

“The euro and yen are both sinking relative to the dollar, in part because the Bank of Japan is still holding rates low and investors expect the European Central Bank to slash them soon. That could increase demand for U.S. debt, with Treasury yields remaining elevated relative to global alternatives.”

a. What does the article mean by “the euro and the yen are both sinking relative to the dollar”?

b. Why would the fact that U.S. interest rates are greater than interest rates in Europe and Japan cause the euro and the yen to sink relative to the dollar?

c. If you were a Japanese investor, would you rather be invested in U.S. Treasury bonds when the yen is sinking relative to the dollar or when it is rising? Briefly explain.

Solving the Problem

Step 1:  Review the chapter material. This problem is about the determinants of exchange rates, so you may want to review Macroeconomics, Chapter 18, Section 18.2, “The Foreign Exchange Market and Exchange Rates” (Economics, Chapter 28, Section 28.2; Essentials of Economics, Chapter 19, Section 19.6.)

Step 2: Answer part a. by explaining what it means that the euro and the yen “sinking relative to the dollar.” Sinking relative to the dollar means that the exchange rates between the euro and the dollar and between the yen and the dollar are declining. In other words, a dollar will exchange for more yen and for more euros.

Step 3: Answer part b. by explaining how differences in interest rates between countries can affect the exchange between the countries’ currencies. Holding other factors that can affect the attractiveness of an investment in a country’s bonds constant, the demand foreign investors have for a country’s bonds will depend on the difference in interest rates between the two countries. For example, a Japanese investor will prefer to invest in U.S. Treasury bonds if the interest rate is higher on Treasury bonds than the interest rate on Japanese government bonds. So, if interest rates in Europe decline relative to interest rates in the United States, we would expect that European investors will increase their investments in U.S. Treasury bonds. To invest in U.S. Treasury bonds, European investors will need to exhange euros for dollars, causing the supply curve for euros in exchange for dollars to shift to the right, reducing the value of the euro.

Step 4: Answer part c. by discussing whether if you were a Japanese investor, you would you rather be invested in U.S. Treasury bonds when the yen is sinking relative to the dollar or when it is rising.  In answering this part, you should draw a distinction between the situation of a Japanese investor who already owns U.S. Treasury bonds and one who is considering buying U.S. Treasury bonds. A Japanese investor who already owns U.S. Treasury bonds would definitely prefer to own them when the value of the yen if falling against the dollar. In this situation, the investor will receive more yen for a given amount of dollars the investor earns from the Treasury bonds. A Japanese investor who doesn’t currently own U.S. bonds, but is thinking of buying them, would want the value of the yen to be increasing relative to the dollar because then the investor would have to pay fewer yen to buy a Treasury bond with a price in dollars, all other factors being equal. (The face value of a Treasury bond is $1,000, although at any given time the price in the bond market may not equal the face value of the bond.) If the interest rate difference between U.S. and Japanese bonds is increasing at the same time as the value of the yen is decreasing (as in the situation described in the article) a Japanese investor would have to weigh the gain from the higher interest rate against the higher price in yen the investor would have to pay to buy the Treasury bond.