Happy Holidays!

Image generated by GTP-4o of people shopping.
As we discussed in this blog post on Wednesday, the Federal Reserve’s policymaking Federal Open Market Committee (FOMC) voted to reduce its target for the federal funds rate by 0.25 percentage point. After the meeting, the committee released its “Summary of Economic Projections” (SEP). The SEP showed that the committee’s forecasts of the inflation rate as measured by the personal consumption expenditures (PCE) price index for this year and next year are both higher than the committee had forecast in September, when the last SEP was released. The Fed relies on annual changes in the PCE price index to evaluate whether it’s meeting its 2 percent annual inflation target.
This morning (December 20), the BEA released monthly data on the PCE price index as part of its “Personal Income and Outlays” report for November.
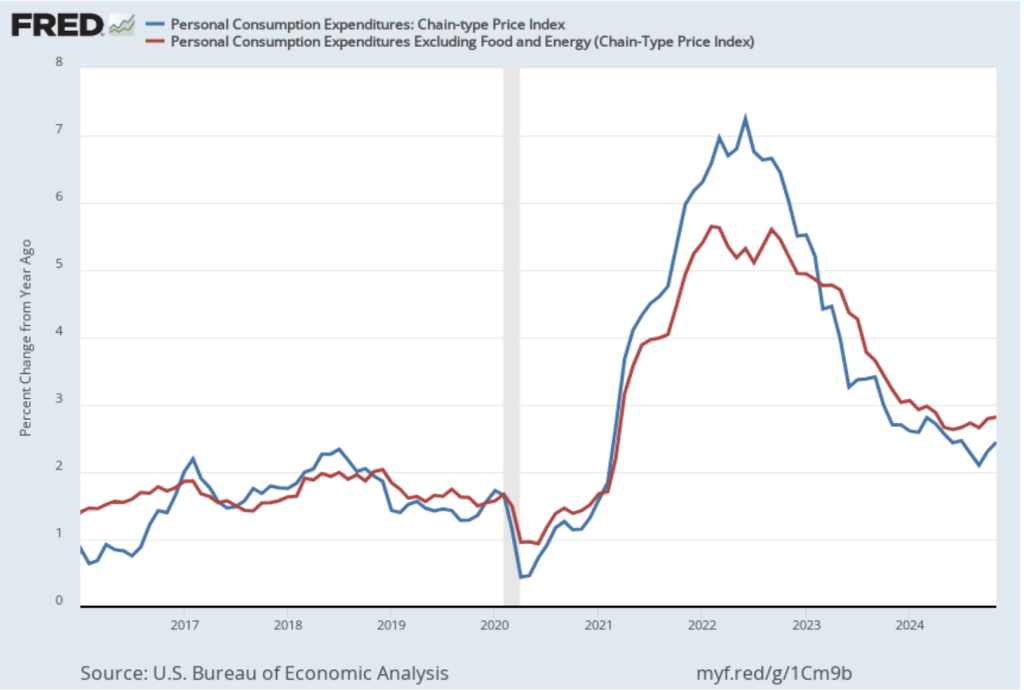
The following figure shows PCE inflation (the blue line) and core PCE inflation (the red line)—which excludes energy and food prices—for the period since January 2016 with inflation measured as the percentage change in the PCE from the same month in the previous year. Measured this way, in November PCE inflation was 2.4 percent, up from 2.3 percent in October. Core PCE inflation in November was 2.8 percent, unchanged from October. Both PCE inflation and core PCE inflation were slightly lower than the expectations of economists surveyed before the data were released.
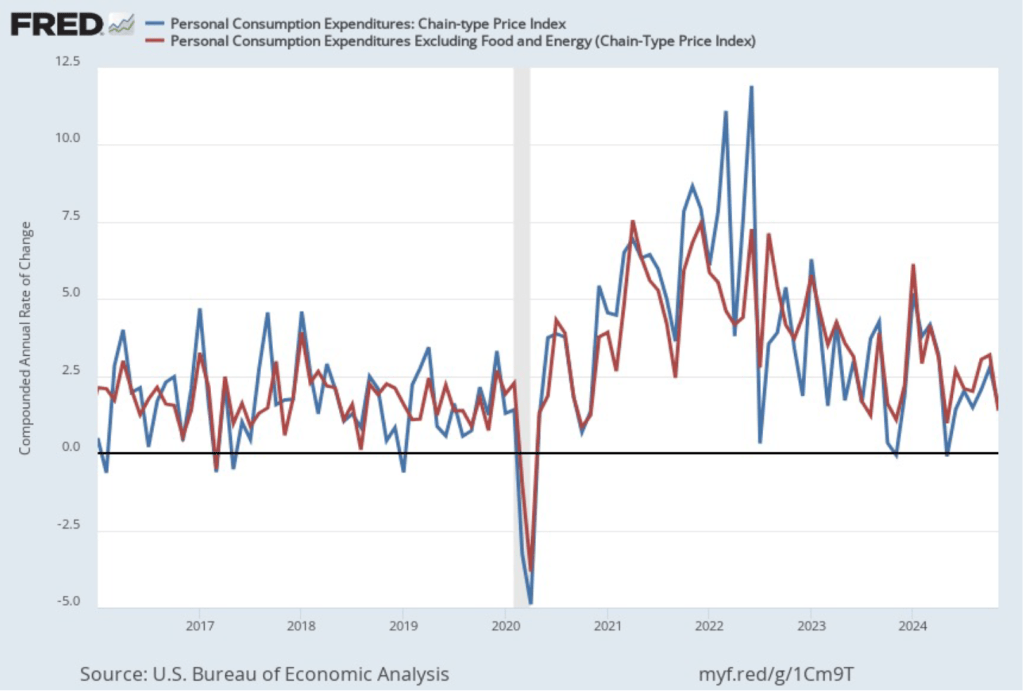
The following figure shows PCE inflation and core PCE inflation calculated by compounding the current month’s rate over an entire year. (The figure above shows what is sometimes called 12-month inflation, while this figure shows 1-month inflation.) Measured this way, PCE inflation fell sharply in November to 1.5 percent from 2.8 percent in October. Core PCE inflation also fell from 3.2 percent in October to 1.4 percent in November. Although both 12-month PCE inflation and 12-month core PCE inflation remained above the Fed’s 2 percent annual inflation target, 1-month PCE inflation and 1-month core PCE inflation dropped to well below the inflation target. But the usual caution applies that data from one month shouldn’t be overly relied on; it’s far too soon to draw the conclusion that inflation is likely to remain below the 2 percent target in future months.
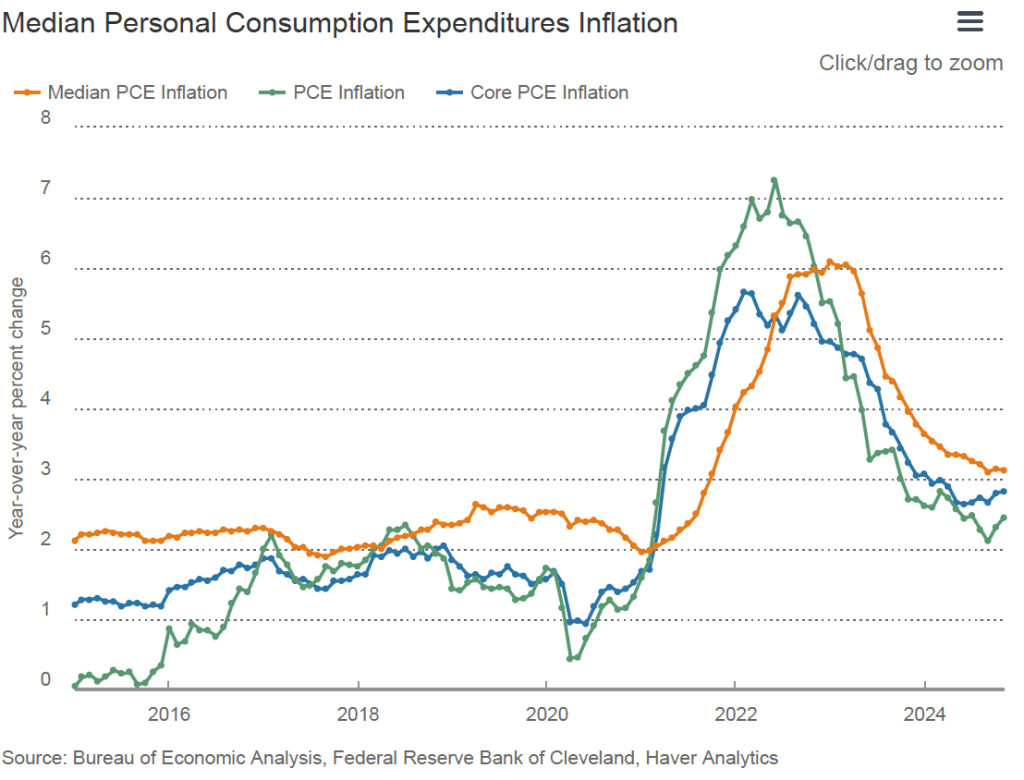
Median inflation is calculated by economists at the Federal Reserve Bank of Cleveland and Ohio State University as another way of measuring the underlying trend in inflation. If we listed the inflation rate for each individual good or service included in the PCE, median inflation is the inflation rate of the good or service that is in the middle of the list—that is, the inflation rate in the price of the good or service that has an equal number of higher and lower inflation rates. The following figure from the Federal Reserve Bank of Cleveland includes, along with PCE inflation (the green line) and core PCE inflation (the blue line), median PCE inflation (the orange line). All three inflation rates are measured over 12 months. Median PCE inflation in November was 3.1 percent, unchanged from October.
In his press conference earlier this week, Fed Chair Jerome Powell noted that: “we’ve had recent high readings from non-market services.” Non-market services are services whose prices the BEA imputes rather than measures directly. For instance, the BEA assumes that prices of financial services—such as brokerage fees—vary with the prices of financial assets. So that if stock prices rise, the prices of financial services included in the PCE price index also rise. Powell argued that these imputed prices “don’t really tell us much about … tightness in the economy. They don’t really reflect that.” The following figure shows 12-month inflation (the blue line) and 1-month inflation (the red line) for market-based PCE, excluding the prices of food and energy. (The BEA explains the market-based PCE measure here.)
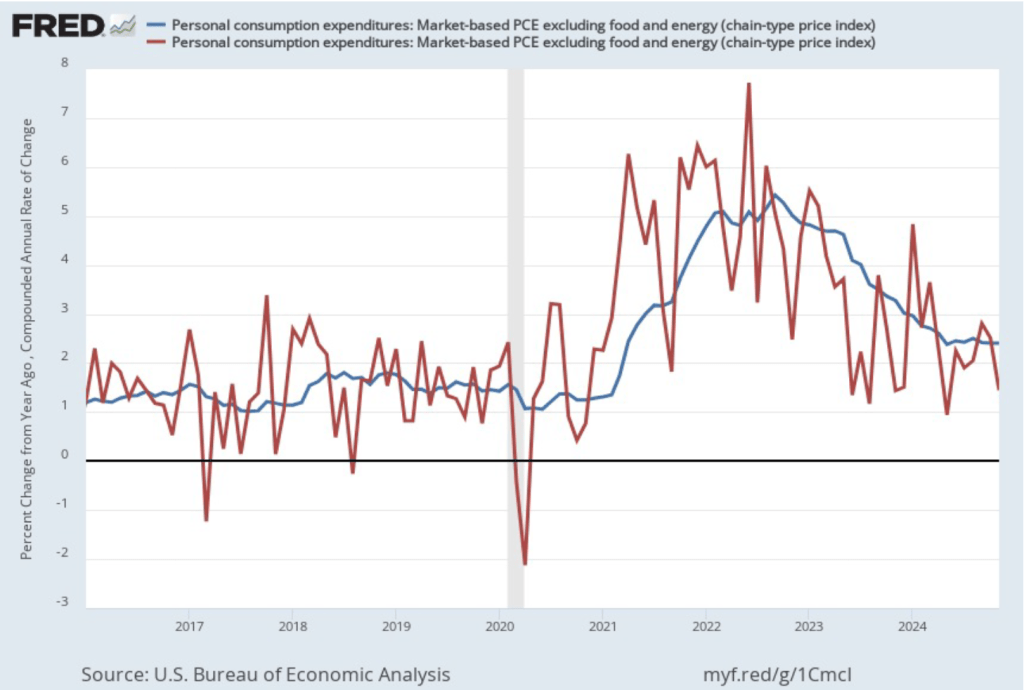
These measures of inflation tell a similar story to the measures considered earlier: 12-month inflation continues to run above the Fed’s 2 percent inflation target, while 1-month inflation slowed significantly in November and is below the 2 percent target. By this measure 12-month inflation was unchanged in November at 2.4 percent, while 1-month inflation declined from 2.5 percent in October to 1.4 percent in November.
To summarize, the less volatile 12-month measures of inflation show it to be persistently above the Fed’s target, while the more volatile 1-month measures show inflation to have fallen below target. If the FOMC were to emphasize the 1-month measures, we might expect them to continue cutting the target for the federal funds rate at the committee’s next meeting on January 28-29. The more likely outcome is that, unless other macroeconomic data that are released between now and that meeting indicate a significant strengthening or weakening of the economy, the committee will leave its target for the federal funds rate unchanged. (The BEA’s next release of monthly PCE data won’t occur until January 31, which is after the FOMC meeting.)
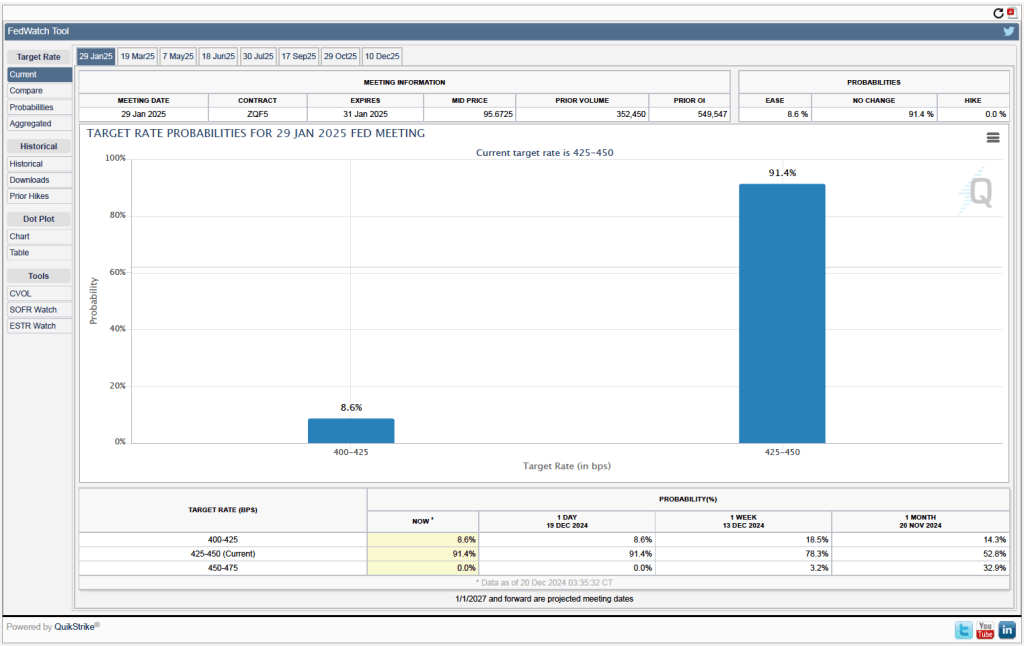
Investors who buy and sell federal funds futures contracts expect that the FOMC will leave its federal funds rate target unchanged at its next meeting. (We discuss the futures market for federal funds in this blog post.) As shown in the following figure, investors assign a probability of 91.4 percent to the FOMC leaving its target for the federal funds rate at the current range of 4.25 percent to 4.50. Investors assign a probability of only 8.6 percent to the FOMC cutting its target by 0.25 percentage point.
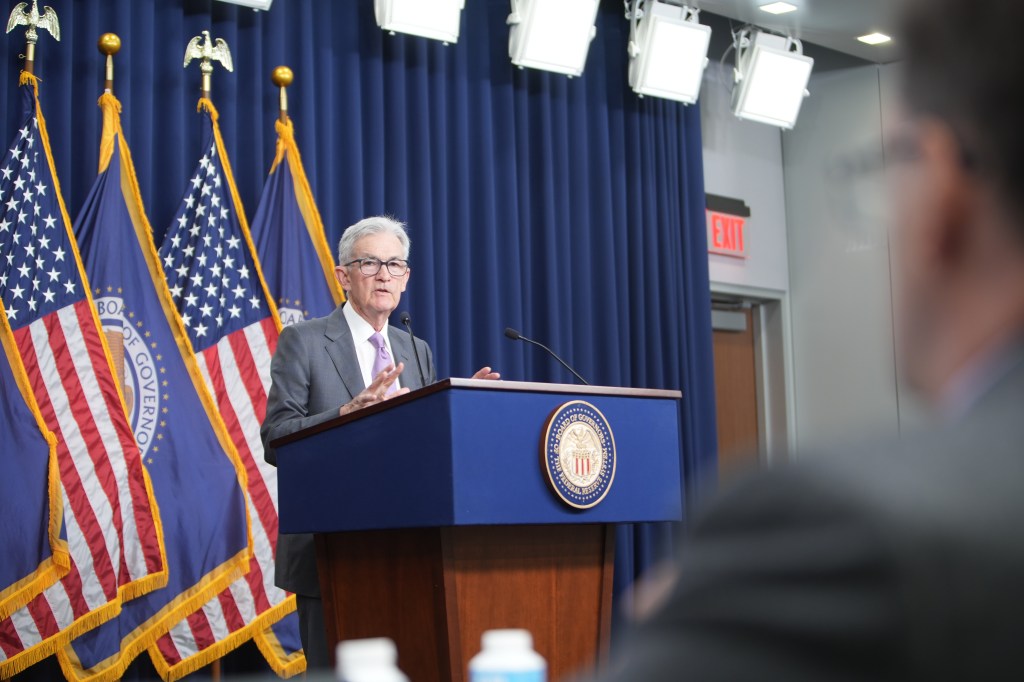
Federal Reserve Chair Jerome Powell speaks at a press conference following a meeting of the Federal Open Market Committee. (Photo from federalreserve.gov)
Members of the Fed’s Federal Open Market Committee (FOMC) had signaled that the committee was likely to cut its target range for the federal funds rate by 0.25 percentage point (25 basis points) at its meeting today (December 18). As we noted in this recent post, investors had overwhelming expected a cut of this size. Although the committee followed through with a 25 basis point cut, Fed Chair Jerome Powell noted in a press conference following the meeting that it was a “closer call” than were the two earlier cuts this year. The statement the committee released after the meeting showed that only one member—Beth M. Hammack, president of the Federal Reserve Bank of Cleveland—ended up voting against the decision to cut the target rate.
In his press conference, Powell noted that although there were some indications that the labor market has weakened, the committee believed that unemployment was likely to remain near the natural rate. The committee also saw real GDP increasing at a steady rate. Powell stated that he was optimistic about the economy and that “I expect another good year next year.” The main obstacle to the committee fulfilling its dual mandate for full employment and price stability is that inflation remains persistently above the Fed’s target of a 2 percent annual inflation rate.
After the meeting, the committee also released a “Summary of Economic Projections” (SEP)—as it typically does at its March, June, September, and December meetings. The SEP presents median values of the committee members’ forecasts of key economic variables. The values are summarized in the following table, reproduced from the release.
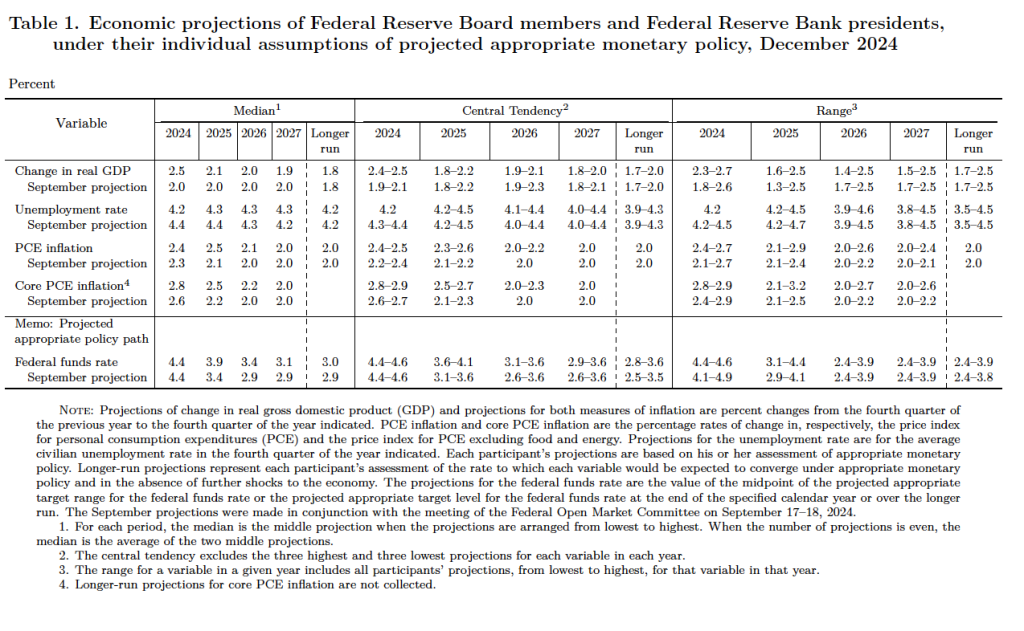
The forecasts mirror the points that Powell made in his news conference:
In his press conference, Powell noted that the main reason that PCE inflation remains high is that inflation in the prices of housing services has been running high, as have the prices of some other services. Noting that monetary policy affects the economy “with long and variable lags,” Powell stated that he believes that inflation is still on track to fall to the 2 percent target.
Given that inflation has been running closer to 2.5 percent and that the committee expects the inflation rate will still be 2.5 percent next year, a reporter asked Powell if the committee had considered the possibility of accepting a 2.5 percent inflation rate in the long run. Powell replied that: “No. We’re not going to settle for [2.5 percent inflation].” He stated that a 2 percent inflation rate is what the Fed “owes the public.”
Finally, Powell indicated that the committee would have to take into account the effects of the incoming Trump Administration’s fiscal policy actions—particularly tariff increases—when they occur. President Trump has stated that he would like to see interest rates decline more quickly, so the committee may face criticism for keeping the target for the federal funds rate higher next year than they had originally intended.
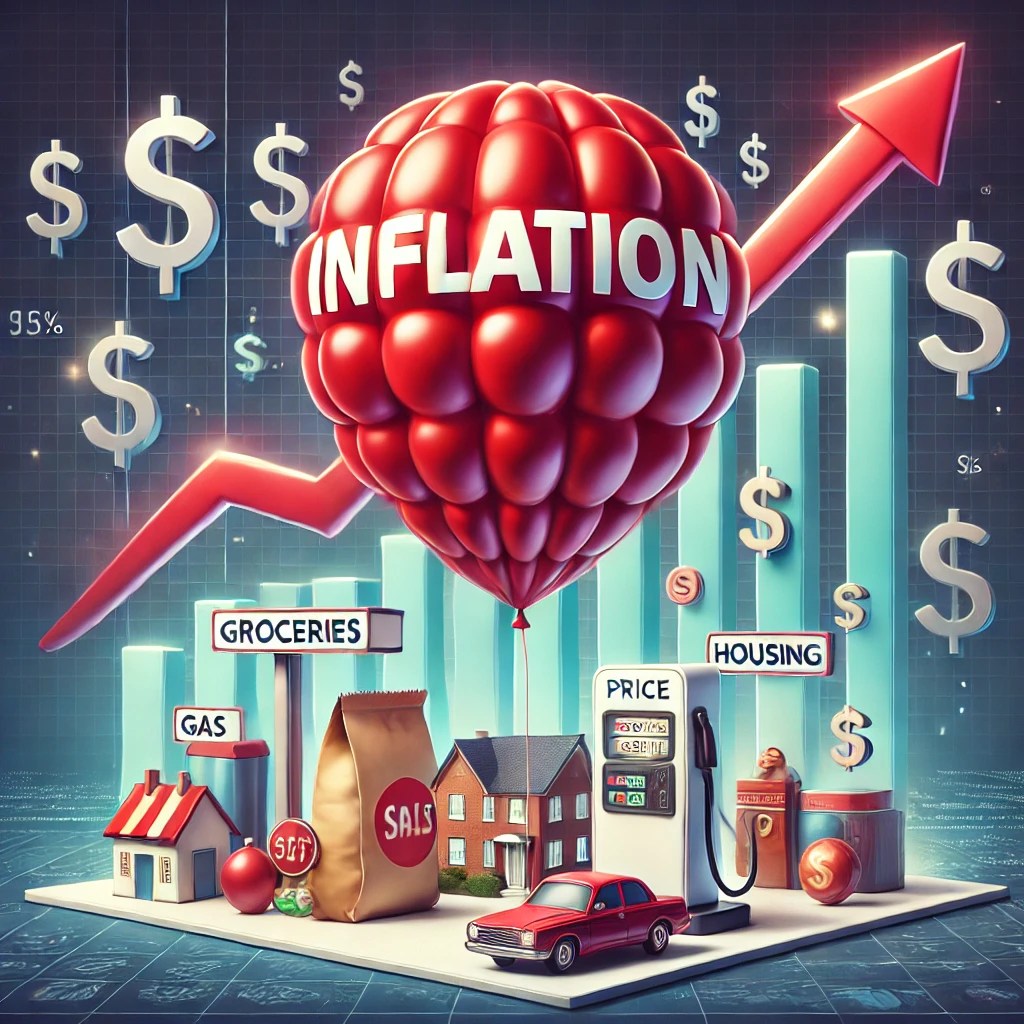
Image generated by GTP-4o illustrating inflation.
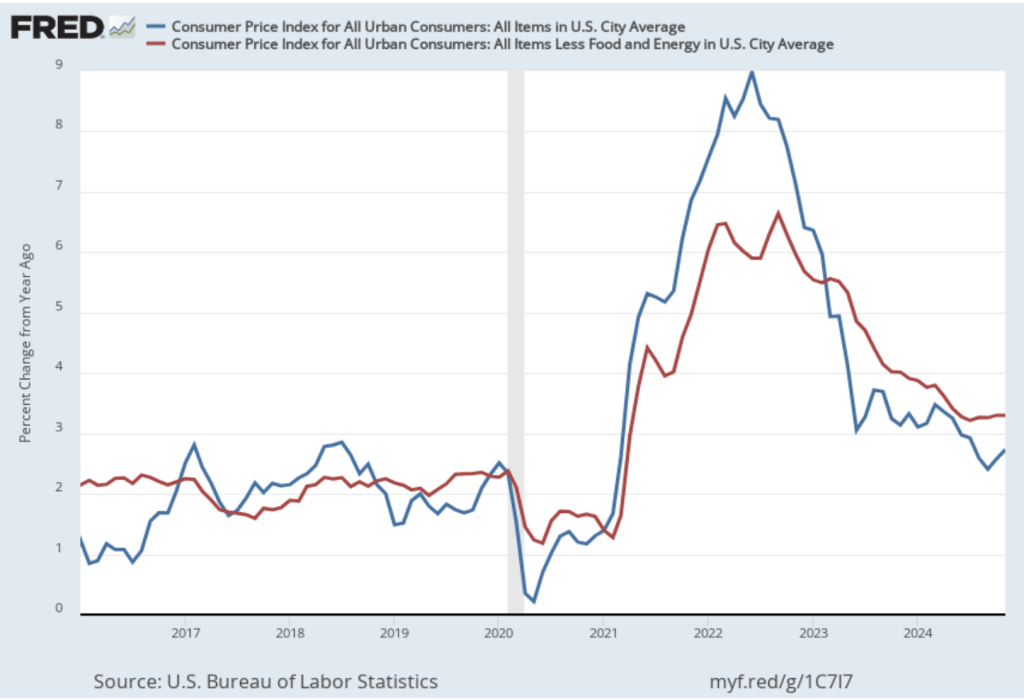
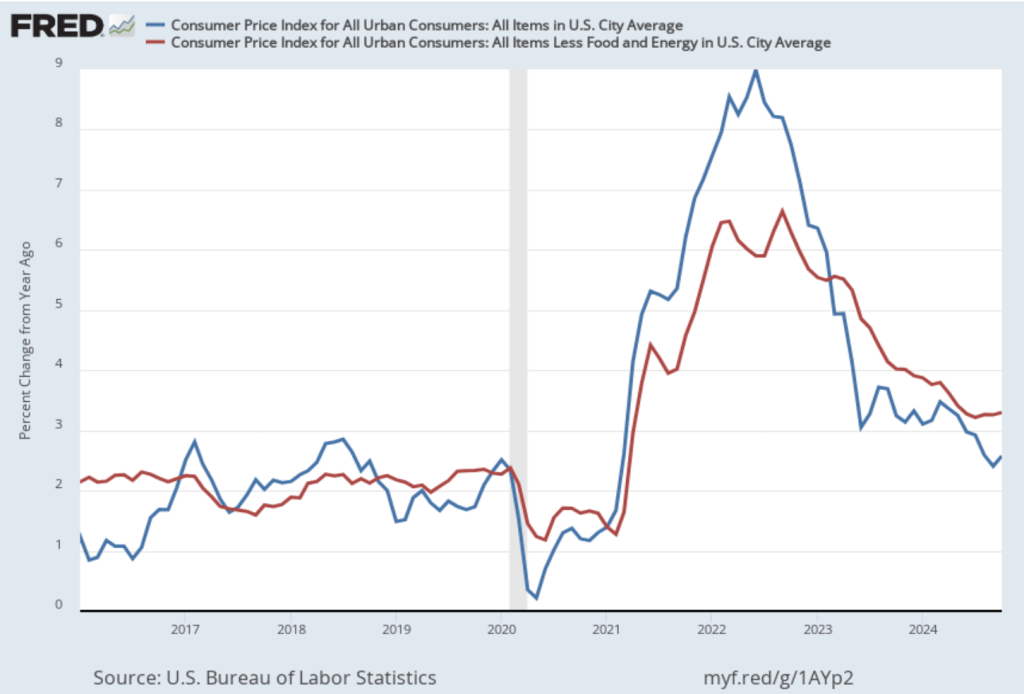
On December 11, the Bureau of Labor Statistics (BLS) released its monthly report on the consumer price index (CPI). The following figure compares headline inflation (the blue line) and core inflation (the red line).
Both headline inflation and core inflation were the same as economists surveyed by the Wall Street Journal had expected.
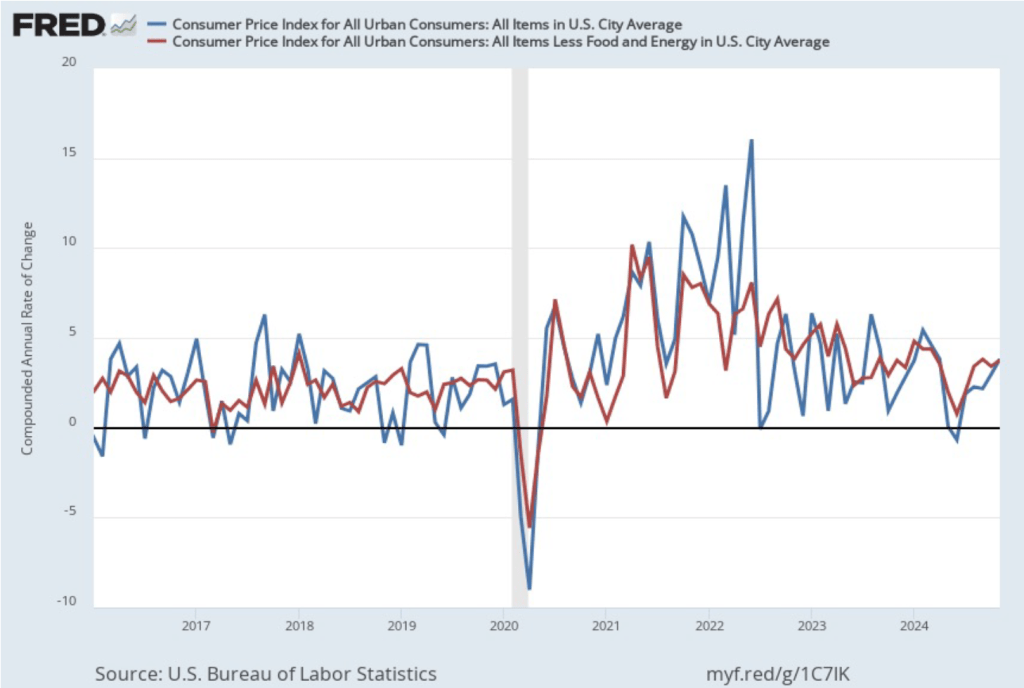
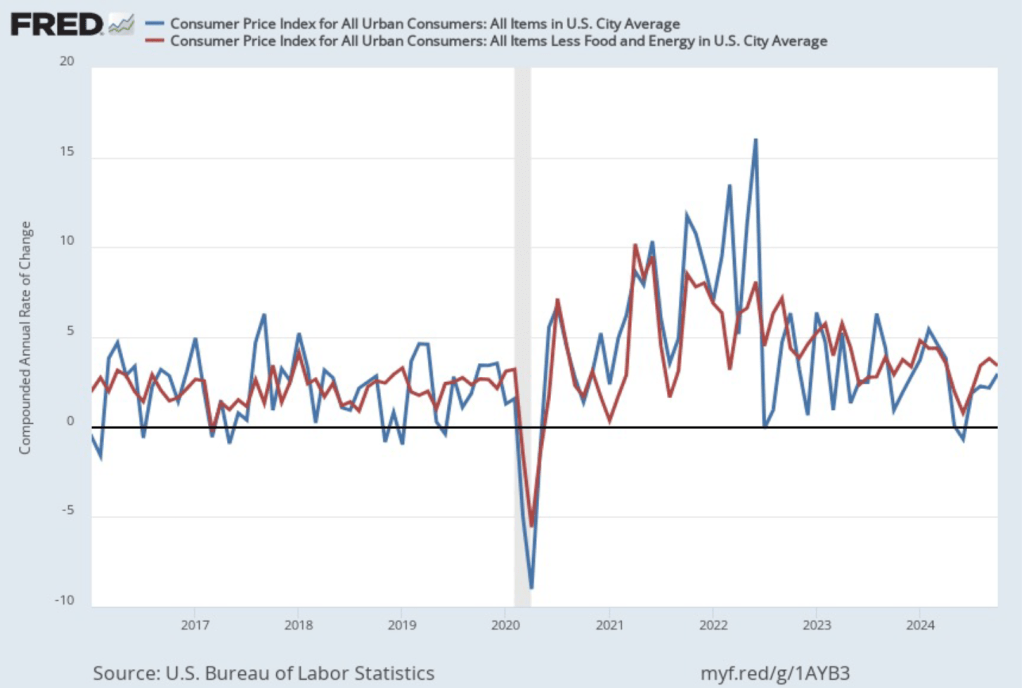
In the following figure, we look at the 1-month inflation rate for headline and core inflation—that is the annual inflation rate calculated by compounding the current month’s rate over an entire year. Calculated as the 1-month inflation rate, headline inflation (the blue line) increased sharply from 3.0 percent in October to 3.8 percent in November. Core inflation (the red line) increased from 3.4 percent in October to 3.8 percent in November.
Overall, considering 1-month and 12-month inflation together, the U.S. economy may still be on course for a soft landing—with the annual inflation rate returning to the Fed’s 2 percent target without the economy being pushed into a recession. However, progress on lowering inflation has slowed or, possibly, stalled. So, the probability of a “no landing” outcome, with inflation remaining above the Fed’s target for an indefinite period, seems to have increased.
The relatively high rates of core inflation in both the 12-month and 1-month measures are concerning because most economists believe that core inflation is a better indicator of the underlying inflation rate than is headline inflation. It’s important not to overinterpret the data from a single month, although this is the fourth month in a row that core inflation has been above 3 percent. (Note, that the Fed uses the personal consumption expenditures (PCE) price index, rather than the CPI in evaluating whether it is hitting its 2 percent inflation target.)
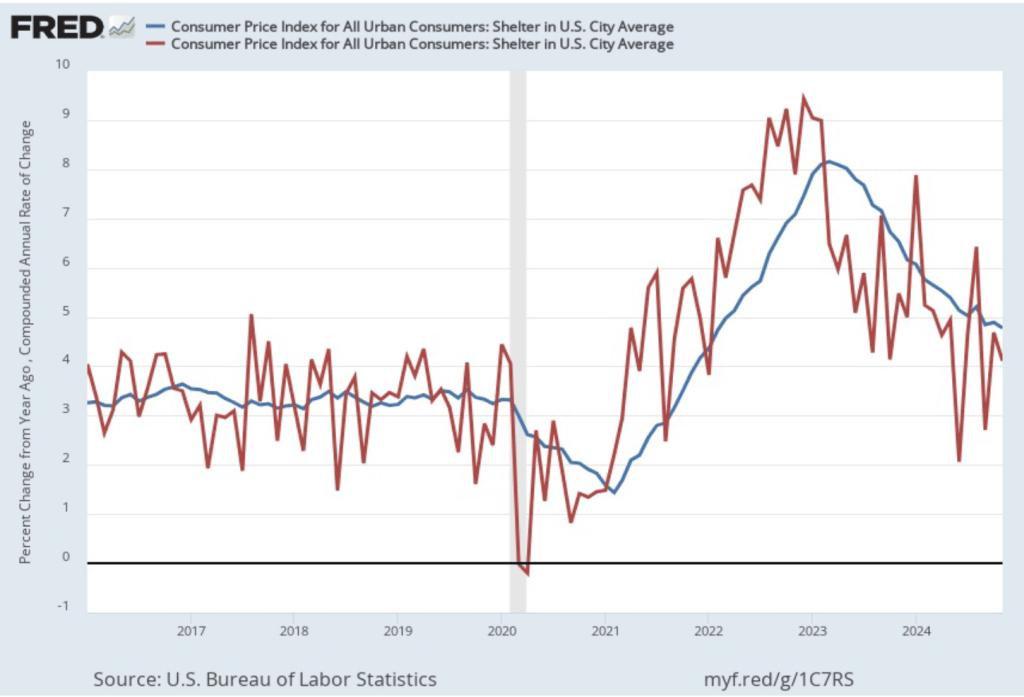
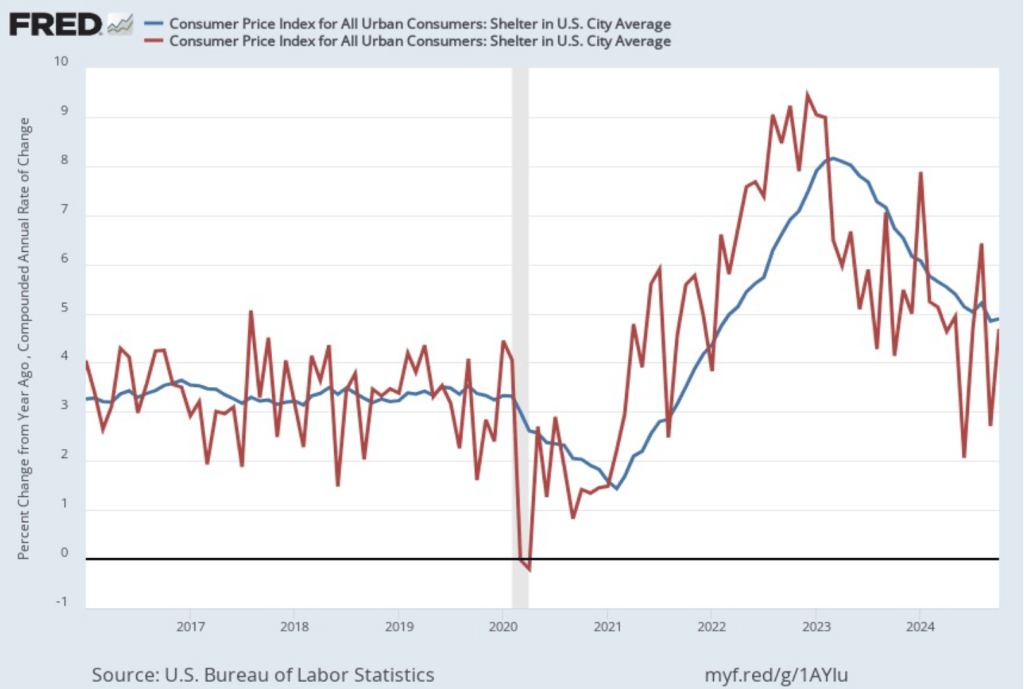
As we’ve discussed in previous blog posts, Federal Reserve Chair Jerome Powell and his colleagues on the Fed’s policymaking Federal Open Market Committee (FOMC) have been closely following inflation in the price of shelter. The price of “shelter” in the CPI, as explained here, includes both rent paid for an apartment or house and “owners’ equivalent rent of residences (OER),” which is an estimate of what a house (or apartment) would rent for if the owner were renting it out. OER is included in the CPI to account for the value of the services an owner receives from living in an apartment or house.
As the following figure shows, inflation in the price of shelter has been a significant contributor to headline inflation. The blue line shows 12-month inflation in shelter, and the red line shows 1-month inflation in shelter. Twelve-month inflation in shelter has been declining since the spring of 2023, but in November it was at a still high 4.8 percent. One-month inflation in shelter—which is much more volatile than 12-month inflation in shelter—fell from 4.7 percent in October to 4.1 percent in November.
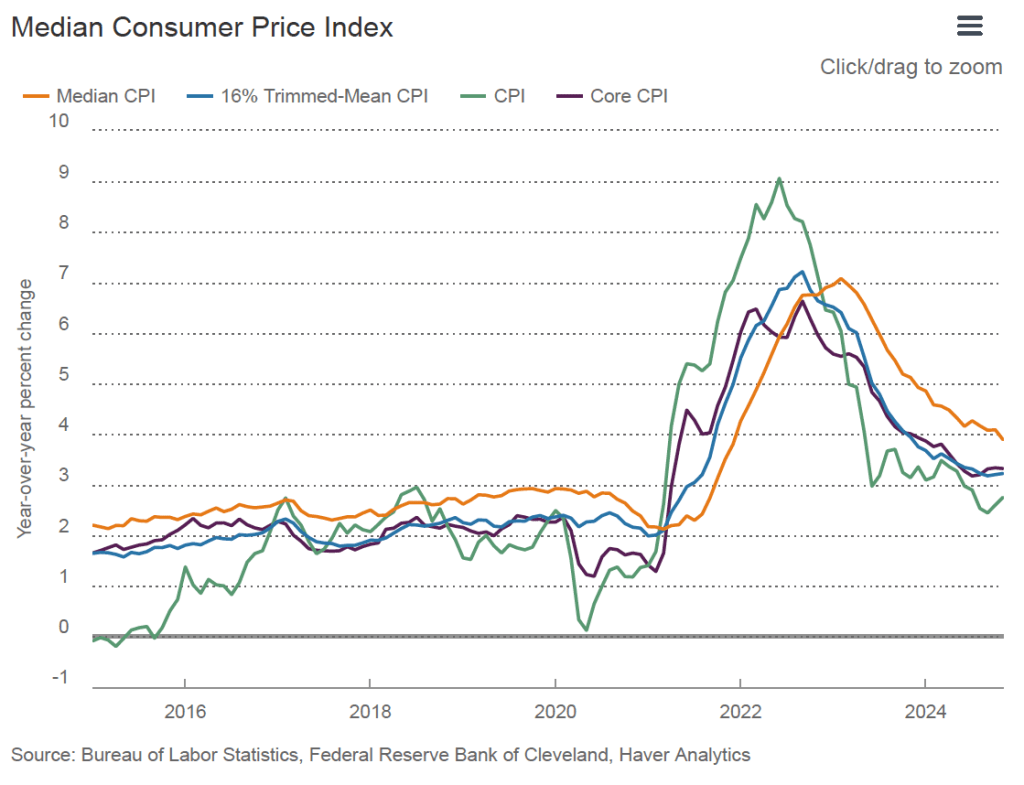
To better estimate of the underlying trend in inflation, some economists look at median inflation and trimmed mean inflation.
The following figure is from the Federal Reserve Bank of Cleveland. It shows that median inflation (the orange line) fell from 4.1 percent in October to 3.9 percent in November. Trimmed mean inflation (the blue line) was unchanged at 3.2 percent for the fourth month in a row. These data provide confirmation that (1) core CPI inflation at this point is likely running higher than a rate that would be consistent with the Fed achieving its inflation target, and (2) that progress toward the target has slowed.
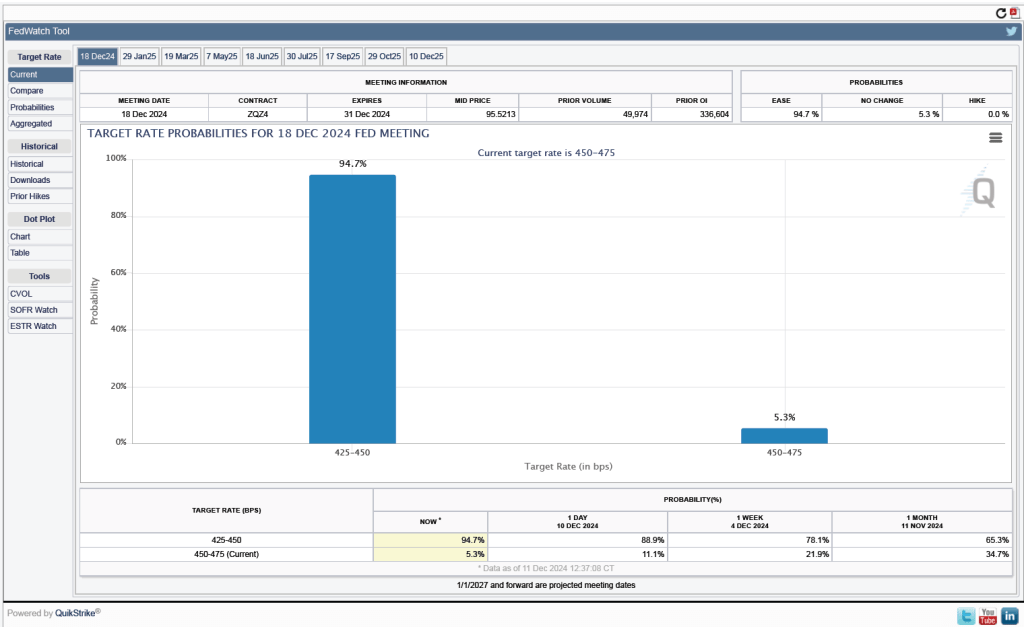
Will this persistence in inflation above the Fed’s 2 percent target cause the FOMC to hold constant its target range for the federal funds rate? Investors who buy and sell federal funds futures contracts still expect that the FOMC will cut its target for the federal funds rate by 0.25 percentage point at its next meeting on December 17-18. (We discuss the futures market for federal funds in this blog post.) The following figure shows that today these investors assign a probability of 94.7 percent to the FOMC cutting its target for the federal funds rate by 0.25 percentage point and a probability of only 5.3 percent to the committee leaving its target unchanged at its current range of 4.50 percent to 4.75 percent.

An image generated by GTP-4o of people going to work.
The Federal Reserve’s policymaking Federal Open Market Committee (FOMC) has its next meeting on December 17-18. Although the committee is expected to lower its target range for the federal funds rate at that meeting, some members of the committee have been concerned that inflation has remained above the committee’s 2 percent annual target. For instance, in an interview on December 4, Fed Chair Jerome Powell said: “Growth is definitely stronger than we thought, and inflation is coming a little higher. The good news is that we can afford to be a little more cautious as we try to find [the] neutral [federal funds rate].”
This morning (December 6), the Bureau of Labor Statistics (BLS) released its “Employment Situation” report (often called the “jobs report”) for November. The report provided data indicating that the labor market remained strong—perhaps stronger than is consistent with the FOMC being willing to rapidly cut its federal funds rate target. The data in the October report (which we discussed in this blog post) were distorted by the effects of hurricanes and strikes. Today’s report indicated a bounce back in the labor market as many workers in areas affected by hurricanes returned to work and key strikes ended.
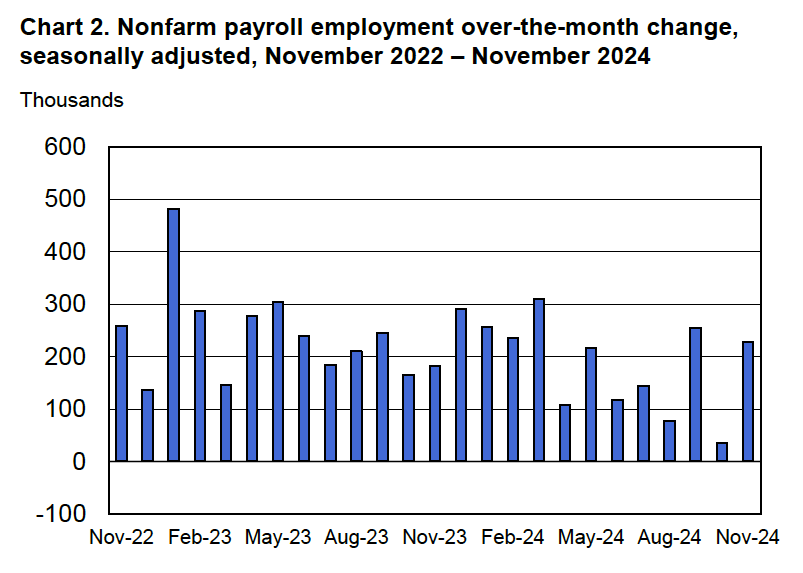
Economists who had been surveyed by the Wall Street Journal had forecast that payroll employment, as reported in the establishment survey, would increase by 214,000. The BLS reported that payroll employment in November had increased by 227,000, slightly above expectations. The unemployment rate—which is calculated from data in the household survey—was 4.2 percent, up slightly from 4.1 percent in October. In addition, the BLS revised upward its estimates of the employment increases in September and October by a total of 56,000. (The BLS notes that: “Monthly revisions result from additional reports received from businesses and government agencies since the last published estimates and from the recalculation of seasonal factors.”) The following figure, taken from the BLS report, shows the net changes in employment for each month during the past two years.
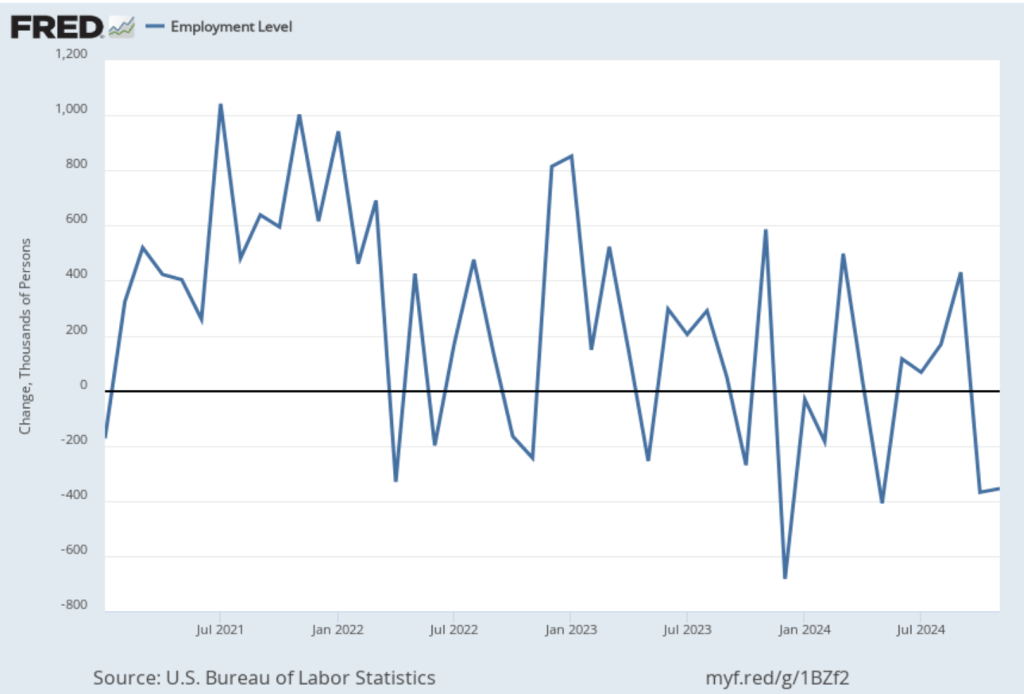
As the following figure shows, the net change in jobs from the household survey moves much more erratically than does the net change in jobs from the establishment survey. The net change in jobs as measured by the household survey for November was a decline of 355,000 jobs following a decline of 368,000 jobs in October. So, the story told by the two surveys is somewhat at odds, with a solid employment gain in the establishment survey contrasted with a significant employment decline in the household survey. (In this blog post, we discuss the differences between the employment estimates in the household survey and the employment estimates in the establishment survey.)
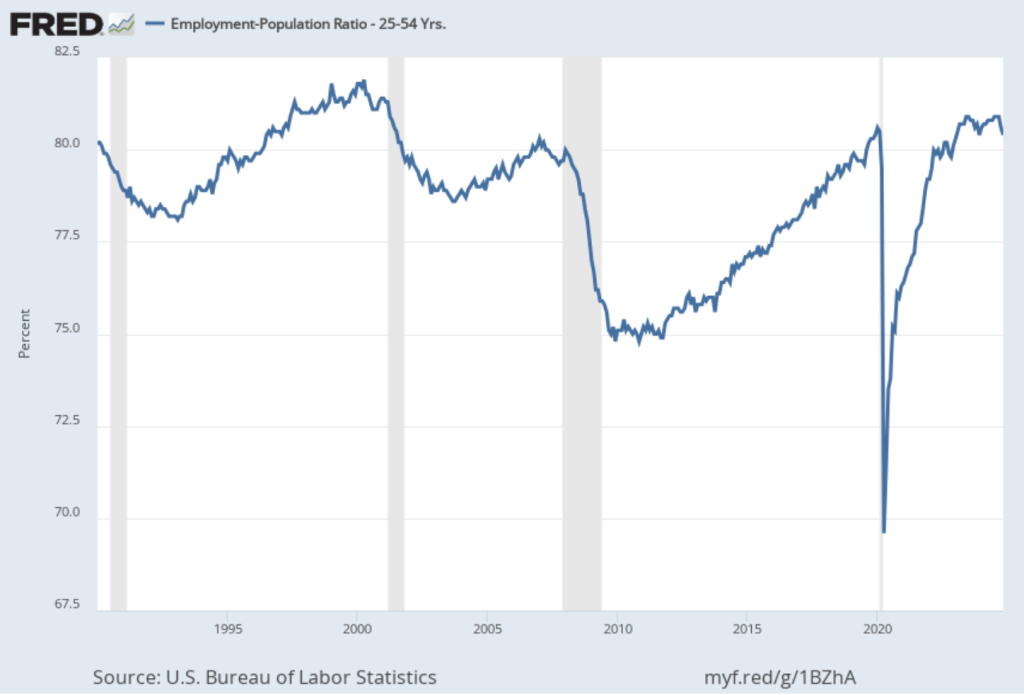
The employment-population ratio for prime age workers—those aged 25 to 54—also declined, as shown in the following figure, to 80.4 percent in November from 80.6 percent in October. Although this was the second consecutive month of decline, the employment-population ratio remained high relative to levels seen since 2001.
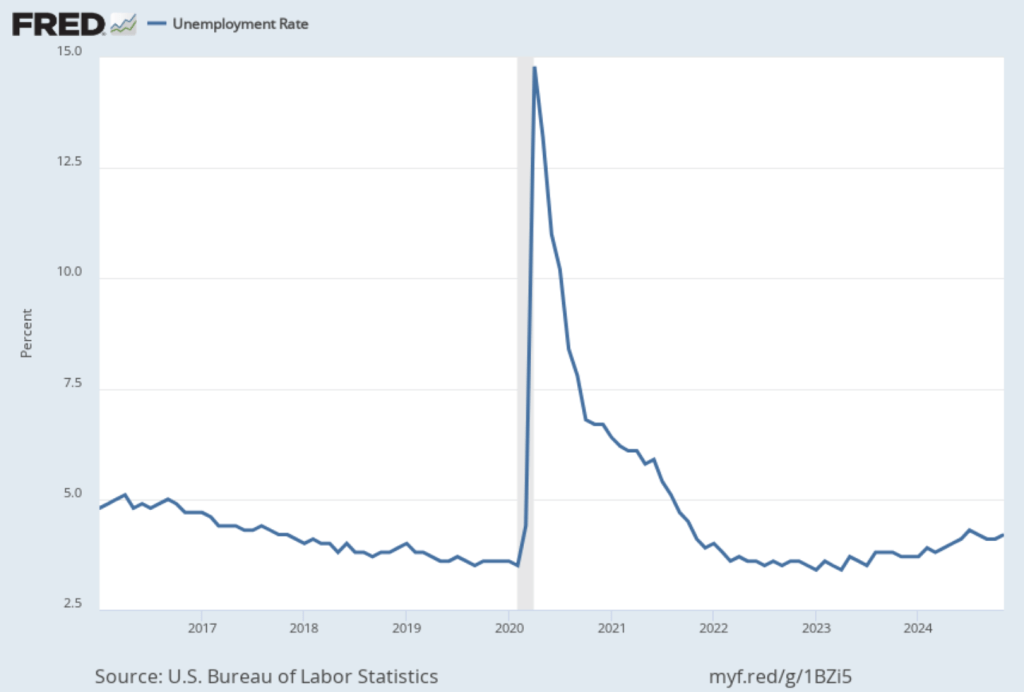
As the following figure shows, the unemployment rate, which is also reported in the household survey, increased slightly to 4.2 percent in November from 4.1 percent in October. The unemployment is still below its recent high of 4.3 percent in July.
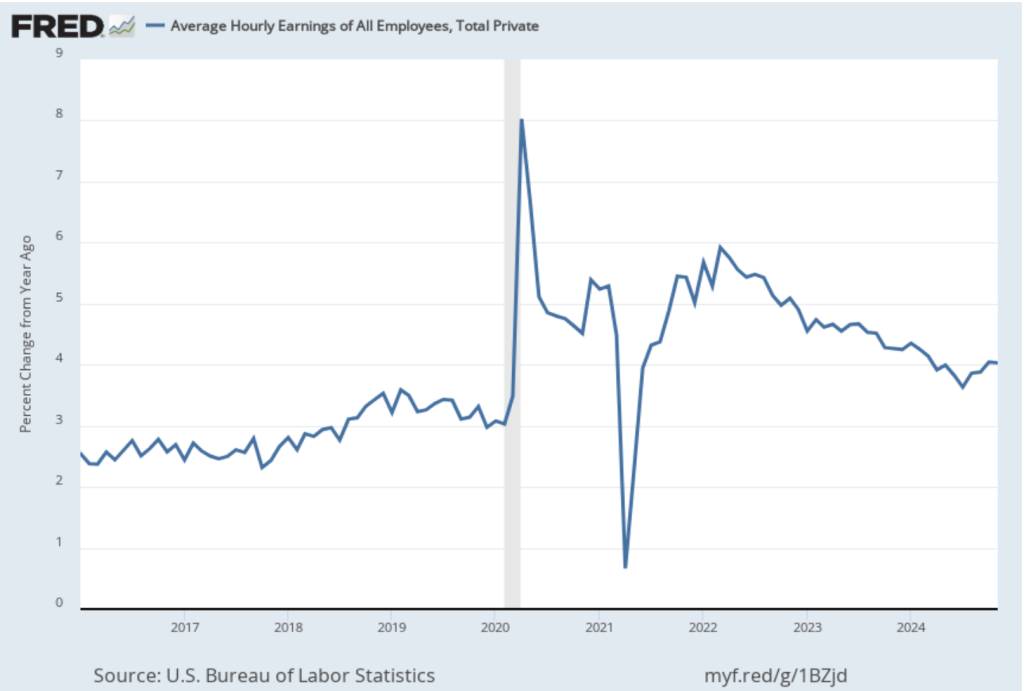
The establishment survey also includes data on average hourly earnings (AHE). As we noted in this post, many economists and policymakers believe the employment cost index (ECI) is a better measure of wage pressures in the economy than is the AHE. The AHE does have the important advantage that it is available monthly, whereas the ECI is only available quarterly. The following figure shows the percentage change in the AHE from the same month in the previous year. The AHE increased 4.0 percent in November, the same as in October.
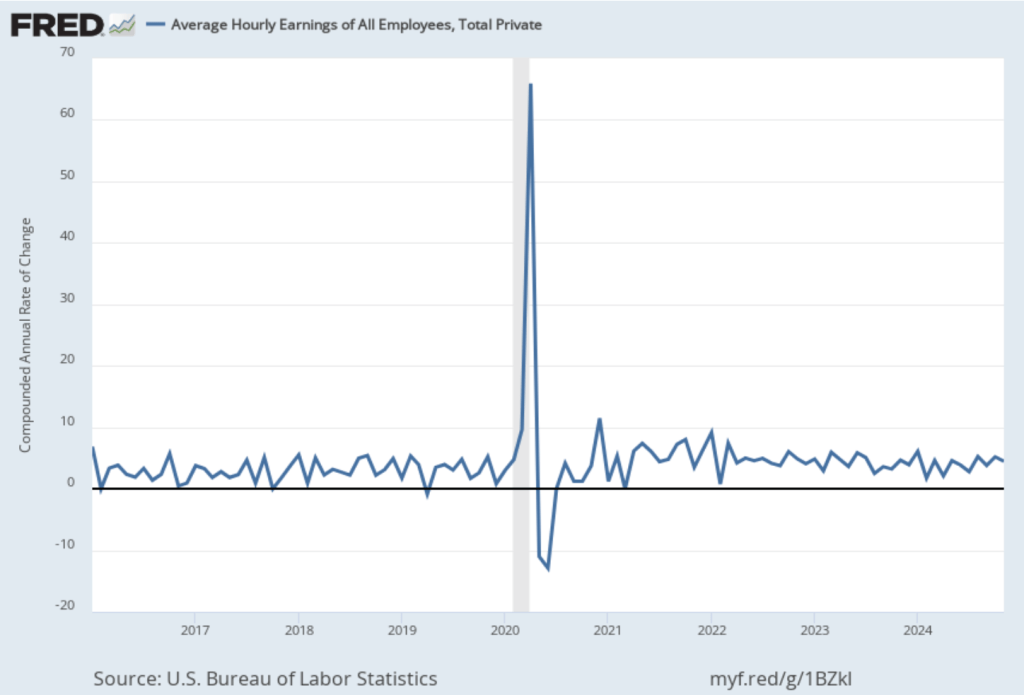
The following figure shows wage inflation calculated by compounding the current month’s rate over an entire year. (The figure above shows what is sometimes called 12-month wage inflation, whereas this figure shows 1-month wage inflation.) One-month wage inflation is much more volatile than 12-month wage inflation—note the very large swings in 1-month wage inflation in April and May 2020 during the business closures caused by the Covid pandemic.
The November 1-month rate of wage inflation was 4.5 percent, a decline from the 5.2 percent rate in October. Whether measured as a 12-month increase or as a 1-month increase, AHE is still increasing more rapidly than is consistent with the Fed achieving its 2 percent target rate of price inflation.
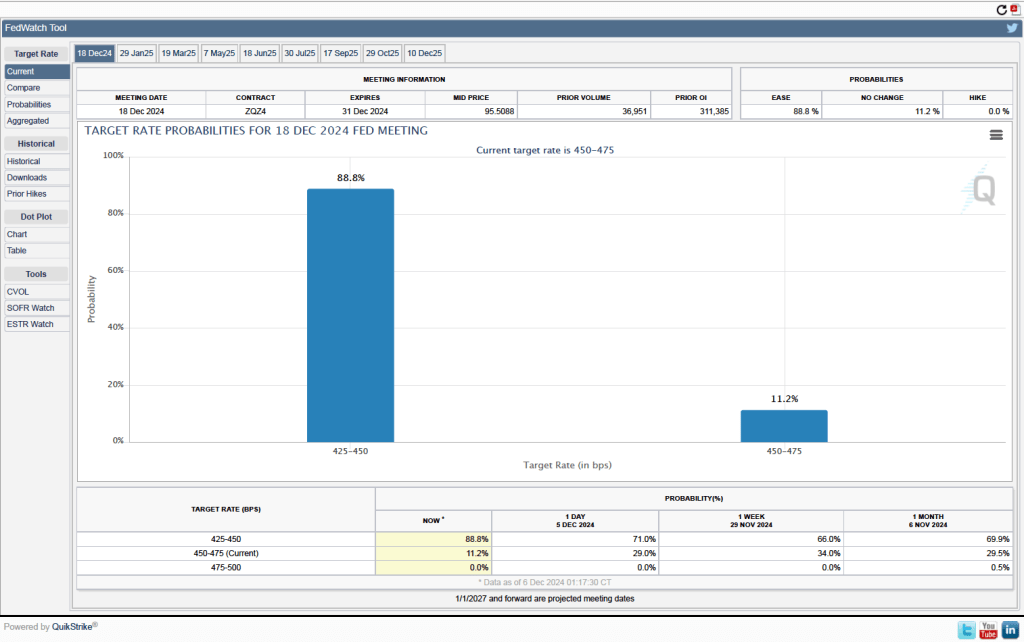
Given these data from the jobs report, is it likely that the FOMC will reduce its target range for the federal funds rate at its next meeting? One indication of expectations of future rate cuts comes from investors who buy and sell federal funds futures contracts. (We discuss the futures market for federal funds in this blog post.) As shown in the following figure, today these investors assign a probability of 88.8 percent to the FOMC cutting its target range for the federal funds rate by 0.25 percentage point (25 basis points) from the current range of 4.50 percent to 4.75 percent, at its next meeting. Investors assign a probability of only 11.2 percent of the committee leaving its target range unchanged.
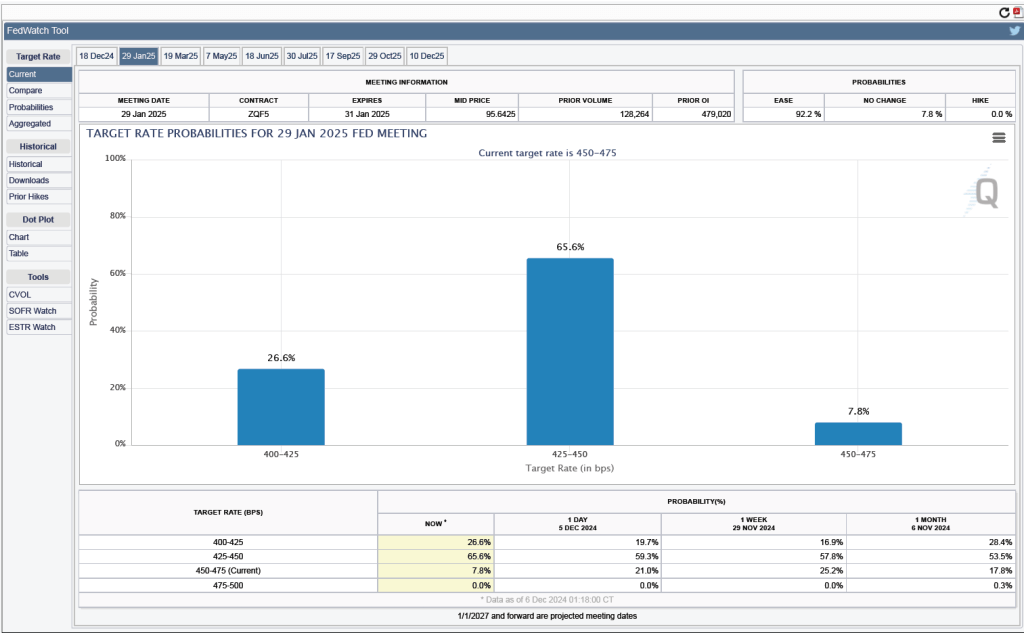
What do investors expect will happen at the next FOMC meeting after the December 17-18 meeting, which will occur on January 28-29, 2025? As of today, investors assing a probability of only 26.5 percent that the committee will set its target range at 4.00 percent to 4.25 percent, or 50 basis points, below the current target. In other words, only a minority of investors are expecting the committee to cut its target range at both its December and January meetings.

An image generated by GTP-4o of people shopping
This morning (November 27), the BEA released monthly data on the personal consumption expenditures (PCE) price index as part of its “Personal Income and Outlays” report for October. The Fed relies on annual changes in the PCE price index to evaluate whether it’s meeting its 2 percent annual inflation target. This month’s data indicates that progress towards the Fed’s target may have stalled.
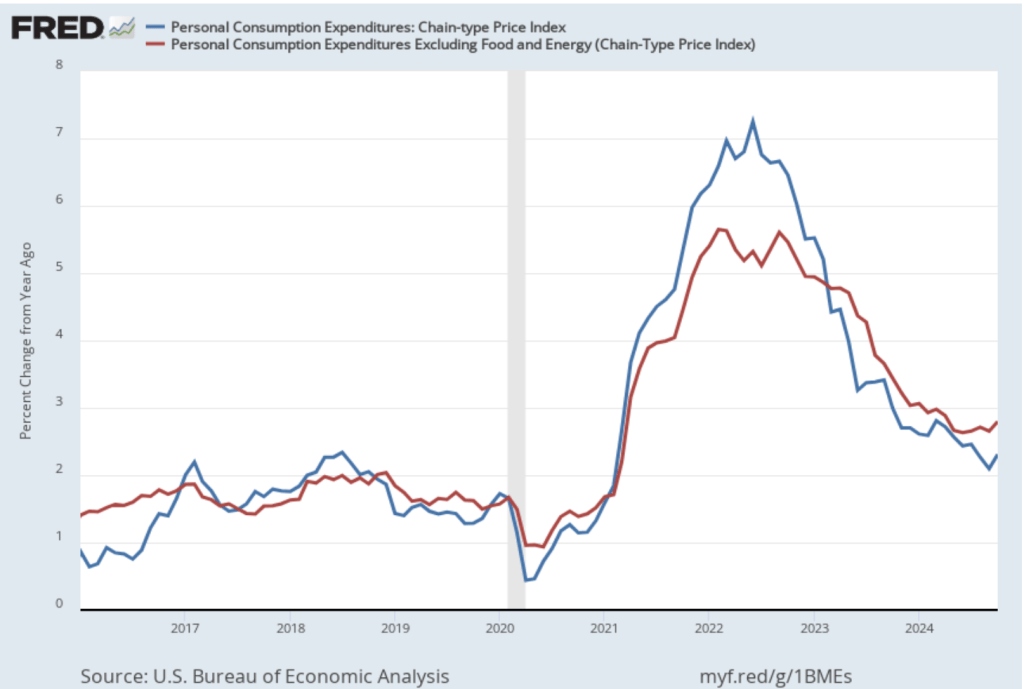
The following figure shows PCE inflation (blue line) and core PCE inflation (red line)—which excludes energy and food prices—for the period since January 2016 with inflation measured as the percentage change in the PCE from the same month in the previous year. Measured this way, in October, PCE inflation (the blue line) was 2.3 percent, up from 2.1 percent in September. Core PCE inflation (the red line) in October was 2.8 percent, up from 2.7 percent in September. Both PCE inflation and core PCE inflation were in accordance with the expectations of economists surveyed.
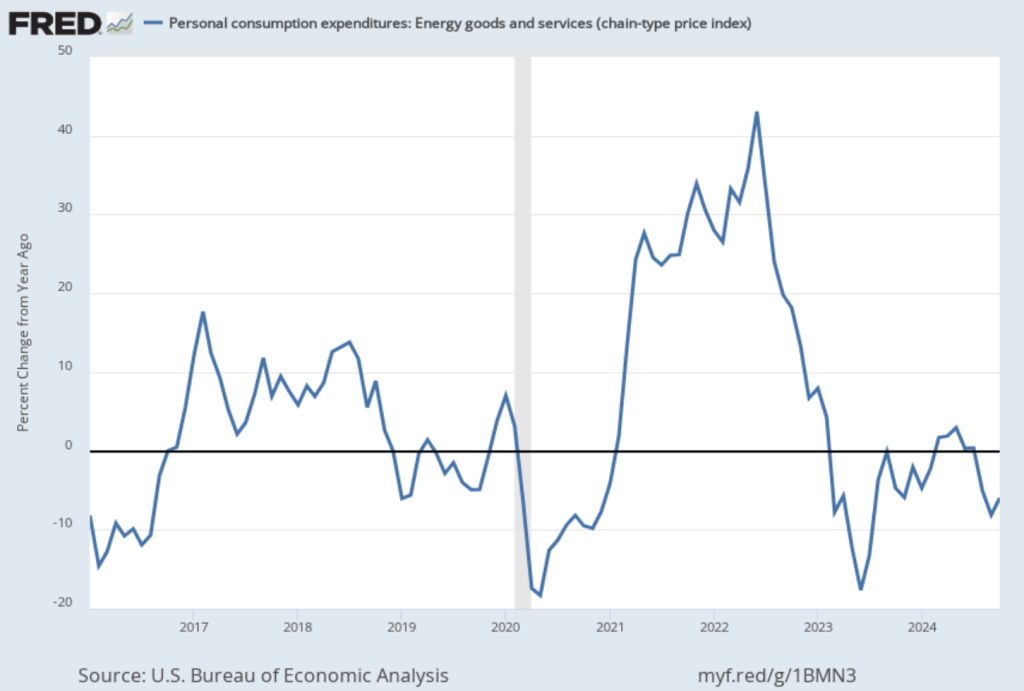
One reason that PCE inflation has been lower than core PCE inflation in recent months is that PCE inflation has been held down by falling energy prices, as shown in the following figure. Energy prices have been falling over the last three months and were down 5.9 percent in October. It seems unlikely that falling energy prices will persist.
The following figure shows PCE inflation and core PCE inflation calculated by compounding the current month’s rate over an entire year. (The figure above shows what is sometimes called 12-month inflation, while this figure shows 1-month inflation.) Measured this way, PCE inflation rose in October to 2.9 percent from 2.1 percent in September. Core PCE inflation rose from 3.2 percent in September to 3.3 percent in October. Because core inflation is generally a better measure of the underlying trend in inflation, both 12-month and 1-month core PCE inflation indicate that inflation may still run well above the Fed’s 2 percent target in coming months. But the usual caution applies that data from one month shouldn’t be overly relied on.
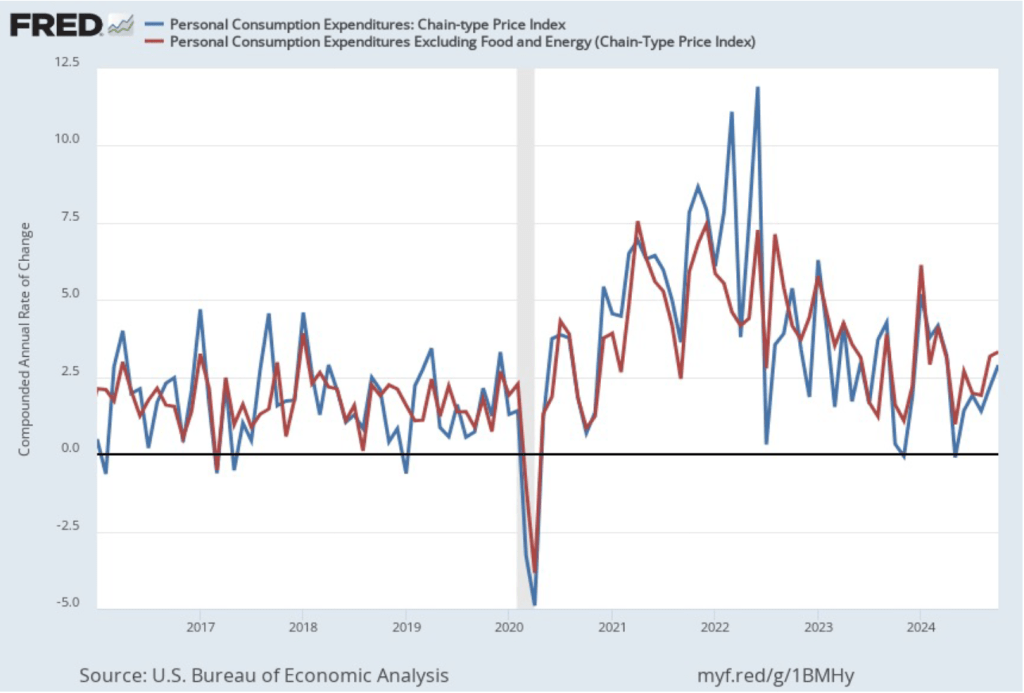
The following figure shows other ways of gauging inflation by including the 12-month inflation rate in the PCE (the same as shown in the figure above—although note that PCE inflation is now the red line rather than the blue line), inflation as measured using only the prices of the services included in the PCE (the green line), and core inflation, excluding the price of housing services as well as the prices of food and energy (the blue line). Fed Chair Jerome Powell and other members of the Federal Open Market Committee (FOMC) have said that they are concerned by the persistence of elevated rates of inflation in services and in housing.
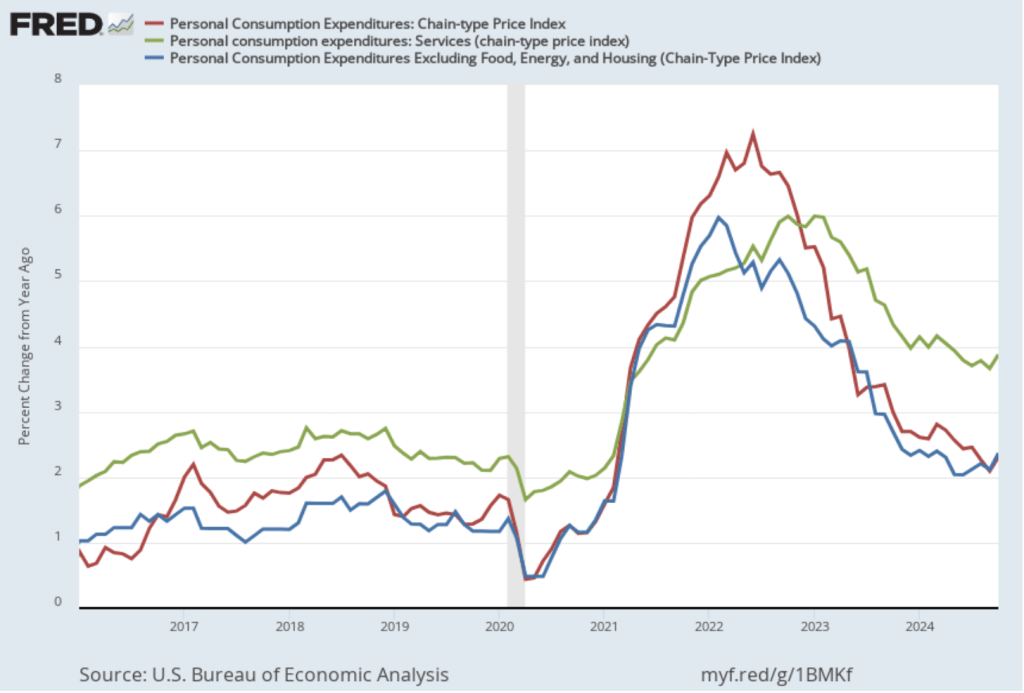
Inflation in services remained high, increasing from 3.7 percent in September to 3.9 percent in October. Core inflation, measured by excluding housing as well as food and energy, increased from 2.1 percent in September to 2.4 percent in October.
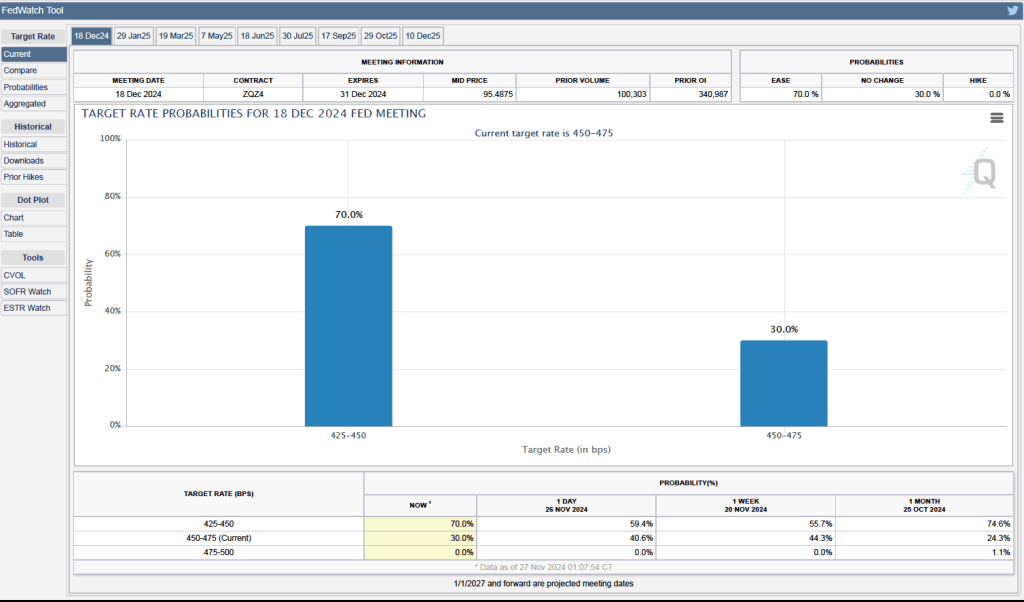
Some Fed watchers have suggested that higher inflation readings may lead he Fed’s policymaking Federal Open Market Committee (FOMC) to leave its target for the federal funds rate unchanged at its next meeting on December 17-18. As of today, however, investors who buy and sell federal funds futures contracts are still expecting that the FOMC will reduce its target by 0.25 percent (25 basis points) at its next meeting. (We discuss the futures market for federal funds in this blog post.) As shown in the following figure, investors assign a probability of 70 percent to the FOMC cutting its target for the federal funds rate from the current range of 4.50 percent to 4.75 percent to a range of 4.25 percent to 4.50 percent. Investors assign a probability of only 30 percent to the FOMC leaving its target unchanged.
Since the FOMC began increasing the target for the federal funds rate in the spring of 2022, economists have discussed three possible outcomes of the Fed’s monetary policy:
With GDP and employment data showing no indication that a recession will begin soon and with today’s data showing inflation—while having declined substantially from its mid-2022 peak—remaining above the Fed’s 2 percent target, the chances of the no landing outcome seem to be increasing.

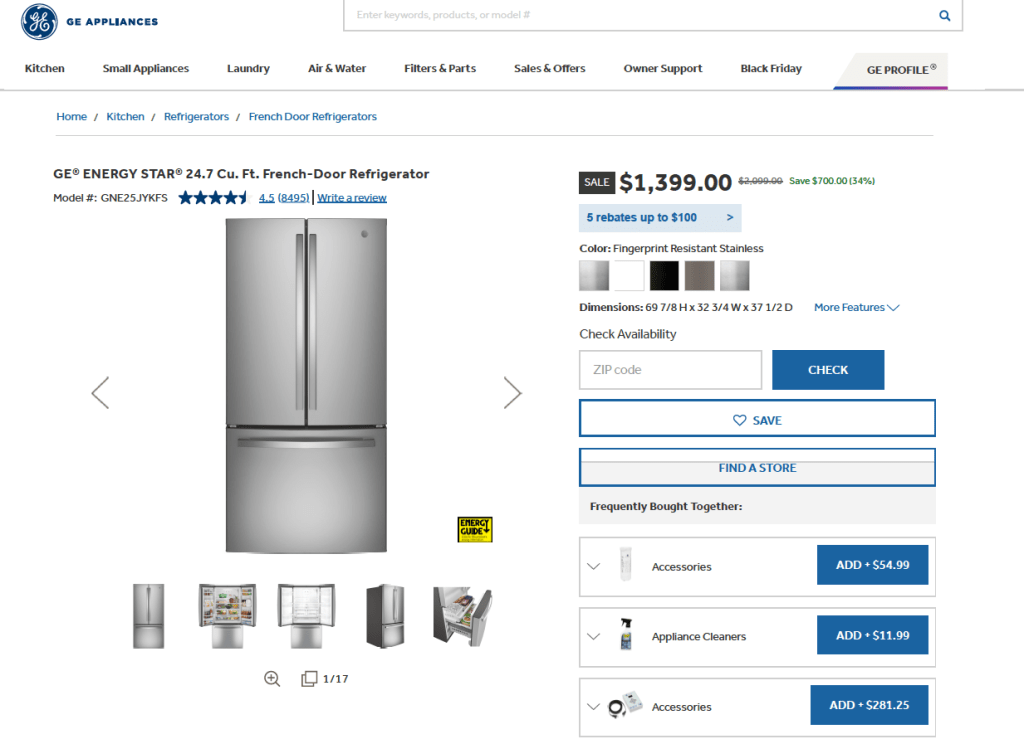
Consumer Reports is a magazine and web site devoted to product reviews. Their November-December 2024 issue noted something unusual about the two GE refrigerators shown above. (The images are from the geappliances.com web site.) At the time the issue was printed, the first refrigator above had a price of $2,300 and the second refrigerator had a price of $1,300: Consumer Reports notes that:
“These look-alike fridges offer equally impressive performance, have the same interior features … and are from the same brand. So why the $1,000 price difference? We don’t know.”
(Note: GE referigators, and many other products branded with the GE name are no longer produced by the General Electric company, which dates back to 1892 and was co-founded by Thomas Edison. Today, GE is primarily an aerospace company and GE appliances are produced by the Chinese-owned Haier Smart Home Company.)
If we assume that Consumer Reports is correct and the two refrigerators are identical, what strategy is the firm pursuing by charging different prices for the same product? As we discuss in Microeconomics, Chapter 15, Section 15.5 firms can increase their profits by practicing price discrimination—charging different prices to different customers. To pursue a strategy of price discrimination the firm needs to be able to divide up—or segment—the market for its refrigerators.
Firms sometimes use a high price to signal quality. The old saying “you get what you pay for” can lead some consumers to expect that when comparing two similar goods, such as two models of refrigerators, the one with the higher price also has higher quality. In the appliance section of a large store, such as Lowe’s or the Home Depot, or online at Amazon or another site, you will have a wide variety of refrigerators to choose from. You may have trouble evaluating the features each model offers and be unable to tell whether a particular model is likely to be more or less reliable. So, if you are choosing between the two GE models shown above, you may decide to choose the one with the higher price because the higher price may indicate that the components used are of higher quality.
In this case, GE may be relying on a segmentation in the market between consumers who carefully research the features and the quality of the refrigerators that different firms offer for sale and those consumers don’t. The consumers who do careful research and are aware of all the features of each model may be more sensitive to the price and, therefore, have a high price elasticity of demand. The consumers who haven’t done the research may be relying on the price as a signal of quality and, therefore, have a lower price elasticty of demand.
If what we have just outlined was the firm’s strategy for increasing profit by charging different prices for two models that are, apparently, either identical or very similar, it doesn’t seem to have worked. Note that the model shown in the first photo above is the one that had a price of $2,300 when Consumer Reports wrote about it, but now has a price of $1,154.40. The model shown in the second photo had a price of $1,300, but now has a price of $1,399.00. In other words, the model that had the lower price now has the higher price and the model that had the higher price now has the lower price.
What happened between the time the issue of Consumer Reports published and now? We might conjecture that there are few consumers who would be likely to pay $1,000 more for a refrigator that seems to have the same features as another model from the same company. In other words, segmenting consumers in this way seems unlikely to succeed. Why, though, the firm decided to make its formerly higher-price model its lower-price model, is difficult to explain without knowing more about the firm’s pricing strategy.

Image generated by GTP-4o of someone in Germany working on a spreadsheet
Supports: Macroeconomics, Chapter 18, Section 18.2; and Economics, Chapter 28, Section 28.2.
A column in the New York Times made the following observations:
“The greenback has been climbing since Trump’s victory, a potential drag on multinationals’ profits. Elsewhere, the yield on the closely watched 10-year Treasury note ticked higher again on Tuesday ….”
Solving the Problem
Step 1: Review the chapter material. This problem is about the effect of changes in the ex-change rate, so you may want to review the section “The Foreign Exchange Market and Exchange Rates.”
Step 2: Answer part (a) by explaining what a greenback is and what it means to say that the greenback is climbing. “Greenback” is a slang term for the U.S. dollar because the back of U.S. currency is printed in green ink. The “greenback climbing” means that the U.S. dollar is increasing in value relative to other currencies—in other words, the exchange rate is increasing.
Step 3: Answer part (b) by explaining whether there is a connection between the value of the U.S. dollar increasing as the interest rate on the 10-year U.S. Treasury note is increasing. There is a connection: Higher interest rates in the United States will make investing in U.S. financial securities, such as Treasury notes, more attractive to foreign investors. Foreign investors will increase their demand for dollars, increasing the equilibrium exchange rate.
Step 3: Answer part (c) by explaining why an increase in the value of the greenback will affect the profits of U.S. multinational corporations. A U.S. multinational firm, such as Microsoft or Apple, will have operations in other countries. When, for instance, Microsoft sells access to its Office Suite to customers in France of Germany, the customers pay in euros. If the value of the dollar has risen in exchange for euros, when Microsoft converts the euros into dollars it receives fewer dollars, thereby reducing its profits.

Image showing scientific research generated by GTP-4o
Note: The following op-ed first appeared in the Wall Street Journal.
The Trump Economic Awakening
Traditional policies like tax cuts, targeted aid and responsible spending can deliver stronger growth.
Political scientists will debate the forces that shaped Donald Trump’s victory, but one thing is clear: Americans yearn for a change in economic policy. Voters have rejected the interventionist policies that brought inflation and high deficits. They want an economic awakening, a new way forward that uses traditional economic policies to achieve Mr. Trump’s goal of more jobs for Americans whose fortunes have been harmed by technological change and globalization.
Any economic path to a successful awakening begins with growth: the engine that powers individual income and our collective ability to support the nation’s defense, economy, education and healthcare industry. To pursue this growth, the new administration should consider at least three measures:
First, by working with Congress, it should build on the successes of the Tax Cuts and Jobs Act of 2017 to make permanent the expensing of business investment. Second, it should increase support for science and defense research, which would have significant spillover to the commercial sector, particularly in space exploration. Third, it should build on this research by constructing applied research centers around the country, linked to regional university and city hubs. Like the land-grant colleges of the 19th century, these centers would generate and distribute knowledge, improving local capabilities in manufacturing and services.
Opportunity is also a pillar of the awakening. Community colleges are an underfunded source of skill-building and mobility. As Austan Goolsbee, Amy Ganz and I proposed in a 2019 report, a modest federal block grant to support community colleges on the supply side—rather than a demand-side emphasis on financial aid—can help these schools push more Americans toward better jobs by working with local employers on skill needs and curriculum development. Targeted aid to places with depressed economic activity can help distribute opportunity to communities better than one-size-fits-all Washington-directed programs.
Corporate tax reform can play a role, too, by improving incentives for companies to settle and invest in the U.S. This can magnify opportunities for Americans, all without having to rely on costly tariffs.
Working a job doesn’t merely generate income; it also promotes human dignity. Enlisting more people into the workforce is thus another element of the economic-policy awakening. While growth and opportunity policies can boost labor-force participation, strengthening the earned-income tax credit to boost the incomes of childless workers can help attract younger people to the workforce. Maintaining the child tax credit can also provide parents with easier pathways toward economic participation.
These ideas share several important themes with Mr. Trump’s campaign and the traditional conservative playbook. They emphasize that policy ideas should be practical and workable, not merely rhetorical. Each makes use of America’s federalist system and innovative ethos. Making a priority of strong local involvement in applied research centers and community colleges and as tailoring place-based aid are more effective approaches than Washington diktats. Programs need to be held accountable for results, not simply allocated money.
This economic-policy awakening requires a clear-eyed assessment of budget trade-offs. Profligate spending with little regard for debt and inflation—à la the American Rescue Plan—contributed to Mr. Trump’s victory. It is possible to accomplish the steps above in a fiscally responsible way by offsetting spending and tax changes.
Organizing for the policy awakening’s success will be essential. Lack of communication among cabinet agencies can stymie creative ideas for expanding the economic pie for American workers. Like the president’s Working Group on Financial Markets, created by Ronald Reagan in 1988 to convene disparate agencies, the new administration would benefit from a senior executive team that can coordinate economic ideas and learn from leaders in business, labor and social services. Such a body, unlike the National Economic Council, could more adeptly cut across silos related to tax, trade, regulatory and industrial policy.
Voters have signaled they’re ready for an economic awakening. The president-elect, equipped with a new playbook and vision, should seize the opportunity.
Continue reading “Glenn on the Economic Policies Necessary to Increase Growth”
Image illustrating inflation generated by GTP-4o.
On November 13, the Bureau of Labor Statistics (BLS) released its monthly report on the consumer price index (CPI). The following figure compares headline inflation (the blue line) and core inflation (the red line).
Both headline inflation and core inflation were the values that economists surveyed by the Wall Street Journal had expected.
In the following figure, we look at the 1-month inflation rate for headline and core inflation—that is the annual inflation rate calculated by compounding the current month’s rate over an entire year. Calculated as the 1-month inflation rate, headline inflation (the blue line) increased from 2.2 percent in September to 3.0 percent in October. Core inflation (the red line) fell from 3.8 percent in September to 3.4 percent in October.
Overall, considering 1-month and 12-month inflation together, the U.S. economy may still be on course for a soft landing—with the annual inflation rate returning to the Fed’s 2 percent target without the economy being pushed into a recession. However, progress on lowering inflation may have slowed or, possibly, stalled. The relatively high rates of core inflation in both the 12-month and 1-month measures are concerning because most economists believe that core inflation is a better indicator of the underlying inflation rate than is headline inflation. It’s important not to overinterpret the data from a single month, although this is the third month in a row that core inflation has been above 3 percent. (Note, that the Fed uses the personal consumption expenditures (PCE) price index, rather than the CPI in evaluating whether it is hitting its 2 percent inflation target.)
As we’ve discussed in previous blog posts, Federal Reserve Chair Jerome Powell and his colleagues on the Fed’s policymaking Federal Open Market Committee (FOMC) have been closely following inflation in the price of shelter. The price of “shelter” in the CPI, as explained here, includes both rent paid for an apartment or house and “owners’ equivalent rent of residences (OER),” which is an estimate of what a house (or apartment) would rent for if the owner were renting it out. OER is included in the CPI to account for the value of the services an owner receives from living in an apartment or house.
As the following figure shows, inflation in the price of shelter has been a significant contributor to headline inflation. The blue line shows 12-month inflation in shelter, and the red line shows 1-month inflation in shelter. Twelve-month inflation in shelter has been declining since the spring of 2023, but increased in October to 4.9 percent from 4.8 percent in September. One-month inflation in shelter—which is much more volatile than 12-month inflation in shelter—increased sharply from 2.7 percent in September to 4.7 percent in October.
Chair Powell and the other members of the FOMC have been expecting that the inflation in shelter would continue to decline. For instance, in his press conference following the last FOMC meeting on November 7, Powell stated that:
“What’s going on there is, you know, market rents, newly signed leases, are experiencing very low inflation. And what’s happening is older—you know, leases that are turning over are taking several years to catch up to where market leases are; market rent leases are. So that’s just a catch-up problem. It’s not really reflecting current inflationary pressures, it’s reflecting past inflationary pressures.”
The recent uptick in shelter inflation may concern FOMC members as they consider whether, and by how much, to cut their target for the federal funds rate at their next meeting on December 17-18. Bear in mind, though, that shelter has a weight of only 15 percent in the PCE price index that the Fed uses to gauge whether it is hitting its 2 percent inflation target in contrast with the 33 percent weight that shelter has in the CPI.
To better estimate of the underlying trend in inflation, some economists look at median inflation and trimmed mean inflation.
The following figure is from the Federal Reserve Bank of Cleveland. It shows that median inflation (the orange line) was unchanged in October at 4.1 percent. Trimmed mean inflation (the blue line) was also unchanged at 3.2 percent. These data provide confirmation that (1) core CPI inflation at this point is likely running at least slightly higher than a rate that would be consistent with the Fed achieving its inflation target and (2) that progress toward the target has slowed.

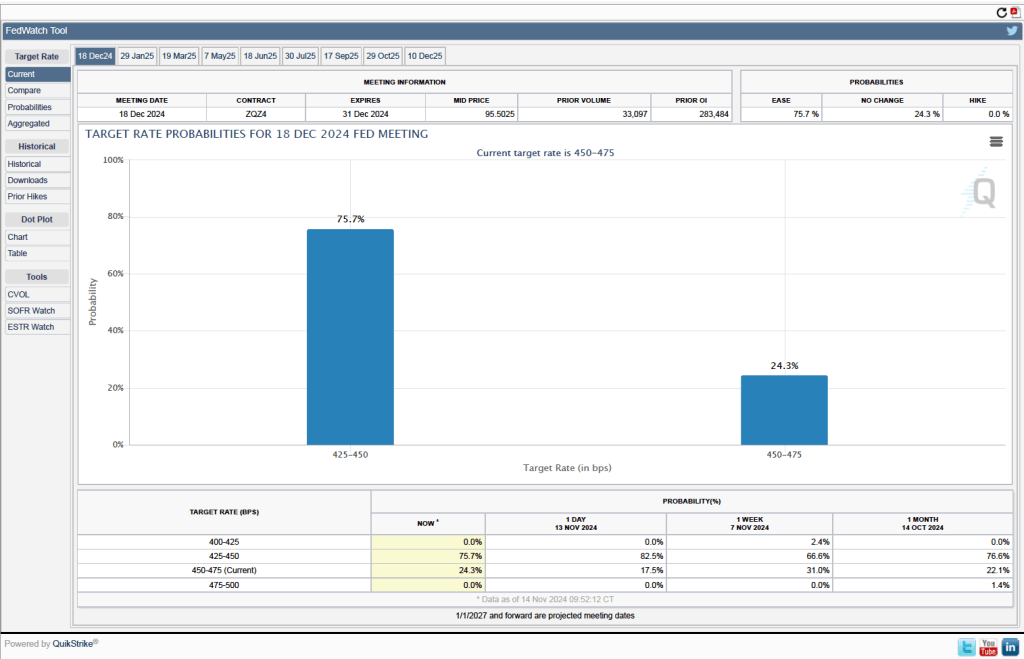
Will this persistence in inflation above the Fed’s 2 percent target cause the FOMC to hold constant its target range for the federal funds rate? Investors who buy and sell federal funds futures contracts expect that the FOMC will cut still cut its target for the federal funds rate by 0.25 percentage point at its December meeting. (We discuss the futures market for federal funds in this blog post.) The following figure that today these investors assign a probability of 75.7 percent to the FOMC cutting its target for the federal funds rate by 0.25 percentage point and a probability of 24.3 percent to the committee leaving its target unchanged at a range of 4.50 percent to 4.75 percent.