
As we discussed in this post, most recent data are consistent with the labor market having cooled, which should reduce upward pressure on wages and prices. On Friday morning, the Bureau of Labor Statistics (BLS) released its employment report for August 2023. (The report can be found here.) On balance, the data in the report are consistent with the labor market continuing to cool.
Data from the establishment survey showed an increase in payroll employment of 187,000, which is close to the increase of 170,000 economists surveyed by the Wall Street Journal had forecast. The following figure shows monthly changes in payroll employment since January 2021.
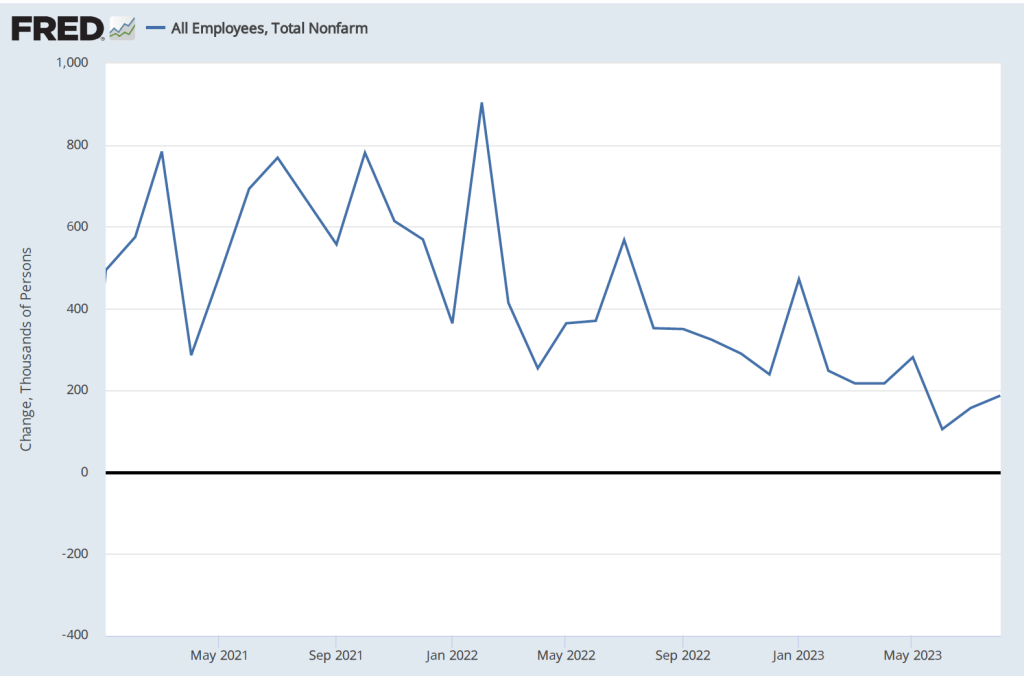
Although the month-to-month changes have been particularly volatile during this period as the U.S. economy recovered from the Covid–19 recession, the general trend in job creation has been downward. The following table shows average monthly increases in payroll employment for 2021, 2022, and 2023 through August. In the most recent three-month period, the average monthly increase in employment was 150,000.
| Period | Average Monthly Increases in Employment |
| 2021 | 606,000 |
| 2022 | 399,000 |
| Jan.-Aug. 2023 | 236,000 |
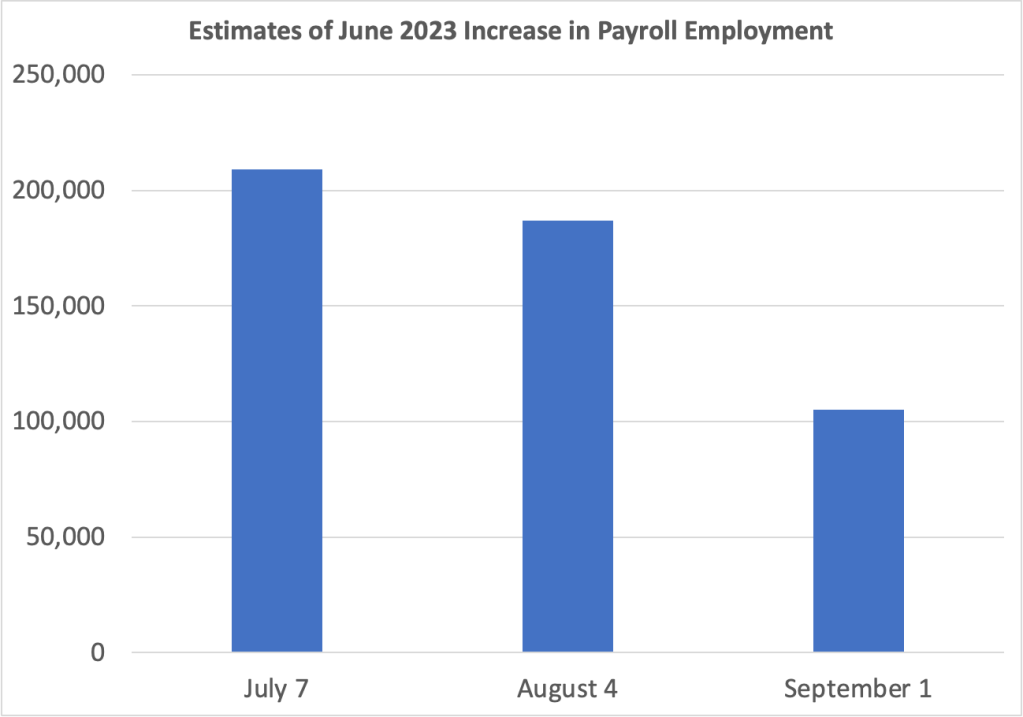
The BLS revised downward its previous estimates of employment increases in June and July by a combined 110,000. The changes to the estimate of the employment increase for June are particularly notable. As the following graph shows, on July 7, the BLS initially estimated the increase as 209,000. The BLS’s first revision on August 4, lowered the estimate to an increase of 187,000. The BLS’s second revision on September 1, lowered the estimate further to 105,000. In other words, the BLS now estimates that employment increased by only half as much in June as it initially reported. As we discuss in Macroeconomics, Chapter 9, Section 9.1 (Economics, Chapter 19, Section 19.1 and Essentials of Economics, Chapter 13, Section 13.1), the revisions that the BLS makes to its employment estimates are likely to be particularly large when the economy is about to enter a period of significantly lower or higher growth. So, the large revisions to the June employment estimate may indicate that during the summer economic growth slowed and labor market conditions eased.
Data from the household survey showed the unemployment rate increasing from 3.5 percent in July to 3.8 percent in August. The following figure shows that the unemployment rate has fluctuated in a narrow range since March 2022. Employment as estimated from the household survey increased by 222,000. The seeming paradox of the number of people employed and the unemployment rate both increasing is accounted for by the substantial 736,000 increase in the labor force.

Finally, as the first of the following figures shows, measured as the percentage change from the same month in the previous year, the increase in average hourly earnings (AHE) remained in its recent range of between 4.25 and 4.50 percent. That rate is down from its peak in mid-2022 but still above the rate of increase in 2019, before the pandemic. But, as the second figure shows, if we look at the compound rate of increase in AHE—that is the rate at which AHE would increase for the year if the current rate of monthly increase persisted over the following 11 months—we can see a significant cooling in the rate at which wages are increasing.


As a reminder, AHE are the wages and salaries per hour worked that private, nonfarm businesses pay workers. AHE don’t include the value of benefits that firms provide workers, such as contributions to 401(k) retirement accounts or health insurance. As an economy-wide average they suffer from a composition effect during periods in which employment either increases or decreases substantially because the mix of high-wage and low-wage workers may change. AHE are also subject to significant revisions. Therefore, short-range changes in AHE can sometimes be misleading indicators of the state of the labor market.
