On September 27, the Bureau of Economic Analysis (BEA) released its “Personal Income and Outlays” report for August, which includes monthly data on the personal consumption expenditures (PCE) price index. Inflation as measured by annual changes in the consumer price index (CPI) receives the most attention in the media, but the Federal Reserve looks instead to inflation as measured by annual changes in the PCE price index to evaluate whether it’s meeting its 2 percent annual inflation target.
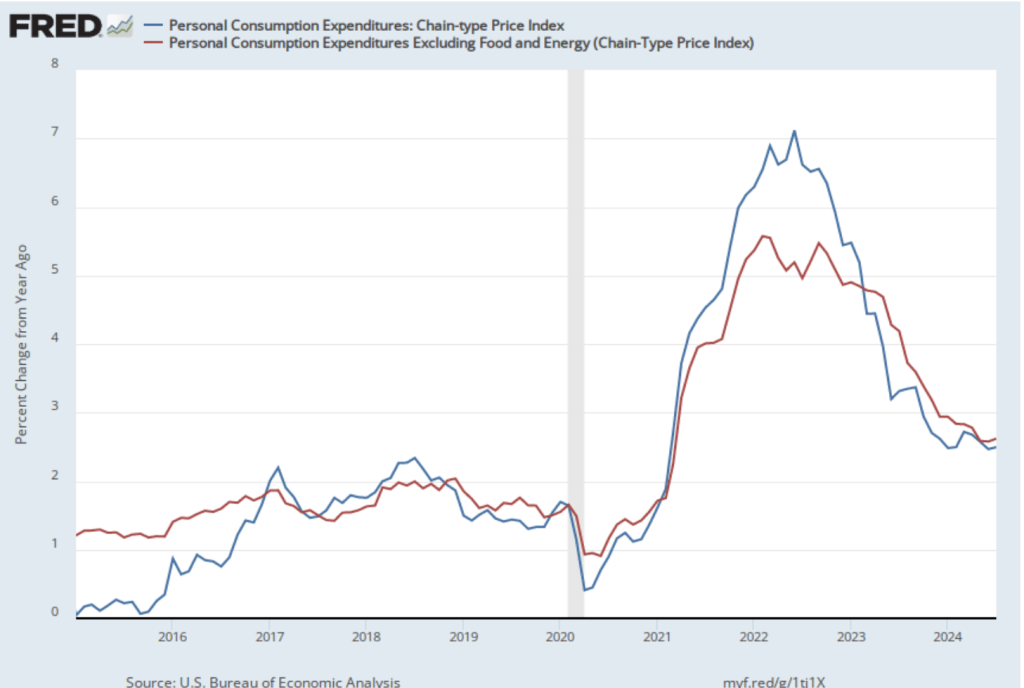
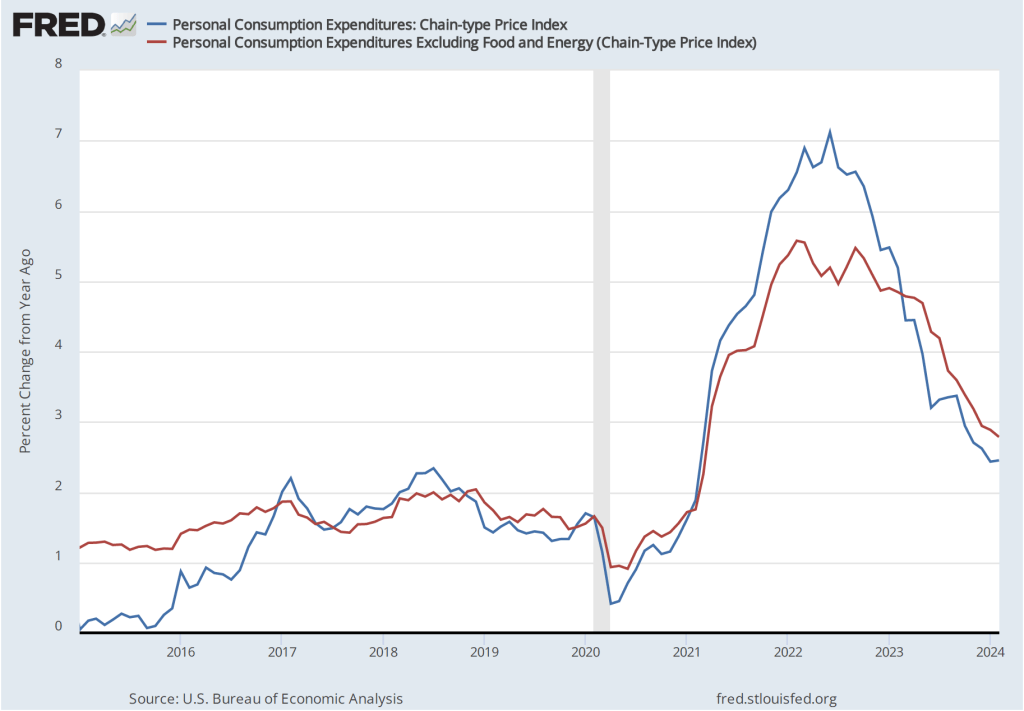
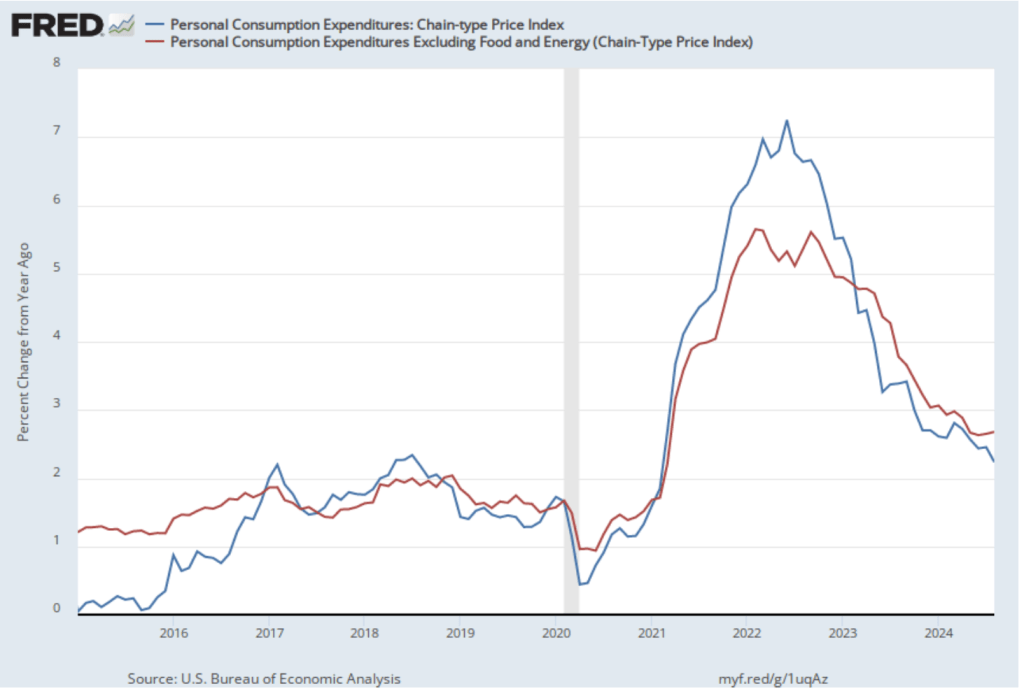
The following figure shows PCE inflation (blue line) and core PCE inflation (red line)—which excludes energy and food prices—for the period since January 2015 with inflation measured as the percentage change in the PCE from the same month in the previous year. Measured this way, PCE inflation (the blue line) was 2.2 percent in August, down from 2.7 percent in July. Core PCE inflation (the red line) ticked up in August to 2.7 percent from 2.6 percent in July.
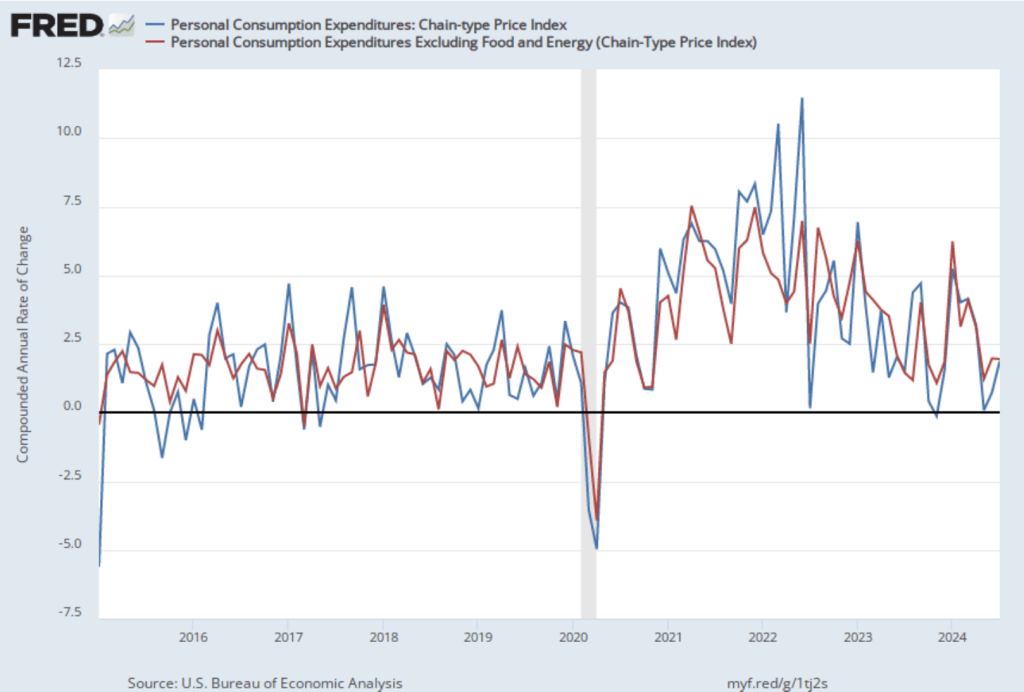
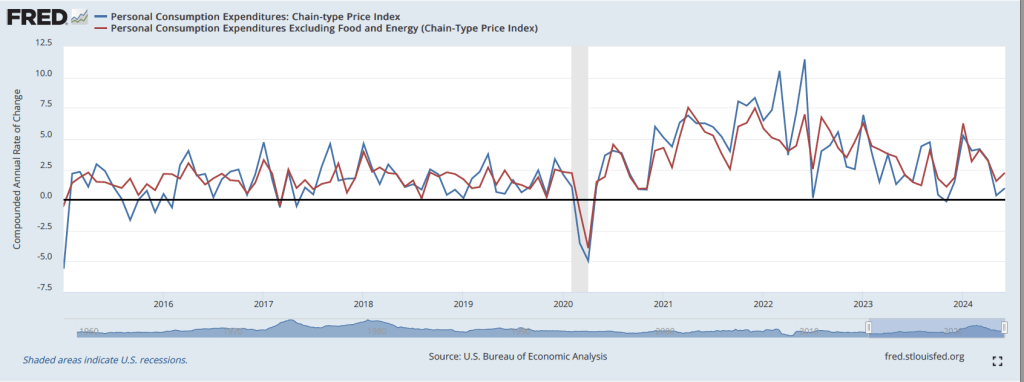
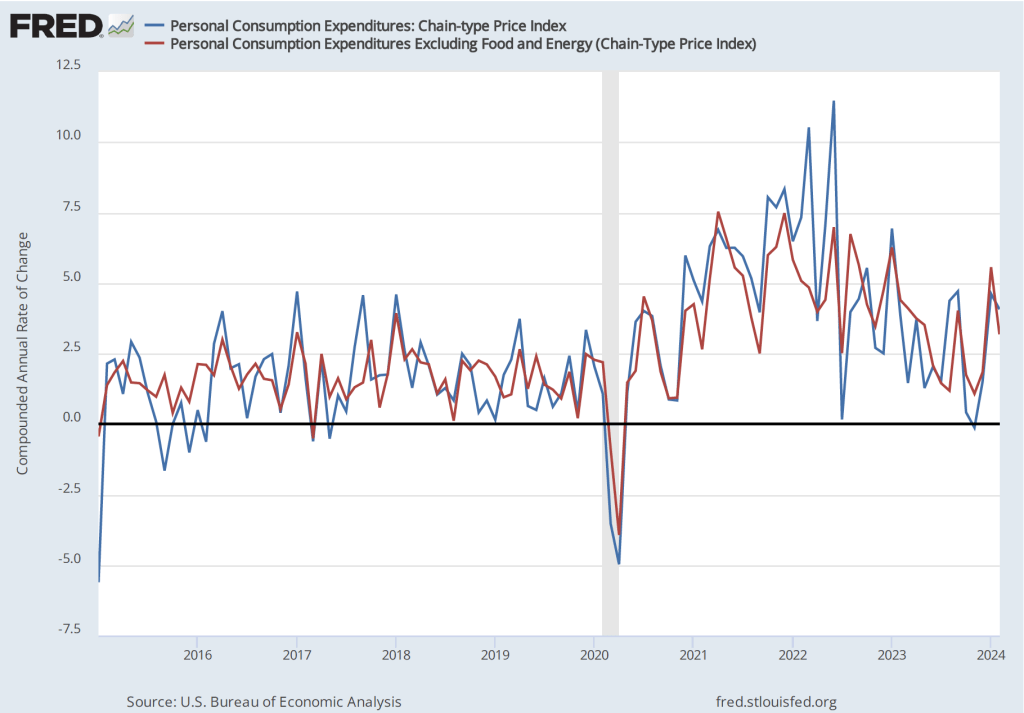
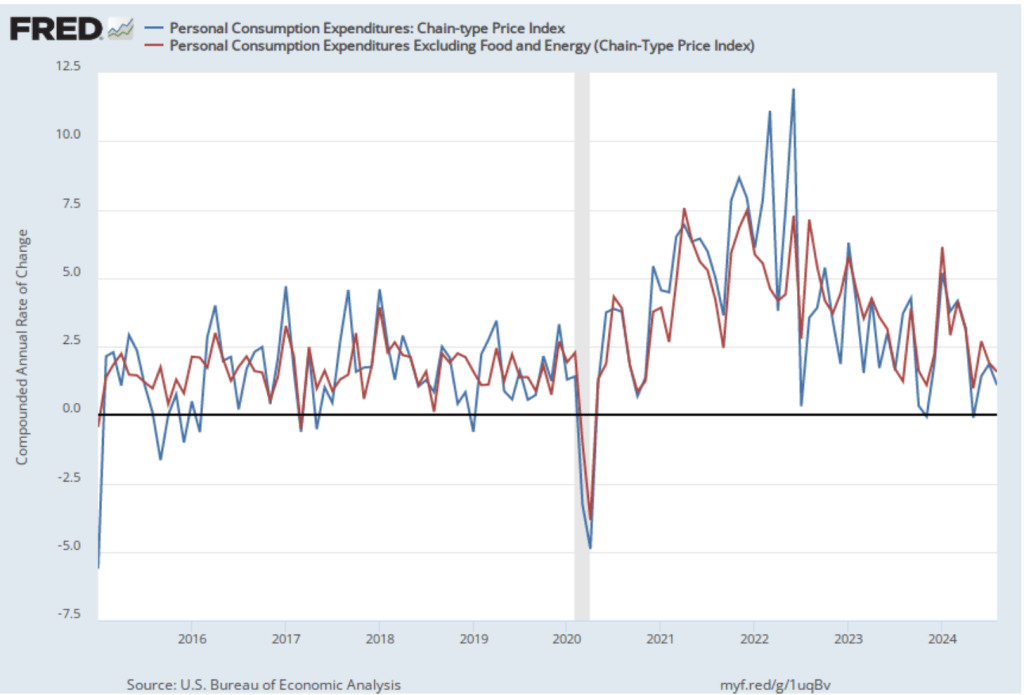
The following figure shows PCE inflation and core PCE inflation calculated by compounding the current month’s rate over an entire year. (The figure above shows what is sometimes called 12-month inflation, while this figure shows 1-month inflation.) Measured this way, PCE inflation declined from 1.9 percent in July to 1.1 percent in August, well below the Fed’s 2 percent inflation target. Core PCE inflation declined from 1.9 percent in July to 1.6 percent in August. Calculating inflation this way focuses only on the most recent data, and so reinforces the conclusion that inflation has slowed significantly from the higher rates seen at the beginning of this year.
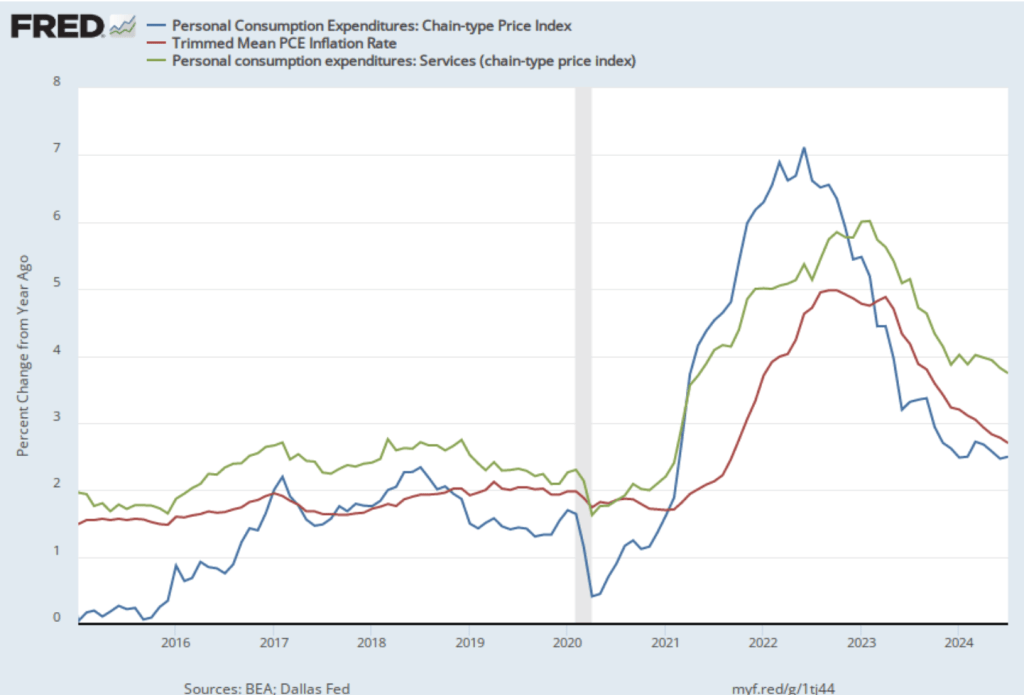
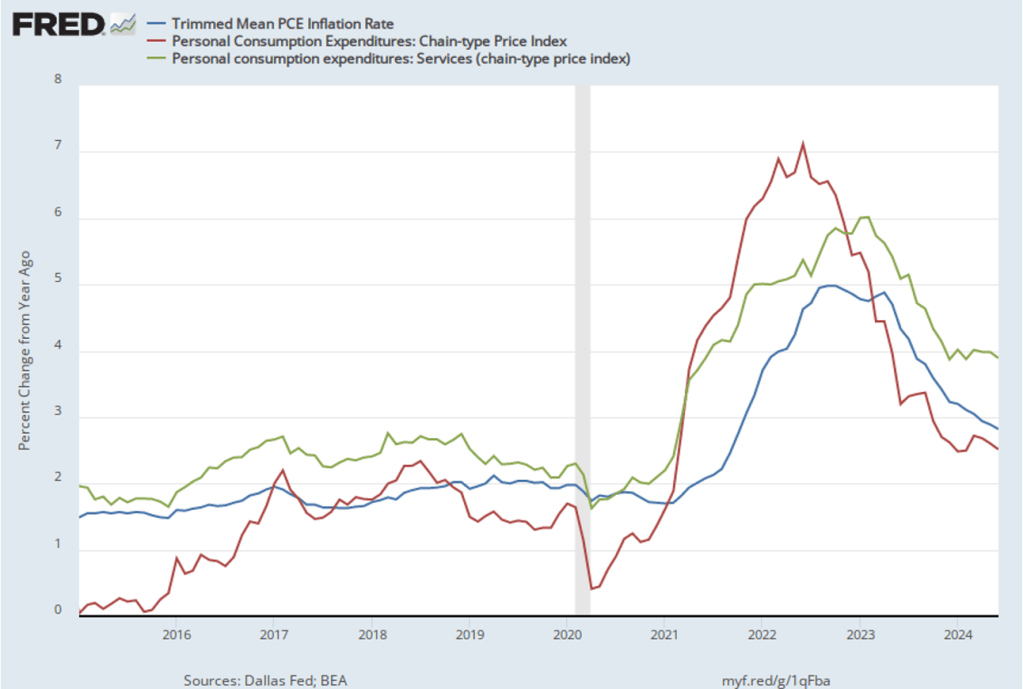
The following figure shows other ways of gauging inflation by including the 12-month inflation rate in the PCE (the same as shown in the figure above—although note that PCE inflation is now the red line rather than the blue line), inflation as measured using only the prices of the services included in the PCE (the green line), and the trimmed mean rate of PCE inflation (the blue line). Fed Chair Jerome Powell and other members of the Federal Open Market Committee (FOMC) have said that they are concerned by the persistence of elevated rates of inflation in services. The trimmed mean measure is compiled by economists at the Federal Reserve Bank of Dallas by dropping from the PCE the goods and services that have the highest and lowest rates of inflation. It can be thought of as another way of looking at core inflation by excluding the prices of goods and services that had particularly high or particularly low rates of inflation during the month.
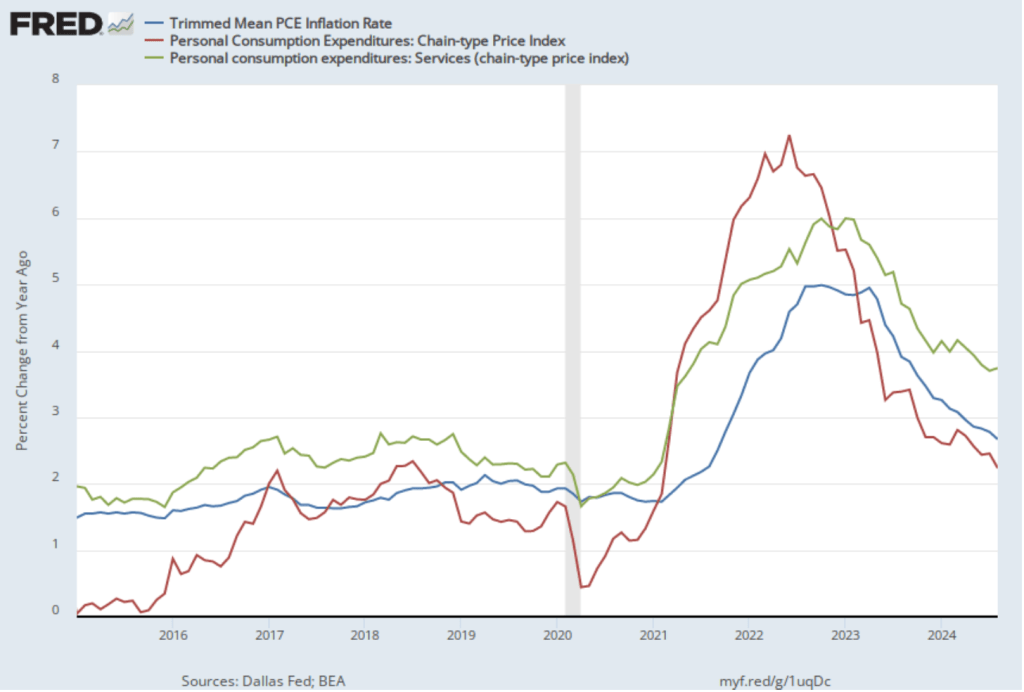
Inflation using the trimmed mean measure was 2.7 percent in August (calculated as a 12-month inflation rate), down only slightly from 2.6 percent in July—still above the Fed’s target inflation rate of 2 percent. Inflation in services remained high in August at 3.7 percent, the same as in July.
Today’s data indicate that the economy is still on a path for a soft landing in which the inflation rate returns to the Fed’s 2 percent target without the economy slipping into a recession. Looking forward, both the Federal Bank of Atlanta’s GDPNow forecast and the Federal Reserve Bank of New York’s GDP Nowcast project that real GDP will increase at annual rate of more than 3 percent in the third quarter (which ends in three days). So, at this point there is no indication that the economy is slipping into a recession. The next Employment Situation report will be released on October 4 and will provide more information on the state of the labor market.