Fed Governor Michelle Bowman Explains Her Dissenting Vote at the FOMC Meeting

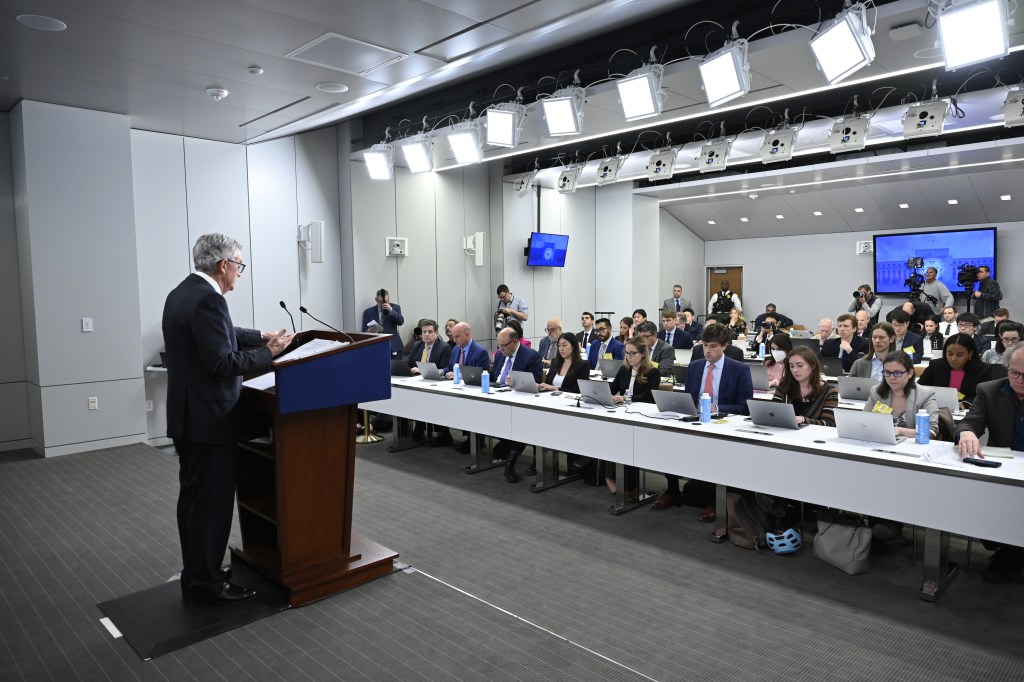
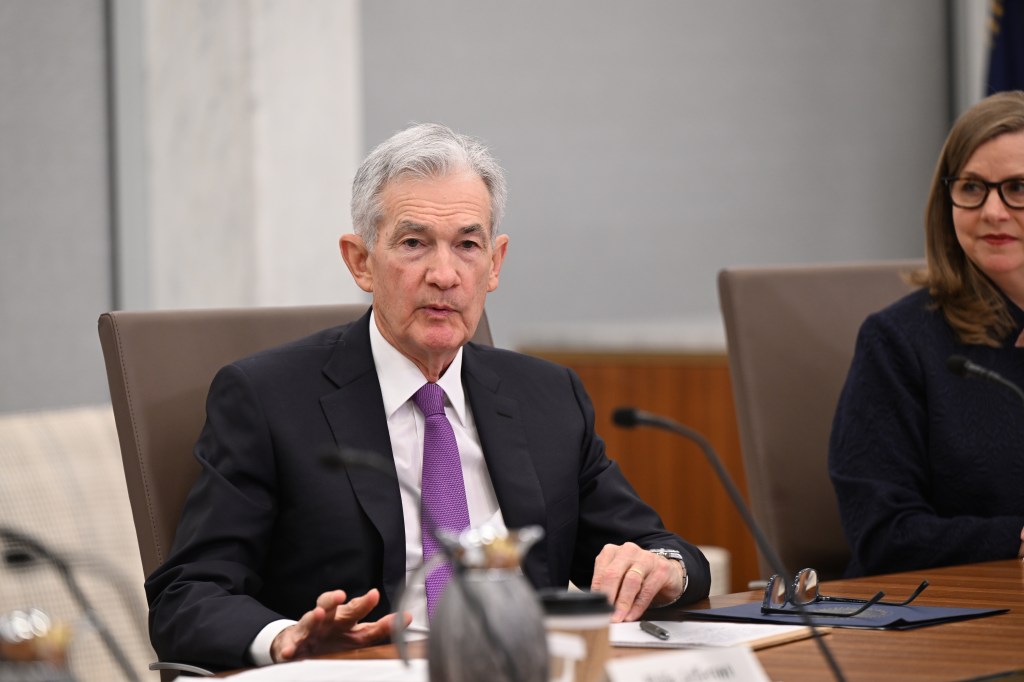
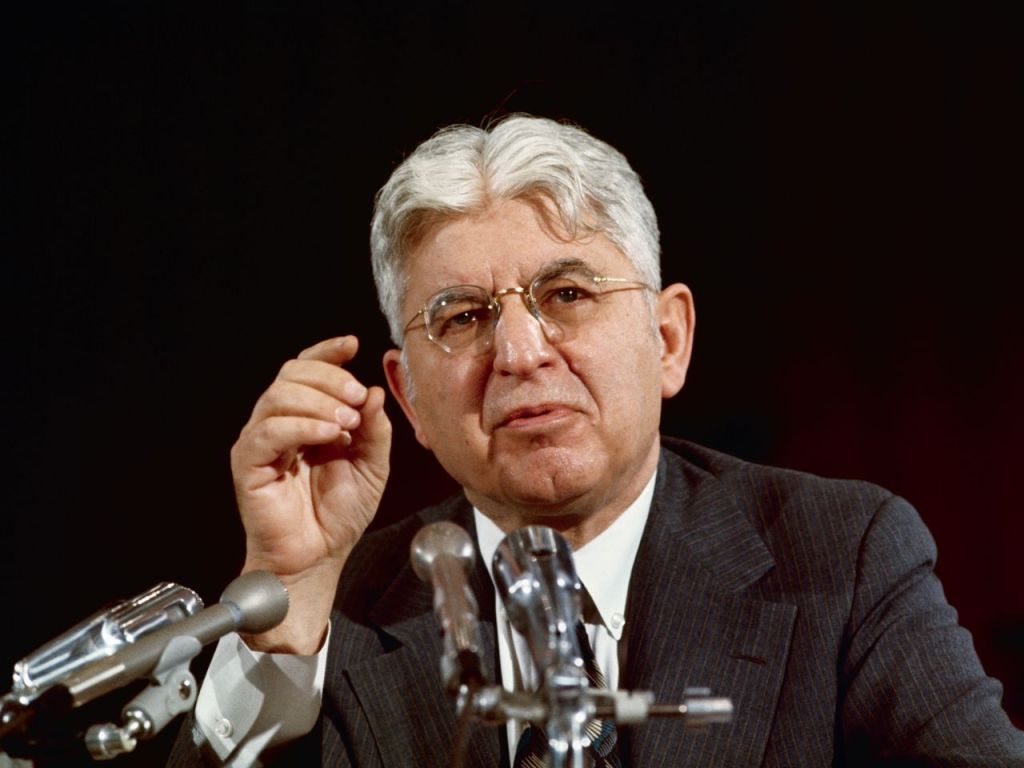
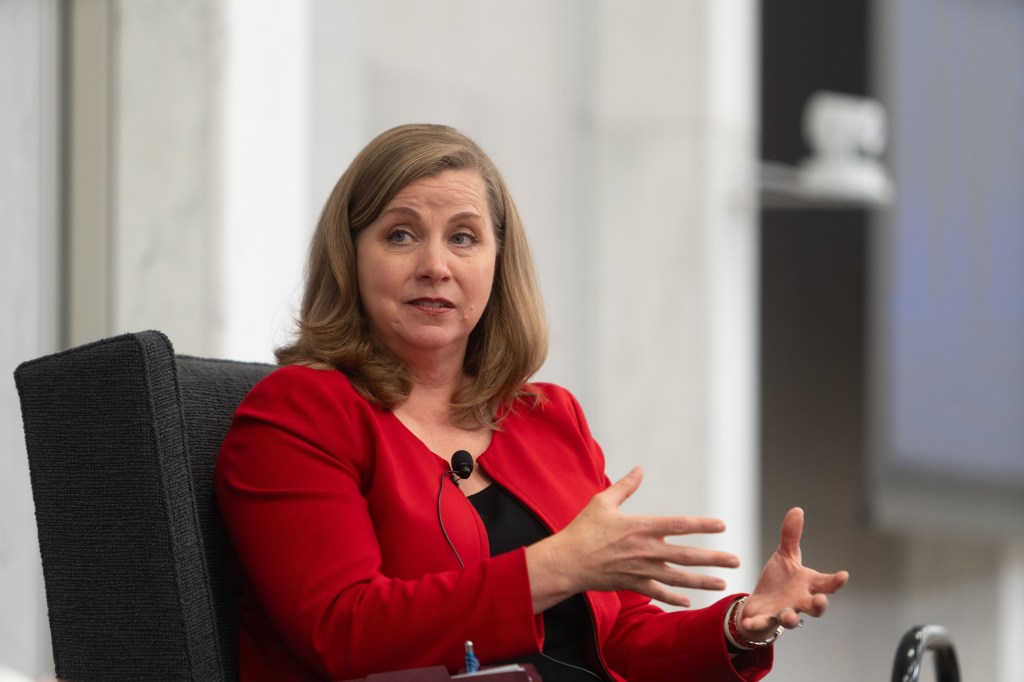
Federal Reserve Governor Michelle Bowman (Photo from federalreserve.gov)

Federal Reserve Chairs place a high value on consensus, particularly with respect to the decisions of the Federal Open Market Committee (FOMC) setting the target for the federal funds rate. (Note that the chair of the Fed’s Board of Governors also serves as the chair of the FOMC.) As we discuss in Macroeconomics, Chapter 14, Section 14.4 (Economics, Chapter 24, Sectio 24.4), the FOMC has 12 voting members: the 7 members of the Board of Governors, the president of the Federal Reserve Bank of New York, and 4 of the other 11 District Bank presidents, who serve rotating one-year terms.

Decisions by the FOMC in setting the target for the federal funds rate are usually unanimous. Prior to the FOMC meeting on September 17-18, each vote of the committee had been unanimous since Esther George, president of the Federal Reserve Bank of Kansas City cast a dissenting vote at the meeting on June 14-15, 2022. At that meeting, the committee voted to raise its target for the federal funds rate by 0.75 percentage point (75 basis points). George voted against the move because she believed a 0.50 percentage point (50 basis points) increase would have been more appropriate.

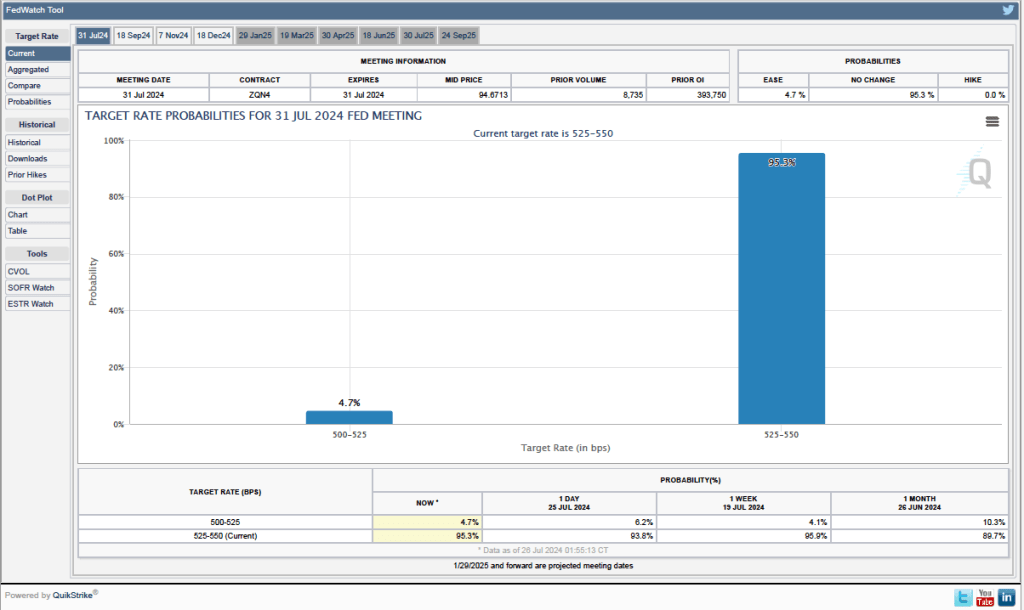
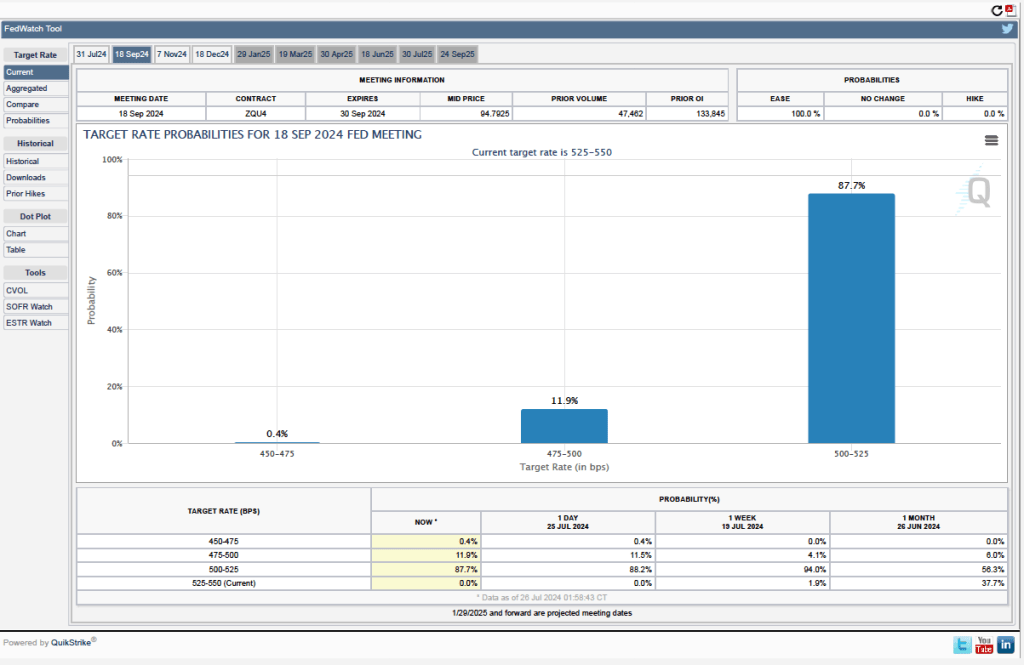
At the September 17-18 meeting, Fed Governor Michelle Bowman voted against the decision to reduce the target for the federal funds rate by 50 basis points because she believed a cut of 25 basis point would have been more appropriate. She was the first member of the Board of Governors to cast a dissenting vote at an FOMC meeting since 2005.

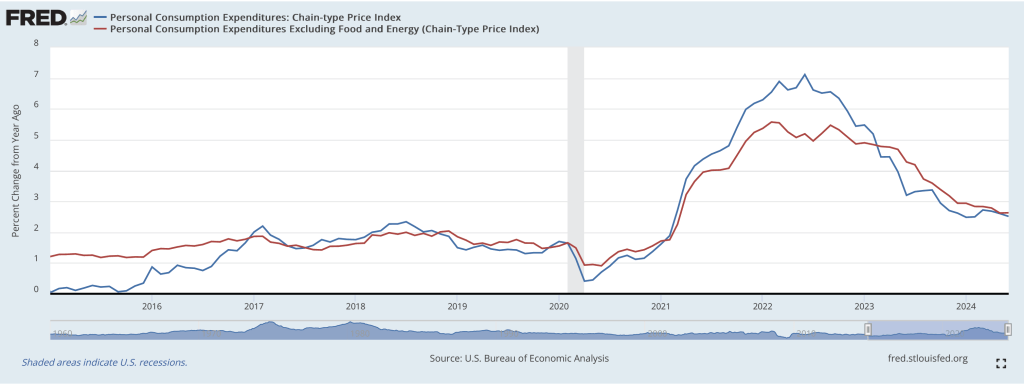
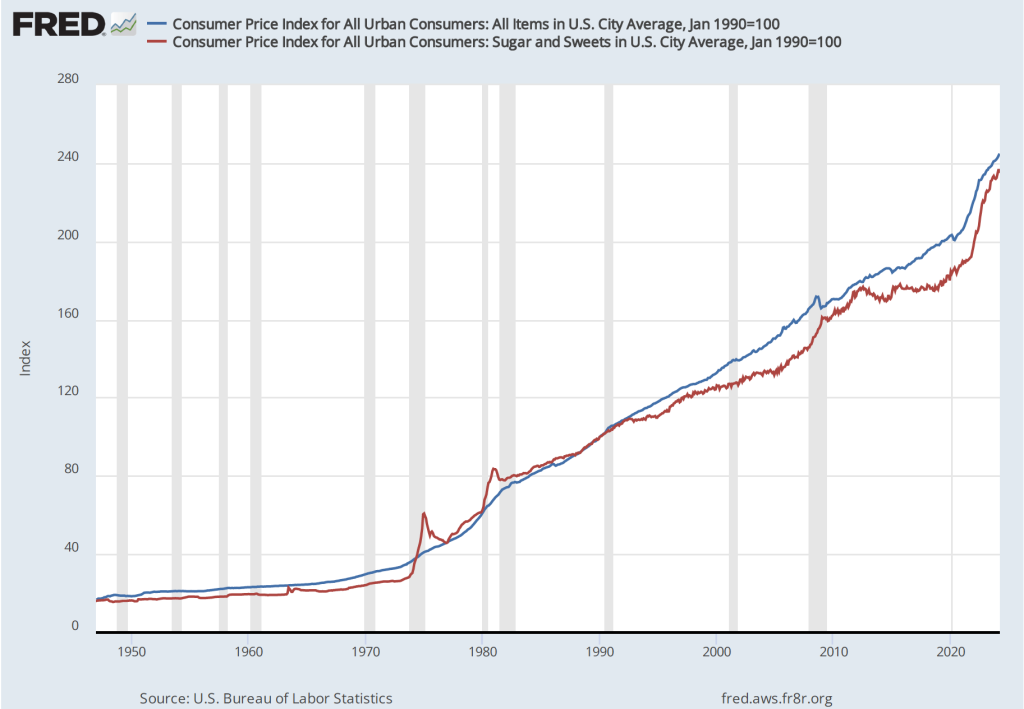
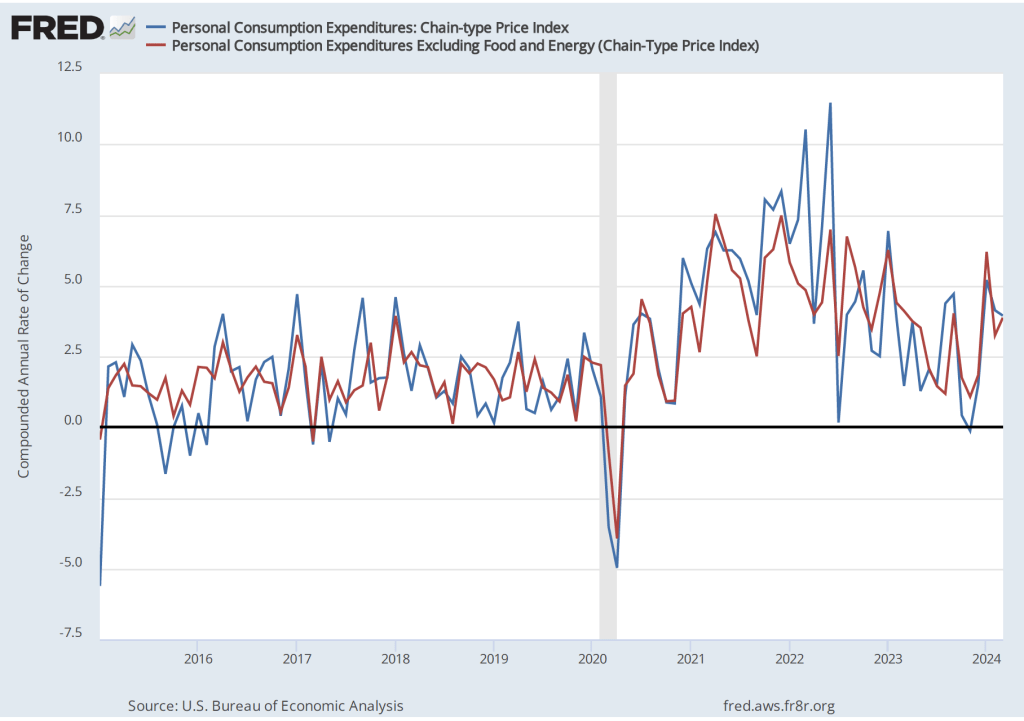
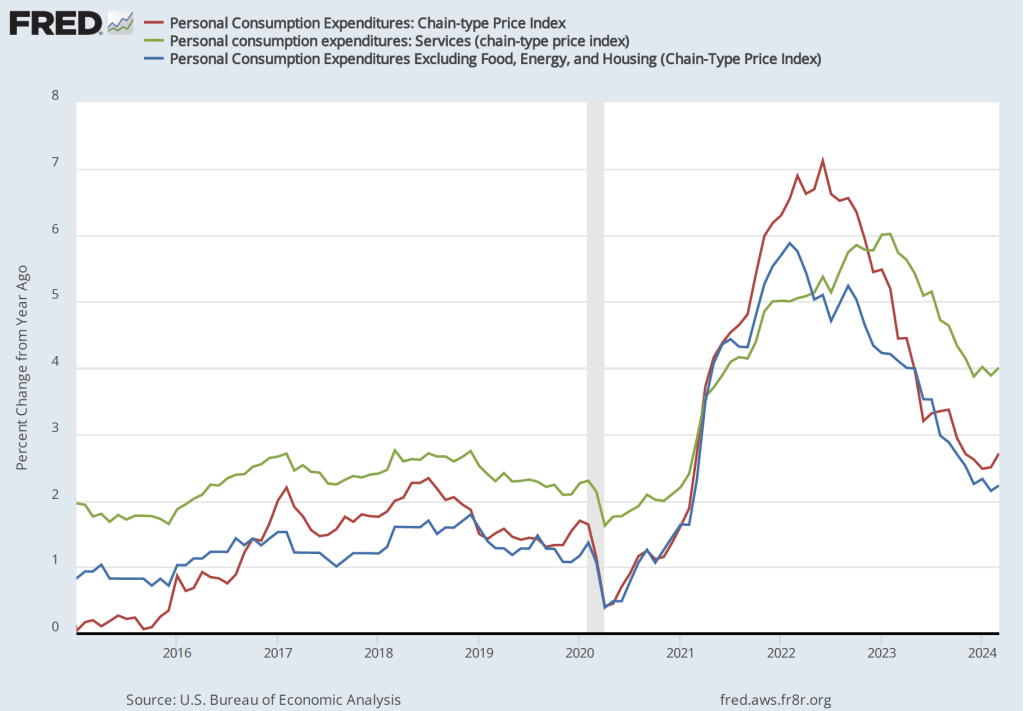
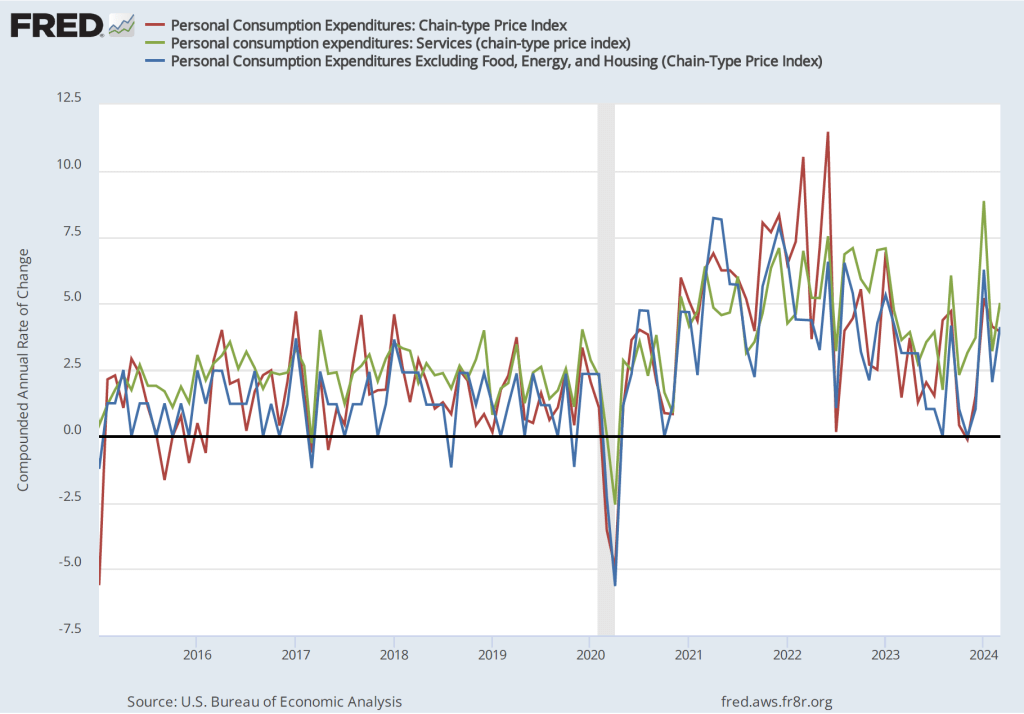
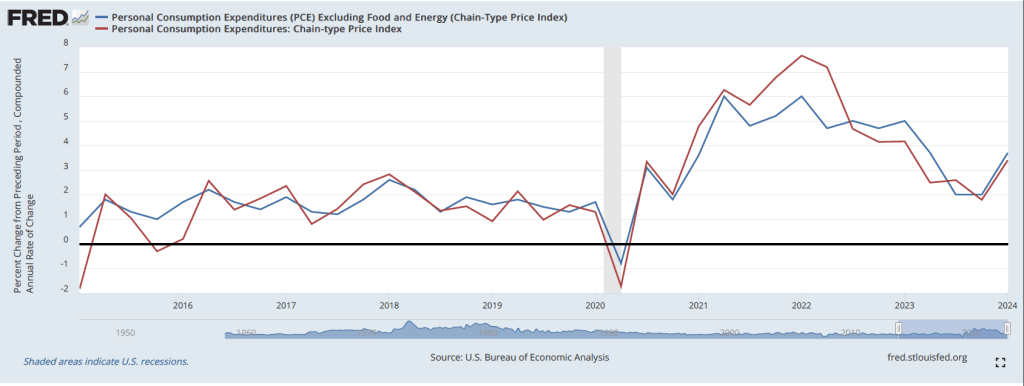
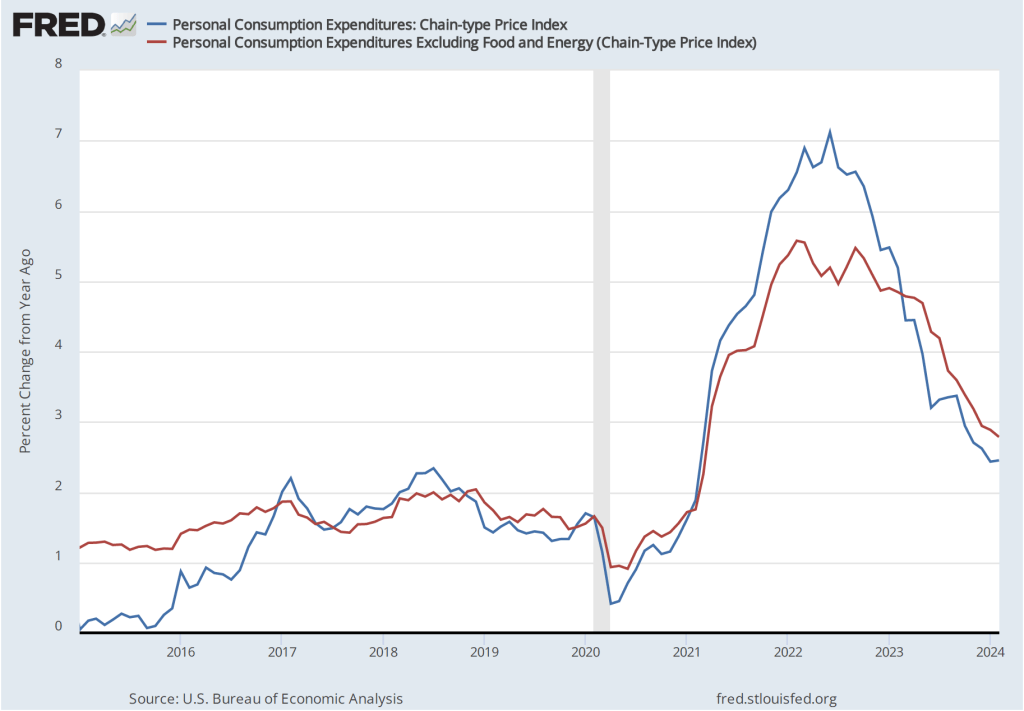
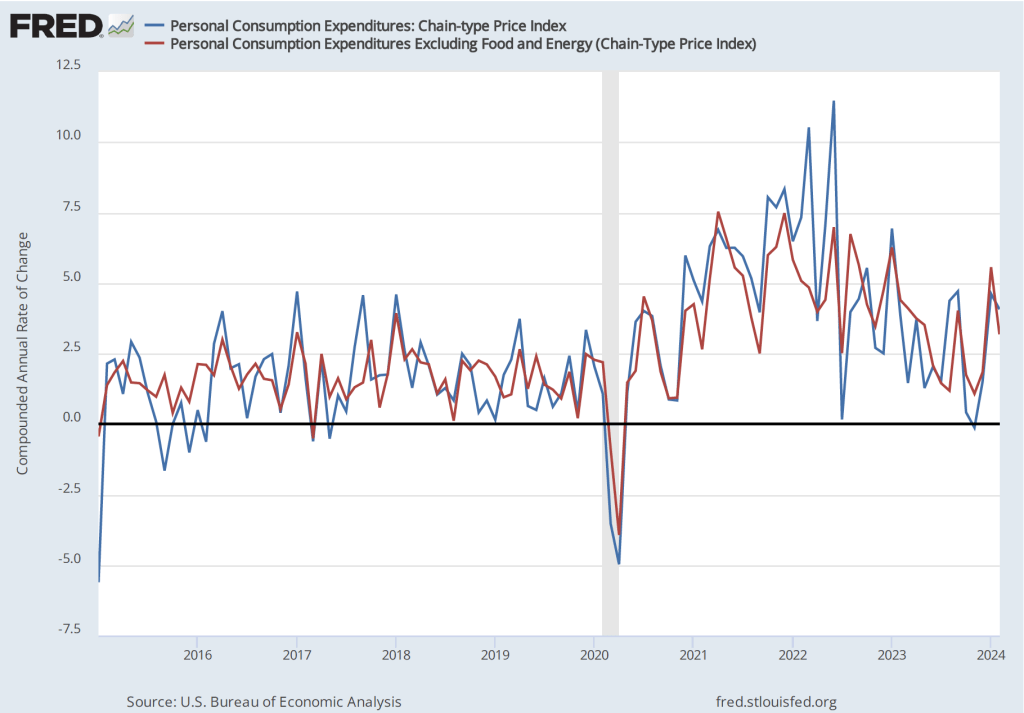
Perhaps because it’s unusual for a member of the Board of Governors to dissent from an FOMC decision, Bowman issued a statement explaining her vote. In her statement, Bowman argued that although inflation has declined substantially over the past two years, she was concerned that inflation as measured by the 12-month percentage change in the core personal consumption expenditures (PCE) price index was still 2.5 percent—above the Fed’s target inflation rate of 2 percent: “Although it is important to recognize that there has been meaningful progress on lowering inflation, while core inflation remains around or above 2.5 percent, I see the risk that the Committee’s larger policy action could be interpreted as a premature declaration of victory on our price stability mandate.” (Note that the Fed uses the PCE rather than the core PCE to gauge whether it is hitting its inflation target, but core PCE is generally thought to be a better indicator of the underlying inflation rate.)

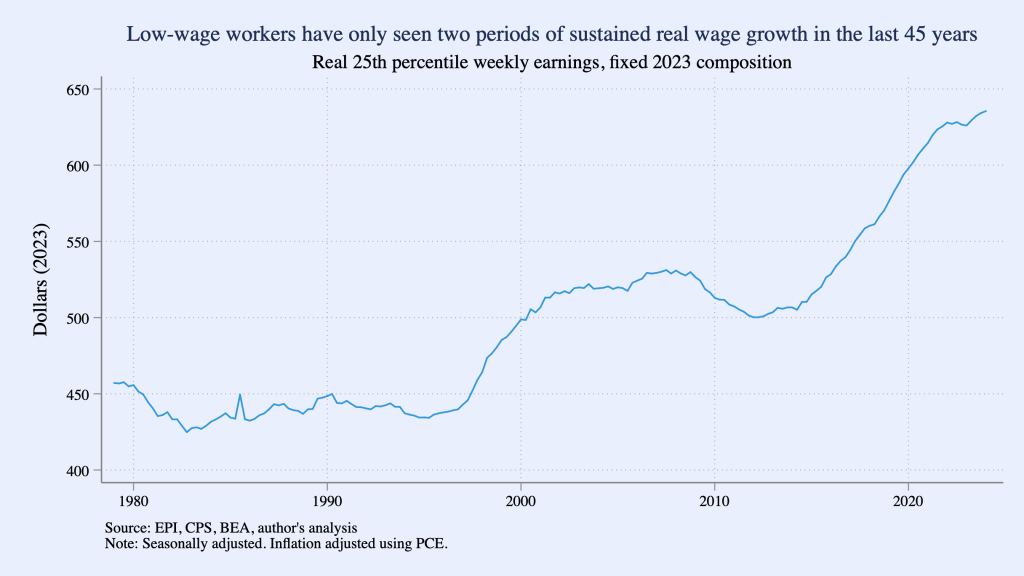
Bowman also noted the difficulty of interpreting developments in the labor market: “My reading of labor market data has become more uncertain due to increased measurement challenges and the inherent difficulty in assessing the effects of recent immigration flows.” (We discuss the effects on employment measures of differing estimates of the level of immigration in this blog post.)

Latest PCE Report Shows Inflation Continues to Ease

Federal Reserve Chair Jerome Powell at a press conference following a meeting of the Federal Open Market Committee (Photo from federal reserve.gov)

Inflation in 2024 is a tale of two quarters. During the first quarter of 2024, inflation ran higher than expected considering the falling inflation rates at the end of 2023. As a result, although at the beginning of the year many economists and Wall Street analysts had expected the Federal Reserve’s policy-making Federal Open Market Committee (FOMC) would cut its target for the federal funds rate at least once in the first half of 2024, the FOMC left its target unchanged.

On July 26, the Bureau of Economic Analysis (BEA) released its “Personal Income and Outlays” report for June. The report includes monthly data on the personal consumption expenditures (PCE) price index. The Fed relies on annual changes in the PCE price index to evaluate whether it’s meeting its 2 percent annual inflation target.  The report confirmed that PCE inflation slowed in the second quarter, bringing it closer to the Fed’s 2 percent target.

The following figure shows PCE inflation (blue line) and core PCE inflation (red line)—which excludes energy and food prices—for the period since January 2015 with inflation measured as the percentage change in the PCE from the same month in the previous year. Measured this way, in June PCE inflation (the blue line) was 2.5 percent, down slightly from PCE inflation of 2.6 percent in May. Core PCE inflation (the red line) in June was also 2.5 percent, which was unchanged from May.

The following figure shows PCE inflation and core PCE inflation calculated by compounding the current month’s rate over an entire year. (The figure above shows what is sometimes called 12-month inflation, while this figure shows 1-month inflation.) Measured this way, PCE inflation rose in June to 0.9 percent from 0.4 percent in May—although higher in June, inflation was well below the Fed’s 2 percent target in both months. Core PCE inflation rose from 1.5 percent in May to 2.0 percent in June.  These data indicate that inflation has been at or below the Fed’s target for the last two months.

The following figure shows another way of gauging inflation by including the 12-month inflation rate in the PCE (the same as shown in the figure above—although note that PCE inflation is now the red line rather than the blue line), inflation as measured using only the prices of the services included in the PCE (the green line), and the trimmed mean rate of PCE inflation (the blue line). Fed Chair Jerome Powell and other members of the Federal Open Market Committee (FOMC) have said that they are concerned by the persistence of elevated rates of inflation in services. The trimmed mean measure is compiled by economists at the Federal Reserve Bank of Dallas by dropping from the PCE the goods and services that have the highest and lowest rates of inflation. It can be thought of as another way of looking at core inflation by excluding the prices of goods and services that had particularly high or particularly low rates of inflation during the month.

Inflation using the trimmed mean measure was 2.8 percent in June (calculated as a 12-month inflation rate), down only slightly from 2.9 percent in May—and still above the Fed’s target inflation rate of 2 percent. Inflation in services remained high in June at 3.9 percent, down only slightly from 4.0 percent in May.

This month’s PCE inflation data indicate that the inflation rate is still declining towards the Fed’s target, with the low 1-month inflation rates being particularly encouraging. It now seems likely that the FOMC will soon lower the committee’s target for the federal funds rate, which is currently 5.25 percent to 5.50 percent. Remarks by Fed Chair Powell have been interpreted as hinting as much. The next meeting of the FOMC is July 30-31. What do financial markets think the FOMC will decide at that meeting?

Futures markets allow investors to buy and sell futures contracts on commodities–such as wheat and oil–and on financial assets. Investors can use futures contracts both to hedge against risk—such as a sudden increase in oil prices or in interest rates—and to speculate by, in effect, betting on whether the price of a commodity or financial asset is likely to rise or fall. (We discuss the mechanics of futures markets in Chapter 7, Section 7.3 of Money, Banking, and the Financial System.) The CME Group was formed from several futures markets, including the Chicago Mercantile Exchange, and allows investors to trade federal funds futures contracts. The data that result from trading on the CME indicate what investors in financial markets expect future values of the federal funds rate to be. The following chart from the CME’s FedWatch Tool shows the current values from trading of federal funds futures.

The probabilities in the chart reflect investors’ predictions of what the FOMC’s target for the federal funds rate will be after the committee’s July meeting. The chart indicates that investors assign a probability of only 4.7 percent to the FOMC cutting its federal funds rate target by 0.25 percentage point at its July 30-31 meeting and an 95.3 percent probability of the commitee leaving the target unchanged. 

In contrast, the following figure shows that investors expect that the FOMC will cut its federal funds rate at the meeting scheduled for September 17-18. Investors assign an 87.7 percent probability of a 0.25 percentage point cut and a 11.9 percent probability of a 0.50 percentage point cut. The committee deciding to leave the target unchanged at 5.25 percent to 5.50 percent is effectively assigned a zero probability. In other words, investors believe with near certainty that the FOMC will reduce its target for the federal funds rate for the first time since the current round of rate increases ended in July 2023.

How Well Have Low-Wage Workers Done over the Years?

Image of servers in a restaurant generated by ChatGTP-4o.

How should you track over time the real wagees of low-wage workers? If you are interested in income mobility, you would want to track the experience over the course of their working lives of individuals who began their careers in low-wage occupations. Doing so would allow you to measure how well (or poorly) the U.S. economy succeeds in providing individuals with opportunities to improve their incomes over time.

You might also be interested in how the real wages of people who earn low wages has changed over time. In this case, rather than tracing the wages over time of individuals who earn low wages when they first enter the labor market, you would look at the real wages of people who earn low wages at any given time. The simplest way to do that analysis would be using data on the average nominal wage earned by, say, the lowest 20 percent of wage earners, and deflate the average nominal wage by a price index to determine the average real wage of these workers. How the average real wage of low-wage workers varies over time provides some insight into the changing standard of living of low-wage workers.

In a recent Substack post, Ernie Tedeschi, Director of Economics at the Budget Lab research center at Yale University, has carried out a careful analysis of movements over time in the average real wage of low-wage workers. Tedeschi points out a complicating factor in this analysis: “The population has gotten older over time and more educated. The workforce looks different too, with more workers in services and fewer in manufacturing. Shifting populations means that comparisons of workers aren’t apples-to-apples over time.”

To correct for these confounding factors, Tedeschi constructs a low-wage index that makes it possible to examine the real wage of low-wage workers, holding constant the composition of low-wage workers with respect to “sex, age, race, college education, and broad industry and occupation” at the values of these characteristics in 2023. Using this approach, makes it possible to separate changes in wages of workers with given characteristics from changes in wages that occur because the average characteristics of workers has changed. For example, on average, workers who are older or who have more years of education will be more productive and, therefore, on average will earn higher wages than will workers who are younger or have fewer years of education.

The following figure from Tedeschi’sSubstack post shows movements in his low-wage index during each quarter from the first quarter of 1979 to the first quarter of 2024, with “low wage” defined as workers at the 25th precentile of the distribution of wages. (That is, 24 percent of workers receive lower wages and 75 percent of workers receive higher wages than do these workers.) The index shows that a low-wage worker in 2024 has a much higher real wage than a low-wage worker in 1979, but the increase in the average real wage occurs mainly during two periods: 1997–2007 and 2014–2024. (Tedeschi uses the person consumption expenditures (PCE) price index to convert nominal wages to real wages.)

A more complete discussion of Tedeschi’s methods and results can be found in his blog post.

Latest PCE Report Shows Inflation Slowing

Chair Jerome Powell and other members of the Federal Open Market Committee (Photo from federalreserve.gov)

On Friday, June 28, the Bureau of Economic Analysis (BEA) released its “Personal Income and Outlays” report for April, which includes monthly data on the personal consumption expenditures (PCE) price index. Inflation as measured by annual changes in the consumer price index (CPI) receives the most attention in the media, but the Federal Reserve looks instead to inflation as measured by annual changes in the PCE price index to evaluate whether it’s meeting its 2 percent annual inflation target.  

The following figure shows PCE inflation (blue line) and core PCE inflation (red line)—which excludes energy and food prices—for the period since January 2015 with inflation measured as the change in the PCE from the same month in the previous year. Measured this way, in May PCE inflation (the blue line) was 2.6 percent in May, down slightly from PCE inflation of 2.7 percent in April. Core PCE inflation (the red line) in May was also 2.6 percent, down from 2.8 percent in April.

The following figure shows PCE inflation and core PCE inflation calculated by compounding the current month’s rate over an entire year. (The figure above shows what is sometimes called 12-month inflation, while this figure shows 1-month inflation.) Measured this way, PCE inflation sharply declined from 3.2 percent in April to -0.1 percent in in May—meaning that consumer prices actually fell during May. Core PCE inflation declined from 3.2 percent in April to 1.0 percent in May.  This decline indicates that inflation by either meansure slowed substantially in May, but data for a single month should be interpreted with caution.

The following figure shows another way of gauging inflation by including the 12-month inflation rate in the PCE (the same as shown in the figure above—although note that PCE inflation is now the red line rather than the blue line), inflation as measured using only the prices of the services included in the PCE (the green line), and the trimmed mean rate of PCE inflation (the blue line). Fed Chair Jerome Powell and other members of the Federal Open Market Committee (FOMC) have said that they are concerned by the persistence of elevated rates of inflation in services. The trimmed mean measure is compiled by economists at the Federal Reserve Bank of Dallas by dropping from the PCE the goods and services that have the highest and lowest rates of inflation. It can be thought of as another way of looking at core inflation by excluding the prices of goods and services that had particularly high or particularly low rates of inflation during the month.

Inflation using the trimmed mean measure was 2.8 percent in May (calculated as a 12-month inflation rate), down only slightly from 2.9 percent in April—and still well above the Fed’s target inflation rate of 2 percent. Inflation in services remained high in May at 3.9 percent, down only slightly from 4.0 percent in April.

This month’s PCE inflation data indicate that the inflation rate is still declining towards the Fed’s target, with the low 1-month inflation rates being particularly encouraging. But the FOMC will likely need additional data before deciding to lower the committee’s target for the federal funds rate, which is currently 5.25 percent to 5.50 percent. The next meeting of the FOMC is July 30-31. What do financial markets think the FOMC will decide at that meeting?

Futures markets allow investors to buy and sell futures contracts on commodities–such as wheat and oil–and on financial assets. Investors can use futures contracts both to hedge against risk—such as a sudden increase in oil prices or in interest rates—and to speculate by, in effect, betting on whether the price of a commodity or financial asset is likely to rise or fall. (We discuss the mechanics of futures markets in Chapter 7, Section 7.3 of Money, Banking, and the Financial System.) The CME Group was formed from several futures markets, including the Chicago Mercantile Exchange, and allows investors to trade federal funds futures contracts. The data that result from trading on the CME indicate what investors in financial markets expect future values of the federal funds rate to be. The following chart from the CME’s FedWatch Tool shows the current values from trading of federal funds futures.

The probabilities in the chart reflect investors’ predictions of what the FOMC’s target for the federal funds rate will be after the committee’s July meeting. The chart indicates that investors assign a probability of only 10.3 percent to the FOMC cutting its federal funds rate target by 0.25 percentage point at that meeting and an 89.7 percent probability of the commitee leaving the target unchanged.

In contrast, the following figure shows that investors expect that the FOMC will cut its federal funds rate at the meeting scheduled for September 17-18. Investors assign a 57.9 percent probability of a 0.25 percentage point cut and a 6.2 percent probability of a 0.50 percentage point cut. The committee deciding to leave the target unchanged at 5.25 percent to 5.50 percent is assigned a probability of only 35.9 percent.

Solved Problem: The Fed and the Value of Money

SupportsMacroeconomics, Chapter 15, Economics, Chapter 25, Essentials of Economics, Chapter 17, and Money, Banking, and the Financial System, Chapter 15.

Image generated by ChatGTP-4o.

In a book review in the Wall Street Journal, the financial writer James Grant referred to “the Federal Reserve’s goal to cheapen the dollar by 2% a year.” 

  1. Briefly explain what “cheapen the dollar” means.
  2. Briefly explain what Grant means by writing that the Fed has a “goal to cheapen the dollar by 2% a year.”
  3. Do you agree with Grant that the Fed has this goal? Briefly explain.

Solving the Problem
Step 1: Review the chapter material. This problem is about the economic effects of the Federal Reserve’s policy goal of a 2 percent annual inflation rate, so you may want to review Chapter 15, Section 15.5, “A Closer Look at the Fed’s Setting Monetary Policy Targets.”

Step 2: Answer part a. by explaining what “cheapen the dollar” means. Judging from the context, “cheapen the dollar” means to reduce the purchasing power of a dollar. Whenever inflation occurs, the amount of goods and services a dollar can purchase declines. If the inflation rate in a year is 10 percent, than at the end of the year $1,000 can buy 10 percent fewer goods and services than it could at the beginning of the year.

Step 3: Answer part b. by expalining what Grant means by the Fed having a goal of cheapening the dollar by 2 percent a year. Congress has given a dual mandate of high employment and price stability.  Since 2012, the Fed has interpreted a 2 percent annual inflation rate as meeting its mandate for price stability. So, Grant means that the Fed’s 2 percent annual inflation goal in effect is also a goal to cheapen—or reduce the purchasing power of the dollar—by 2 percent a year.

Step 4: Answer part c. by explaining whether you agree with Grant that the Fed has a goal of cheapening the dollar by 2 percent a year. As explained in the answer to part b., there is a sense in which Grant is correct; the Fed’s goal of a 2 percent inflation rate is a goal of allowing the purchasing power of the dollar to decline by 2 percent a year. One complication, however, is that most economists believe that changes in price indexes such as the consumer price index (CPI) and the personal consumption expenditures (PCE) price index overstate the actual amount of inflation occurring in the economy. As we discuss in Macroeconomics, Chapter 9, Section 9.4 (Economics, Chapter 19, Section 19.4, and Essentials of Economics, Chapter 13, Section 13.4), there are several biases that cause price indexes to overstate the true inflation rate; the most important of the biases is the failure of price indexes to take fully into account improvements over time in the quality of many goods and services. If increases in price indexes are overstating the inflation rate by one percentage point, then the Fed’s goal of a 2 percent inflation rate results in the dollar losing 1 percent—rather than 2 percent—of its purchasing power over time, corrected for changes in quality. 

Another Middling Inflation Report

A meeting of the Federal Open Market Committee (Photo from federalreserve.gov)

On Friday, May 31, the Bureau of Eeconomic Analysis (BEA) released its “Personal Income and Outlays” report for April, which includes monthly data on the personal consumption expenditures (PCE) price index. Inflation as measured by changes in the consumer price index (CPI) receives the most attention in the media, but the Federal Reserve looks instead to inflation as measured by changes in the PCE price index to evaluate whether it’s meeting its 2 percent annual inflation target. 

The following figure shows PCE inflation (blue line) and core PCE inflation (red line)—which excludes energy and food prices—for the period since January 2015 with inflation measured as the change in the PCE from the same month in the previous year. Measured this way, PCE inflation in April was 2.7 percent, which was unchanged since March. Core PCE inflation was also unchanged in April at 2.8 percent. (Note that carried to two digits past the decimal place, both measures decreased slightly in April.)

The following figure shows PCE inflation and core PCE inflation calculated by compounding the current month’s rate over an entire year. (The figure above shows what is sometimes called 12-month inflation, while this figure shows 1-month inflation.) Measured this way, PCE inflation declined from 4.1 percent in March to 3.1 percent in April. Core PCE inflation declined from 4.1 percent in March to 3.0 percent in April.  This decline may indicate that inflation is slowing, but data for a single month should be interpreted with caution and, even with this decline, inflation is still above the Fed’s 2 percent target.

The following figure shows another way of gauging inflation by including the 12-month inflation rate in the PCE (the same as shown in the figure above—although note that PCE inflation is now the red line rather than the blue line), inflation as measured using only the prices of the services included in the PCE (the green line), and the trimmed mean rate of PCE inflation (the blue line). Fed Chair Jerome Powell has said that he is particularly concerned by elevated rates of inflation in services. The trimmed mean measure is compiled by economists at the Federal Reserve Bank of Dallas by dropping from the PCE the goods and services that have the highest and lowest rates of inflation. It can be thought of as another way of looking at core inflation by excluding the prices of goods and services that had particularly high or particularly low rates of inflation during the month.

Inflation using the trimmed mean measure was 2.9 percent in April, down from 3.0 percent in March. Inflation in services remained high, although it declined slightly from 4.0 percent in March to 3.9 percent in April.

It seems unlikely that this month’s PCE data will have much effect on when the members of the Fed’s policy-making Federal Open Market Committee (FOMC) will decide to lower the target for the federal funds rate. The next meeting of the FOMC is June 11-12. That meeting is one of the four during the year at which the committee publishes a Summary of Economic Projections (SEP). The SEP should provide greater insight into what committee members expect will happen with inflation during the remained of the year and whether it’s likely that the committee will lower its target for the federal funds rate this year.

Is Sugar All You Need?

Dylan’s Candy Bar in New York City (Photo from the New York Times)

Can prices of one type of good track inflation accurately? As we’ve discussed in a number of blog posts (for instance, here, here, and here), there is a debate among economists about which of the data series on the price level does the best job of tracking the underlying rate of inflation.

The most familiar data series on the price level is the consumer price index (CPI). Core CPI excludes the—typically volatile—food and energy prices. In gauging whether it is achieving its goal of 2 percent annual inflation, the Federal Reserve uses the personal consumption expenditures (PCE) price index. The PCE price index includes the prices of all the goods and services included in the consumption category of GDP, which makes it a broader measure of inflation than the CPI. To understand the underlying rate of inflation, the Fed often focuses on movements in core PCE.

With the increase in inflation that started in the spring of 2021, some economists noted that the prices of particular goods and services—such as new and used cars and housing—were increasing much more rapidly than other prices. So some economists concentrated on calculating inflation rates that excluded these or other prices from either the CPI or the PCE.

For example, the following figure shows the inflation rate measured by the percentage change from the same month in the previous year using the median CPI and using the trimmed mean PCE. If we list the inflation rate in each individual good or service in the CPI, median inflation is the inflation rate of the good or service that is in the middle of the list—that is, the inflation rate in the price of the good or service that has an equal number of higher and lower inflation rates. The trimmed mean measure of PCE inflation is compiled by economists at the Federal Reserve Bank of Dallas by dropping from the PCE the goods and services that have the highest and lowest rates of inflation. During the period when the inflation rate was increasing rapidly during 2021 and 2022, CPI inflation increased more and was more volatile than PCE inflation. That difference between movements in the two price level series is heightened when comparing median inflation in the CPI with trimmed mean inflation in the PCE. In particular, using trimmed mean PCE, the inflation of late 2021 and 2022 seems significantly milder than it does using median CPI.

The United States last experienced high inflation rates in the 1970s, when few people used personal computers and easily downloading macroeconomic data from the internet wasn’t yet possible. Today, it’s comparatively easy to download data on the CPI and PCE and manipulate them to investigate how the inflation rate would be affected by dropping the prices of various goods and services. It’s not clear, though, that this approach is always helpful in determining the underlying inflation rate. In a market system, the prices of many goods and services will be affected in a given month by shifts in demand and supply that aren’t related to general macroeconomic conditions.

In a recent blog post, economists B. Ravikumar and Amy Smaldone of the Federal Reserve Bank of St. Louis note that there is a strong correlation between movements in the prices of the “Sugar and Sweets” component of the CPI and movements in the overall CPI. Their post includes the following two figures. The first shows the price level since 1947 calculated using the prices of all the goods and services in the CPI (blue line) and the price level calculated just using the prices of goods included in the “Sugar and Sweets” category (red line). The data are adjusted to an index where the value for each series in January 1990 equals 100. The second figure shows the percentage change from the previous month for both series for the months since January 2000.

The two figures show an interesting—and perhaps surprising—correlation between sugar and sweets prices and all prices included in the CPI. The St. Louis Fed economists note that although the CPI is only published once per month, prices on sugar and sweets are available weekly. Does that mean that we could use prices on sugar and sweets to predict the CPI? That seems unlikely. First, consider that the sugar and sweets category of the CPI consists of three sub-categories:

  1. White, brown, and raw sugar and natural and artificial sweetners
  2. Chocolate and other types of candy, fruit flavored rolls, chewing gum and breath mints
  3. Other sweets, including jelly and jams, honey, pancake syrup, marshmallows, and chocolate syrup

Taken together these products are less than 3 percent of the products included in the CPI. In addition, the prices of the goods in this category can be heavily dependent on movements in sugar and cocoa prices, which are determined in world wide markets. For instance, the following figure shows the world price of raw cocoa, which soared in 2024 due to bad weather in West Africa, where most cocoa is grown. There’s no particular reason to think that factors affecting the markets for sugar and cocoa will also affect the markets in the United States for automobiles, gasoline, furniture, or most other products.

In fact, as the first figure below shows, if we look at the inflation rate calculated as the percentage change from the same month in the previous year, movements in sugar and sweets prices don’t track very closely movements in the overall CPI. Beginning in the summer of 2022—an important period when the inflation that began in the spring of 2021 peaked—inflation in sugar and sweets was much higher than overall CPI inflation. Anyone using prices of sugar and sweets to forecast what was happening to overal CPI inflation would have made very poor predictions. We get the same conclusion from comparing inflation calculated by compounding the current month’s rate over an entire year: Inflation in sugar and sweets prices is much more volatile than is overall CPI inflation. That conclusion is unsurprising given that food prices are generally more volatile than are the prices of most other goods.

It can be interesting to experiment with excluding various prices from the CPI or the PCE or with focusing on subcategories of these series. But it’s not clear at this point whether any of these adjustments to the CPI and the PCE, apart from excluding all food and energy prices, gives an improved estimate of the underlying rate of inflation.

Latest Monthly Report on PCE Inflation Confirms Inflation Remains Stubbornly High

Federal Reserve Chair Jerome Powell (Photo from federalreserve.gov)

In a post yesterday, we noted that the quarterly data on the personal consumption expenditures (PCE) price index in the latest GDP report released by the Bureau of Economic Analysis (BEA) indicated that inflation was running higher than expected. Today (April 26), the BEA released its “Personal Income and Outlays” report for March, which includes monthly data on the PCE. The monthly data are consistent with the quarterly data in showing that PCE inflation remains higher than the Federal Reserve’s 2 percent annual inflation target. (A reminder that PCE inflation is particularly important because it’s the inflation measure the Fed uses to gauge whether it’s hitting its inflation target.)

The following figure shows PCE inflation (blue line) and core PCE inflation (red line)—which excludes energy and food prices—with inflation measured as the percentage change in the PCE from the same month in the previous year. Many economists believe that core inflation gives a better gauge of the underlying inflation rate. Measured this way, PCE inflation increased from 2.5 percent in February to 2.7 percent in March. Core PCE inflation remained unchanged at 2.8 percent.

The following figure shows PCE inflation and core PCE inflation calculated by compounding the current month’s rate over an entire year. (The figure above shows what is sometimes called 12-month inflation, while this figure shows 1-month inflation.) Measured this way, PCE inflation declined from 4.1 percent in February to 3.9 percent in March. Core PCE inflation increased from 3.2 percent in February to 3.9 in March. So, March was another month in which both PCE inflation and core PCE inflation remained well above the Fed’s 2 percent inflation target.


The following figure shows other ways of gauging inflation by including the 12-month inflation rate in the PCE (the same as shown in the figure above—although note that PCE inflation is now the red line rather than the blue line), inflation as measured using only the prices of the services included in the PCE (the green line), and the rate of inflation (the blue line) excluding the prices of housing, food, and energy. Fed Chair Jerome Powell has said that he is particularly concerned by elevated rates of inflation in services. Some economists believe that the price of housing isn’t accurately measured in the PCE, which makes it interesting to see if excluding the price of housing makes much difference in calculating the inflation rate. All three measures of inflation increased from February to March, with inflation in services remaining well above overall inflation and inflation excluding the prices of housing, food, and energy being somewhat lower than overall inflation.

The following figure uses the same three inflation measures as the figure above, but shows the 1-month inflation rate rather than the 12-month inflation rate. Measured this way, inflation in services increased sharply from 3.2 percent in February to 5.0 percent in March. Inflation excluding the prices of housing, food, and energy doubled from 2.0 percent in February to 4.1 percent in March.

Overall, the data in this report indicate that the decline in inflation during the second half of 2023 hasn’t continued in the first three months of 2024. In fact, the inflation rate may be slightly increasing. As a result, it no longer seems clear that the Fed’s policy-making Federal Open Market Committee (FOMC) will cut its target for the federal funds rate this year. (We discuss the possibility that the FOMC will keep its target unchanged through the end of the year in this blog post.) At the press conference following the FOMC’s next meeting on April 30-May 1, Fed Chair Jerome Powell may explain what effect the most recent data have had on the FOMC’s planned actions during the remainder of the year.

Does the Latest GDP Report Indicate the U.S. Economy Is Entering a Period of Stagflation?

Arthur Burns was Fed chair during the stagflation of the 1970s. (Photo from the Wall Street Journal)

This morning, Thursday April 25, the Bureau of Economic Analysis (BEA) released its advance estimate of real GDP growth during the first quarter of 2024. The two most striking points in the report are, first, that real GDP increased in the first quarter at an annual rate of only 1.6 percent—well below the 2.5 percent increase expected in a survey of economists and the 2.7 percent increase indicated by the Federal Reserve Bank of Atlanta’s GDPNow forecast. As the following figure shows, the growth rate of real GDP has declined in each of the last two quarters from the very strong growth rate of 4.9 percent during the third quarter of 2023.  

The second striking point in the report was an unexpected increase in inflation, as measured using the personal consumption expenditures (PCE) price index. As the following figure shows, PCE inflation (the red line), measured as a compound annual rate of change, increased from 1.8 percent in the fourth quarter of 2023 to 3.4 percent in the first quarter of 2024. Core PCE inflation (the blue line), which excludes food and energy prices, increased from 2.0 percent in the fourth quarter of 2023 to 3.7 percent in the first quarter of 2024. These data indicate that inflation in the first quarter of 2024 was running well above the Federal Reserve’s 2.0 percent target.

A combination of weak economic growth and above-target inflation poses a policy dilemma for the Fed. As we discuss in Macroeconomics, Chapter 13, Section 13.3 (Economics, Chapter 23, Section 23.3), the combination of slow growth and inflation is called stagflation. During the 1970s, when the U.S. economy suffered from stagflation, Fed Chair Arthur Burns (whose photo appears at the beginning of this post) was heavily criticized by members of Congress for his inability to deal with the problem. Stagflation poses a dilemma for the Fed because using an expansionary monetary policy to deal with slow economic growth may cause the inflation rate to rise. Using a contractionary monetary policy to deal with high inflation can cause growth to slow further, possibly pushing the economy into a recession.

Is Fed Chair Jerome Powell in as difficult a situation as Arthur Burns was in the 1970s? Not yet, at least. First, Burns faced a period of recession—declining real GDP and rising unemployment—whereas currently, although economic growth seems to be slowing, real GDP is still rising and the unemployment rate is still below 4 percent. In addition, the inflation rate in these data are below 4 percent, far less than the 10 percent inflation rates during the 1970s.

Second, it’s always hazardous to draw conclusions on the basis of a single quarter’s data. The BEA’s real GDP estimates are revised several times, so that the value for the first quarter of 2024 may well be revised significantly higher (or lower) in coming months.

Third, the slow rate of growth of real GDP in the first quarter is accounted for largely by a surge in imports—which are subtracted from GDP—and a sharp decline in inventory investment. Key components of aggregate demand remained strong: Consumption expenditures increased at annual rate of 2.5 per cent and business investment increased at an annual rate of 3.2 percent. Residential investment was particularly strong, growing at an annual rate 0f 13.2 percent—despite the effects of rising mortgage interest rates. One way to strip out the effects of net exports, inventory investment, and government purchases—which can also be volatile—is to look at final sales to domestic purchasers, which includes only spending by U.S. households and firms on domestic production. As the following figure shows, real final sales to domestic purchasers declined only modertately from 3.3 percent in the fourth quarter of 2023 to 3.1 percent in the first quarter of 2024.

Looking at these details of the GDP report indicate that growth may have slowed less during the first quarter than the growth rate of real GDP seems to indicate. Investors on Wall Street may have come to this same conclusion. As shown by this figure from the Wall Street Journal, shows that stock prices fell sharply when trading opened at 9:30 am, but by 2 pm has recovered some of their losses as investors considered further the implications of the GDP report. (As we discuss in Macroeconomics, Chapter 6, Section 6.2 and Economics, Chapter 8, Section 8.2, movements in stock price indexes can provide some insight into investors’ expectations of future movements in corporate profits, which, in turn, depend in part on future movements in economic growth.)

Finally, we may get more insight into the rate of inflation tomorrow morning when the BEA releases its report on “Personal Income and Outlays,” which will include data on PCE inflation during March. The monthly PCE data provide more current information than do the quarterly data in the GDP report.

In short, today’s report wasn’t good news, but may not have been as bad as it appeared at first glance. We are far from being able to conclude that the U.S. economy is entering into a period of stagflation.

Latest PCE Report Shows Moderate, but Persistent, Inflation

McDonald’s raising the price of its burgers by 10 percent in 2023 led to a decline in sales. (Photo from mcdonalds.com)

Inflation as measured by changes in the consumer price index (CPI) receives the most attention in the media, but the Federal Reserve looks instead to inflation as measured by changes in personal consumption expenditures (PCE) price index when evaluating whether it is meeting its 2 percent inflation target. The Bureau of Economic Analysis (BEA) released PCE data for February as part of its “Personal Income and Outlays” report on March 29.  

The following figure shows PCE inflation (blue line) and core PCE inflation (red line)—which excludes energy and food prices—for the period since January 2015 with inflation measured as the change in PCE from the same month in the previous year. Measured this way, PCE inflation increased slightly from 2.4 percent in January to 2.5 percent in February. Core PCE inflation decreased slightly from 2.9 percent to 2.8 percent.

The following figure shows PCE inflation and core PCE inflation calculated by compounding the current month’s rate over an entire year. (The figure above shows what is sometimes called 12-month inflation, while this figure shows 1-month inflation.) Measured this way, both PCE inflation and core PCE inflation declined in February, but the decline only partly offset the sharp increases in December and January. Both PCE inflation—at 4.1 percent—and core PCE inflation—at 3.2 percent—remained well above the Fed’s 2 percent target. 

The following figure shows another way of gauging inflation by including the 12-month inflation rate in the PCE (the same as shown in the figure above—although note that PCE inflation is now the red line rather than the blue line), inflation as measured using only the prices of the services included in the PCE (the green line), and the trimmed mean rate of PCE inflation (the blue line). Fed Chair Jerome Powell has said that he is particularly concerned by elevated rates of inflation in services. The trimmed mean measure is compiled by economists at the Federal Reserve Bank of Dallas by dropping from the PCE the goods and services that have the highest and lowest rates of inflation. It can be thought of as another way of looking at core inflation.

In February, 12-month trimmed mean PCE inflation was 3.1 percent, a little below core inflation of 3.3 percent. Twelve-month inflation in services was 3.8 percent, a slight decrease from 3.9 percent in January. Trimmed mean and services inflation tell the same story as PCE and PCE core inflation: Inflation has decline significantly from its highs of mid-2022, but remains stubbornly above the Fed’s 2 percent target.

It seems unlikely that this month’s PCE data will have much effect on when the members of the Federal Open Market Committee will decide to lower the target for the federal funds rate.