The Labor Market Continues to Cool  

As we discussed in this post, most recent data are consistent with the labor market having cooled, which should reduce upward pressure on wages and prices. On Friday morning, the Bureau of Labor Statistics (BLS) released its employment report for August 2023. (The report can be found here.) On balance, the data in the report are consistent with the labor market continuing to cool.

Data from the establishment survey showed an increase in payroll employment of 187,000, which is close to the increase of 170,000 economists surveyed by the Wall Street Journal had forecast. The following figure shows monthly changes in payroll employment since January 2021.
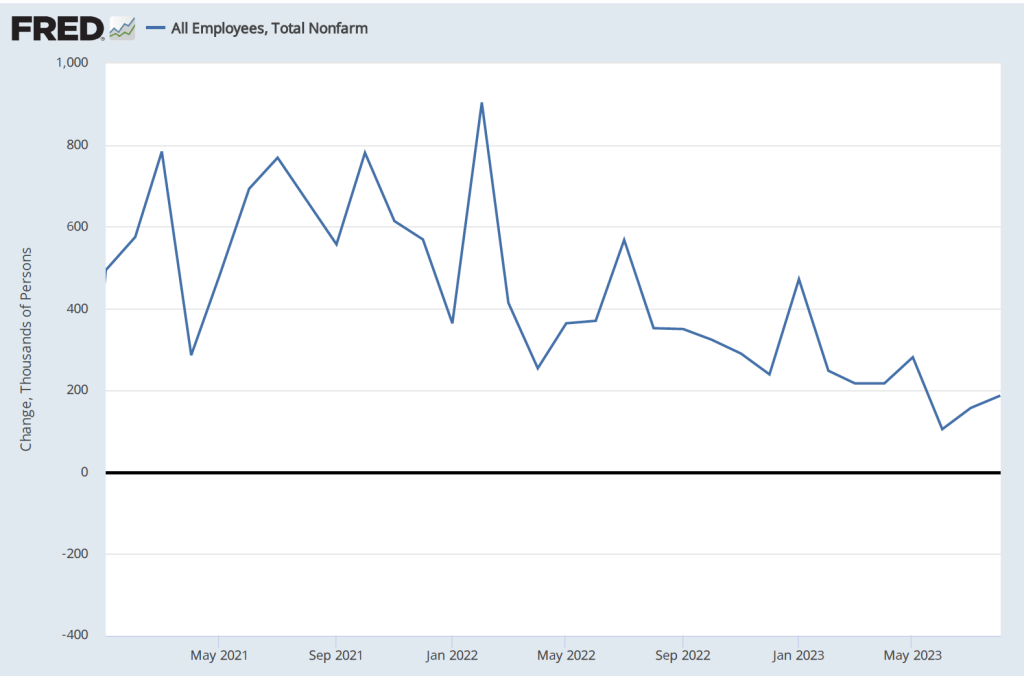
Although the month-to-month changes have been particularly volatile during this period as the U.S. economy recovered from the Covid–19 recession, the general trend in job creation has been downward. The following table shows average monthly increases in payroll employment for 2021, 2022, and 2023 through August. In the most recent three-month period, the average monthly increase in employment was 150,000.

PeriodAverage Monthly Increases in Employment
2021606,000
2022399,000
Jan.-Aug. 2023236,000

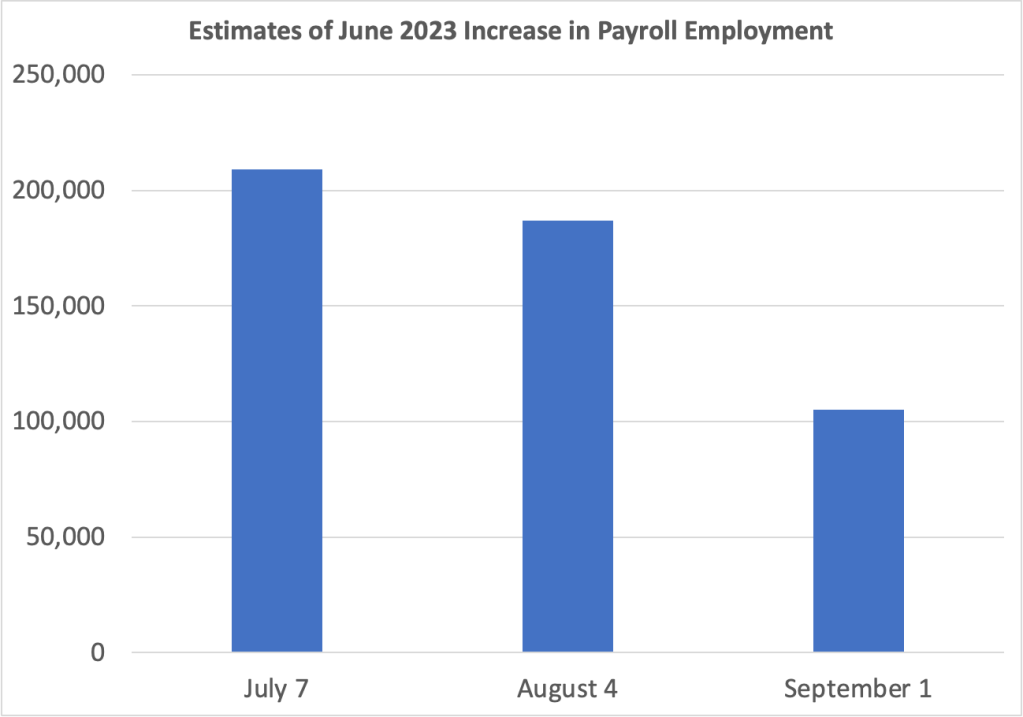
The BLS revised downward its previous estimates of employment increases in June and July by a combined 110,000. The changes to the estimate of the employment increase for June are particularly notable. As the following graph shows, on July 7, the BLS initially estimated the increase as 209,000. The BLS’s first revision on August 4, lowered the estimate to an increase of 187,000. The BLS’s second revision on September 1, lowered the estimate further to 105,000. In other words, the BLS now estimates that employment increased by only half as much in June as it initially reported. As we discuss in Macroeconomics, Chapter 9, Section 9.1 (Economics, Chapter 19, Section 19.1 and Essentials of Economics, Chapter 13, Section 13.1), the revisions that the BLS makes to its employment estimates are likely to be particularly large when the economy is about to enter a period of significantly lower or higher growth. So, the large revisions to the June employment estimate may indicate that during the summer economic growth slowed and labor market conditions eased.
Data from the household survey showed the unemployment rate increasing from 3.5 percent in July to 3.8 percent in August. The following figure shows that the unemployment rate has fluctuated in a narrow range since March 2022. Employment as estimated from the household survey increased by 222,000. The seeming paradox of the number of people employed and the unemployment rate both increasing is accounted for by the substantial 736,000 increase in the labor force.

Finally, as the first of the following figures shows, measured as the percentage change from the same month in the previous year, the increase in average hourly earnings (AHE) remained in its recent range of between 4.25 and 4.50 percent. That rate is down from its peak in mid-2022 but still above the rate of increase in 2019, before the pandemic. But, as the second figure shows, if we look at the compound rate of increase in AHE—that is the rate at which AHE would increase for the year if the current rate of monthly increase persisted over the following 11 months—we can see a significant cooling in the rate at which wages are increasing.

As a reminder, AHE are the wages and salaries per hour worked that private, nonfarm businesses pay workers. AHE don’t include the value of benefits that firms provide workers, such as contributions to 401(k) retirement accounts or health insurance. As an economy-wide average they suffer from a composition effect during periods in which employment either increases or decreases substantially because the mix of high-wage and low-wage workers may change. AHE are also subject to significant revisions. Therefore, short-range changes in AHE can sometimes be misleading indicators of the state of the labor market.

Unraveling the Mysteries of the May 2023 Employment Situation Report

(Photo from the Associated Press via the Wall Street Journal.)

During most periods, the “Employment Situation” report that the Bureau of Labor Statistics issues on the first Friday of each month includes the most closely watched macroeconomic data. Since the spring of 2021, high inflation rates have made the BLS’s “Consumer Price Index Summary” at least a close second in interest to the employment report. The data in the CPI report is usually more readily comprehensible than the data in the employment report. So, we think it’s worth class time to go into some of the details of the employment report, as we do in Macroeconomics, Chapter 9, Section 9.1, Economics, Chapter 19, Section 19.1, and Essentials of Economics, Chapter 13, Section 13.1.

When the BLS released the May employment report, the Wall Street Journal noted that: “Employers added 339,000 jobs last month; unemployment rate rose to 3.7%.” Employment increased … but the unemployment rate also rose? How is that possible? One key to understanding media accounts of the report is to note that the report contains data from two separate surveys: 1) the household survey and 2) the employment or establishment survey. As in the statement just quoted from the Wall Street Journal, media accounts often mix data from the two surveys.  

The data showing an increase of 339,000 jobs in May are from the payroll survey, while the data showing that the unemployment rate rose are from the household survey. Below we reproduce part of the relevant table from the report showing some of the data from the household survey. Note that total employment in the household survey falls by 310,000, so there appears to be no contradiction to explain—the unemployment rate increased because the number of people employed fell and the number of people unemployed rose. But why, then, did employment rise in the payroll survey?

Employment can rise in one survey and fall in the other because: 1) the types of employment measured in the two series differ, 2) the periods during which the data are collected differ, and 3) because of measurement error. The household survey uses a broader measure of employment that includes several categories of workers who are not included in the payroll survey: agricultural workers, self-employed workers, unpaid workers in family businesses, workers employed in private households rather than in businsses, and workers on unpaid leave from their jobs. In addition, the payroll employment numbers are revised—sometimes substantially—as additional data are collected from firms, while the household employment numbers are subject to much smaller revisions because data in the household survey are collected during a single week. A detailed discussion of the differences between the employment measures in the two series can be found here.

Usefully, the BLS publishes a series labeled “Adjusted employment” that estimates what the value for household employment would be if the household survey was measuring the same categories of employment as the payroll survey. In this case, the adjusted employment series shows an increase in employment in May of 394,000—close to the payroll survey’s increase of 339,000.

To summarize, the May employment report indicates that payroll employment increased, while the non-payroll categories of household employment declined, and the unemployment rate rose. Note also in the table above that the number of people counted as not being in labor force rose slightly and the employment-population ratio fell slightly. Average weekly hours (not shown in the table above) decreased slightly from 34.4 hours per week to 34.3.

A reasonable conclusion from the report is that the labor market remains strong, although it may have weakened slightly. Prior to release of the report, there was much speculation in the business press about how the report might affect the deliberations of the Federal Reserve’s Federal Open Market Committe (FOMC) at its next meeting to be held on June 13th and 14th. The report showed stronger employment growth than economists surveyed by Dow Jones had expected, indicating that the FOMC was likely to remain concerned that a tight labor market might continue to put upward pressure on wages, which firms could pass through to higher prices. Members of the FOMC had been signalling that they were likely to keep their target for the federal funds rate unchanged in June. The reported employment increase was likely not large enough to cause the FOMC to change course.

ďżźThe Surprisingly Strong Employment Report for January 2022

Leisure and hospitality was one of the industries showing surprisingly strong job growth during January 2022. Photo from the New York Times.

The Bureau of Labor Statistics’ monthly report on the “Employment Situation” is generally considered the best source of information on the current state of the labor market. As we discuss in Macroeconomics, Chapter 9, Section 9.1 (and in Economics, Chapter 19, Section 19.1), economists, policymakers, and investors generally focus more on the establishment survey data on total payroll employment than on the household survey data on the unemployment rate. The initial data on employment from the establishment survey are subject to substantial revisions over time (we discuss this point further below). But the establishment survey has the advantage of being determined by data taken from actual payrolls rather than by unverified answers to survey questions, as is the case with the household survey data. 

The establishment survey data for January 2022 (released on February 4, 2022) showed a surprisingly large increase in employment of 467,000. The consensus forecast had been for a significantly smaller increase of 150,000, with many economists expecting that the data would show a decrease in employment. The establishment survey is collected for pay periods that include the 12th of the month. In January 2022, in many places in the United States that pay period coincided with the height of the wave of infections from the Omicron variant of Covid-19. And, in fact, according to the household survey, the number of people out of work because of illness was 3.6 million in January—the most during the Covid-19 pandemic. So it seemed likely that payroll employment would have declined in January. But despite the difficulties caused by the pandemic, payroll employment increased substantially, likely reflecting firms’ continuing high demand for workers—a demand reflected in the very high level of job openings.

The employment report includes the BLS’s annual data revisions, which are based on a comprehensive payroll count for a particular month in the previous year—in this case, March 2021. The revisions also incorporate changes to the BLS’s seasonal adjustment factors. Each month, the BLS adjusts the raw payroll employment data to reflect seasonal fluctuations such as occur during and after the end-of-year holiday period. For instance, the change from December 2020 to January 2021 in the raw employment data was −2,824,000, whereas the adjusted change was 467,000 (as noted earlier). Obviously this difference is very large and is attributable to the BLS’s seasonal adjustments removing the employment surge in December attributable to seasonal hiring by retail stores, delivery firms, and other businesses strongly affected by the holidays.

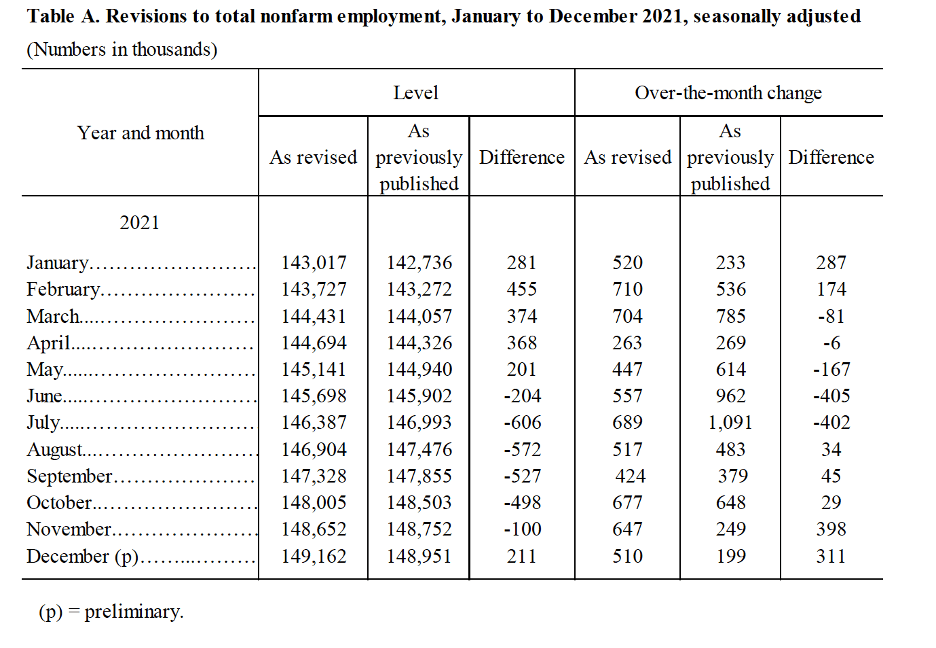
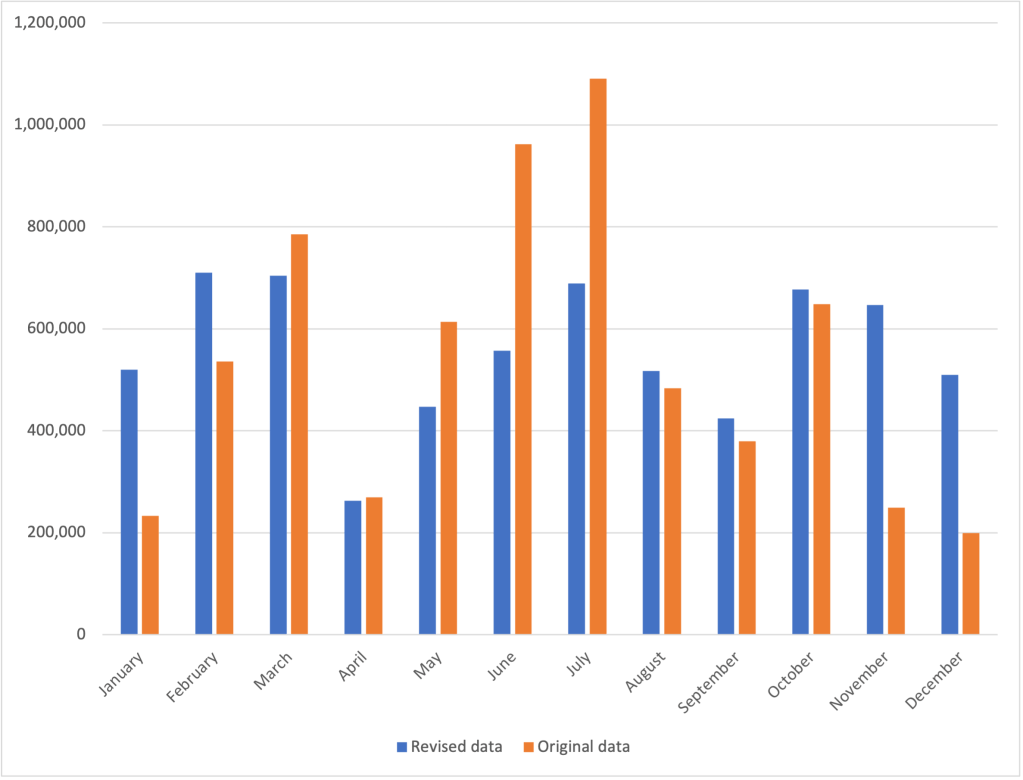
The changes to the seasonal adjustment factors made the revisions to the 2021 payroll employment numbers unusually large. For instance, the BLS initially reported that employment increased from June 2021 to July 2021 by 1,091,000, whereas the revision reduced the increase to 689,000. Table A below is reproduced from the BLS report; the figure below the table shows the changes in employment from the previous month as originally published and as revised in the January report. Overall, the BLS revisions now show that employment increased by 217,000 more from 2020 to 2021 than initially estimated. The BLS expressed the opinion that: “Going forward, the updated models should produce more reliable estimates of seasonal movements. [Because there are now] more monthly observations related to the historically large job losses and gains seen in the pandemic-driven recession and recovery, the models can better distinguish normal seasonal movements from underlying trends.”

Source: The BLS “Employment Situation” report can be found here.